by Shea-Tinn Yeh, Jeff Rynhart, Thomas Dressler and Fernando Reyes
Introduction
Digital collection exhibits have been promoted by museums, historical societies, and libraries around the world to provide public access to cultural heritage, hidden collections, or artefacts. These exhibits are presented with hyperlinks on web pages within a two dimensional (2D) interface. Items of interest are generally sought using a query search mechanism or by browsing in a sequential fashion. However, Toms (2000) experimentally validated the concept that people find information through “accidental, incidental or serendipitous discoveries.” She urged the development of creative approaches to trigger serendipitous retrieval that complements searching and browsing for information acquisition in a digital library.
In this work of adaptive virtual exhibit (AVE), the authors proposed a proof-of-concept project to develop a three-dimensional (3D) exhibit in which visitors are guided by an adaptive interface to view selected 2D digital images from the University of Denver Libraries’ collections. We have also integrated social media features to promote a sense of virtual community. The proposal in the amount of $2,898.45 was awarded in March 2014 by the University of Denver’s Faculty Research Fund (FRF). The concept of the AVE is attributed to the research by Bonis et al. (2013) in which the authors presented a framework for “designing and implementing multiuser virtual exhibitions that adapt visitor’s preferences and goals and foster the emergence of communities with common interests.” Two primary architecture elements were proposed: (1) provide a 3D space for the presentation of objects in a thematic museum area, and (2) update presentation content to reflect visitors’ interests obtained from both initial assumption and the sequence of events between the visitors and the objects with which they interact. Bonis et al. validated their framework by using VRML, Java, Java3D, and TCP sockets as well as designing a semantic graph with calculations to accommodate adaptivity. Our prototype successfully advanced Bonis’s framework by utilizing more readily available and agile technologies including a simple 3D JavaScript Library, API, and the Neo4j graphing database. To date, we have found no extant model that applies this innovation with any university’s digital collections. This article describes the systems design architecture and programming techniques in detail. We hope to generate interest in the library application development community to form collaborative efforts for further AVE development.
Systems Design Architecture
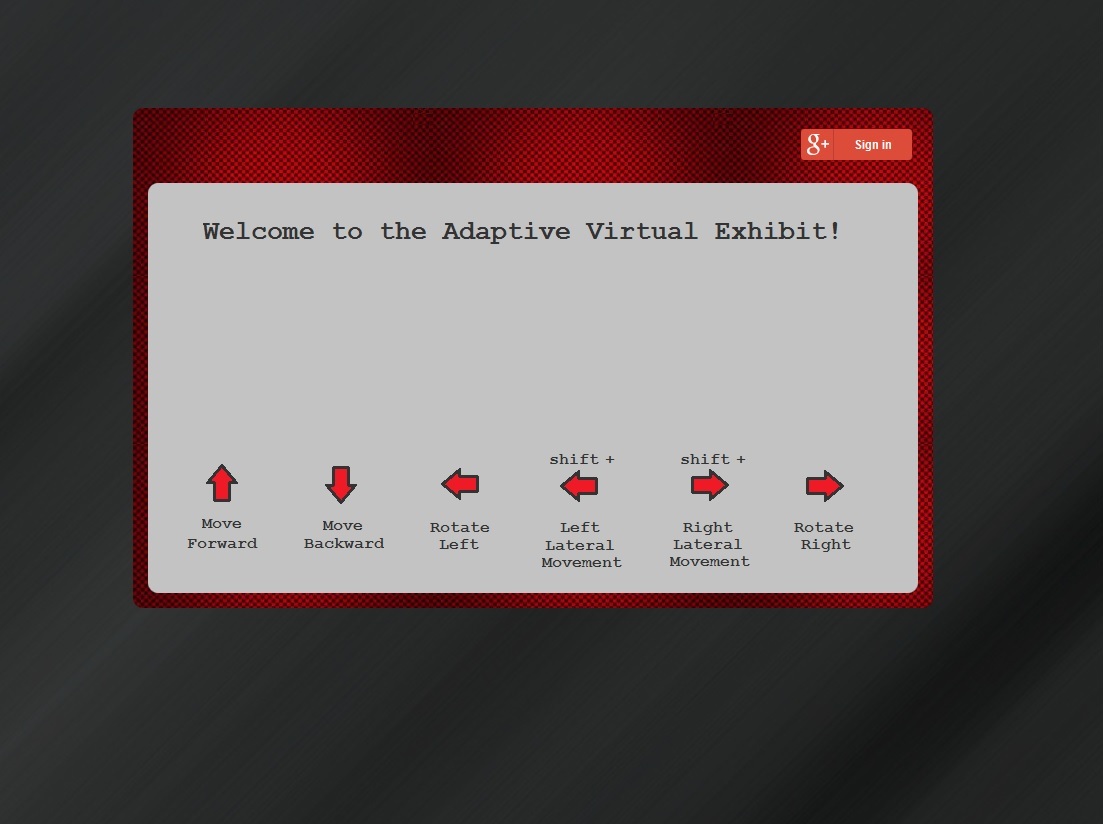
Four components are required in the AVE architecture: authentication, 3D virtual exhibit client, graph database for adaptivity, and the display of metadata for each respective object. After logging into the exhibit with a valid Gmail account (Figure 1), the visitor is presented with a preference form to select a topic of interest (Figure 2). Once selected, the exhibit is populated with items related to this topic. There are four rooms in the 3D virtual exhibit designed as a museum space simulation; each room contains three object display slabs (Figure 3a & 3b). Visitors can move from room to room with the directional keys on the keyboard, viewing the objects within (Figure 3c). They may interact with any object by clicking to open a magnified image, viewing its descriptive metadata, or sharing the object with others on their Google+ profile. These interactions are sent to the database real time, which in turn, increases the attribute of “user interest” to generate adaptivity. The content of the exhibits in the 3D space are subsequently updated based on the adaptivity. Figure 4 illustrates this project’s system design architecture.
The metadata contains creator, description, topic(s), and identifier as elements and are stored in the csv file format. The data is ingested into the graph database with a PHP script that utilizes fgetcsv() function. The script is stored on Bitbucket, a source code management and collaboration solution in the cloud.

Figure 1. Visitor login screen (enlarge)
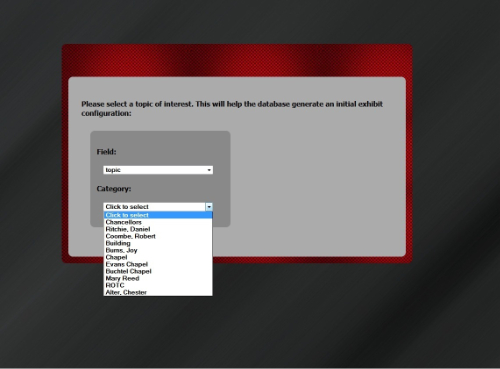
Figure 2. Visitor topic selection form (enlarge)
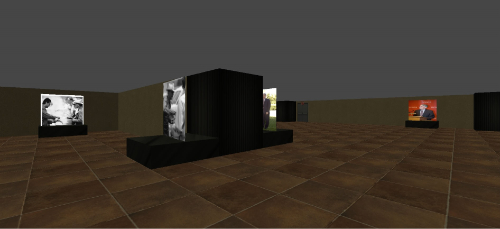
Figure 3a. Virtual exhibit room (enlarge)
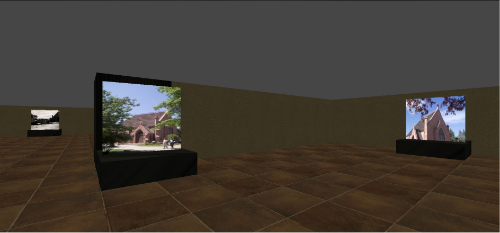
Figure 3b. Virtual exhibit room (enlarge)
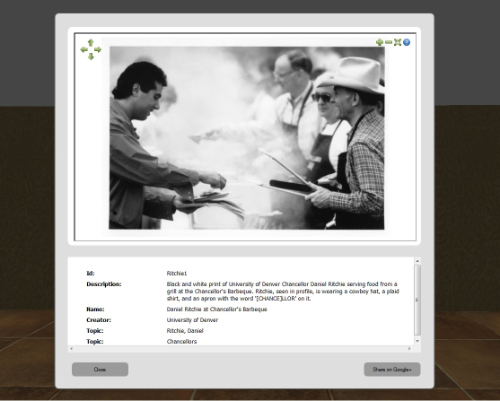
Figure 3c. Descriptive item view (enlarge)
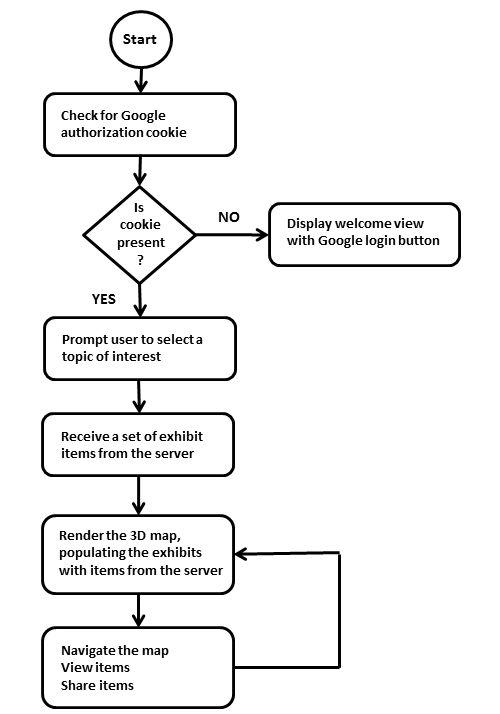
Figure 4. Systems design architecture
Programming Techniques
Authentication
User authentication is accomplished through the Google Auth authentication service. When the visitor’s Gmail credentials are POSTed to the service and validated, Google Auth returns the Gmail address along with a temporary access token. The address is stored in the database as a userID serving as the persistent identifier while the token is stored as a session ID, used to verify a current active session and to share objects of interest.
3D Virtual Exhibit Client
The 3D interface was created with the Three.js JavaScript 3D library/API (http://threejs.org/) for three reasons. First, it creates three dimensional representations of data without needing to install browser plugins. One may argue that browser plugins are beneficial and extensible. On the other hand, designing systems to integrate with third party software is associated with higher maintainability and complexity. Secondly, Three.js allows for the definition, placement, and rendering of 3D shapes with minimal mathematical computation. Thirdly, it assigns texture images to shapes. The library also contains a camera property which renders the view based on the camera’s current coordinates and the angle of the view. This camera vector can be updated during runtime to move the visitor’s vantage point, to allow navigation and interaction with the objects within the 3D space. The application communicates with the server via AJAX calls by transmitting JSON-encoded data, and utilizes a REST API to perform specific actions.
Three main programming tasks are required to emulate a 3D exhibit space and implement the front-end application: (1) 3D exhibit space map construction, (2) digital object display and interaction reporting, and (3) visitor movement. As shown in Figure 5, the exhibit structure is a single square subdivided into four rooms by a cross, with doorways connecting each room to its adjacent rooms. These rooms are created in the browser canvas with walls comprised of 3D cubes. Rooms are designed with various wallpapers so that the visitor is aware of room changes and re-entry of visited areas.
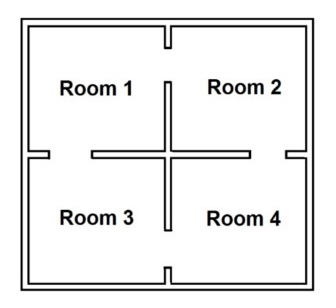
Figure 5. Exhibit room structure
a. 3D Exhibit Space Map Construction
The floor layout was implemented with a 2D array, which allows the rendering of all 3D cubes via a looped iteration of the array elements. The draw function contains a doubly nested for loop that iterates over each element, drawing an object based on the stored numeric value. This value is a 2 digit integer that describes what should be drawn at the corresponding location. The first digit defines the object to be drawn, and the second digit represents an attribute such as orientation or texture. For instance, a value of 13 draws a wall block at the corresponding location, using texture number 3; and a value of 92 places exhibit tables along a wall in direction number 2 (east). A value of 0 in any array position draws nothing and becomes empty space. After the entire array is iterated over, the 2D wall layout is complete, and all objects that appear in the map are inserted as shown in Figure 6.
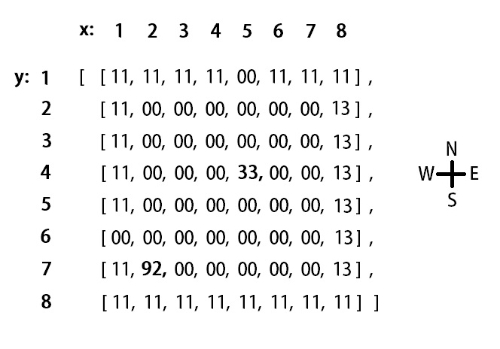
Figure 6. 2d array
b. Digital Object Display and Interaction Reporting
All objects that appear in the exhibit space besides the walls are interactive. This means that they can be clicked by the visitor to initiate an event, or trigger an event as the visitor comes within proximity of the object. Locations of interactive objects must be registered or stored with the map object during runtime. These locations are based on a virtual coordinate system superimposed on a map array as illustrated above.
For interaction reporting, Three.js contains a useful function that projects a ray reaching into the 3D canvas space directly outward from the point of observation; this vector would appear to the visitor as a dot in the center of the screen. Any object behind the visitor’s click is intersected and identified to the application based on the intersection point and the object’s stored coordinates, which are useful for attaching click events to an object or determining proximity to the camera. If the visitor attempts to walk through a wall, the proximity is detected, the current motion cancelled, and the wall appears to be solid. Visitor interaction with items is essential to the adaptivity of the exhibit explained in the upcoming Adaptivity Techniques section .
c. Visitor Movement
The first person vantage point is created with the camera that renders 3D objects using the browser window as a first person perspective. The camera’s location and heading can be updated during runtime, and the objects are drawn to the screen from any resulting viewpoint when the Three.js render function is called. To create the illusion of movement of the vantage point within the 3D space, an animation loop was created to execute this function continuously. This loop is infinite, terminating only when the visitor exits the exhibit or closes the browser window. The position of the camera is altered when the visitor presses the directional keys, and this update happens between the render “frames.”
Movement is created by calculating a vector based on the current camera heading and an established unit of movement, then adding this vector to the current camera position. This is accomplished with a simple and efficient algorithm which computes an x component and a y component for the new vector. For example, if one movement unit is 10 pixels, and the y axis points to 0 degrees in the positive direction, the visitor (at heading 0) moving one unit forward produces components of y:10 and x:0. This advances the camera 10 pixels to the positive y direction, and creates the illusion that the visitor has taken one step forward in the direction of 0 degrees. A step in the heading of 45 degrees produces the components y:5 and x:5, a step along heading 225 will produce x:-5, y:-5 and so forth (Figure 7).
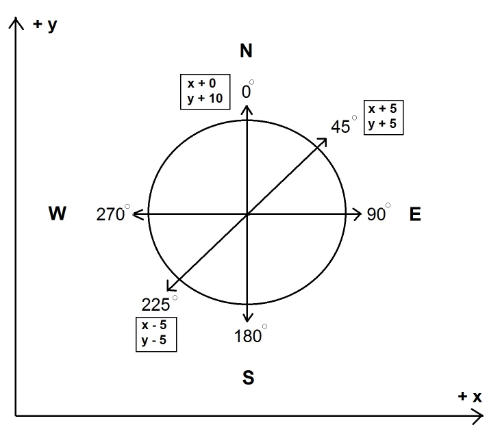
Figure 7. Movement components
Adaptivity Techniques
According to Kobsa et al. (2001), the adaptation process involves three tasks: acquiring information about users’ characteristics and behavior, representing data in a system that draws assumptions about user preferences, and producing personalized content. For this prototype, we acquire the visitors’ characteristics by having them select the initial topic of interest. We track the visitors’ browsing behavior, and we represent data in terms of their relationships.
To store the exhibit data and to implement an adaptive design, the popular graph database Neo4j is used instead of a relational database. Neo4j, sponsored by Neo Technology, is an open source NoSql database implemented in Java and Scala (What is a graph … [updated 2015]). Graph databases are supportive of “relationships” as entities eliminating the need for foreign-keys relationships. Each node in the graph database contains the relationship-records that represent its relationships to other nodes. Therefore the expensive JOIN operation is not necessary in a graph database. In our prototype, if a creator is represented as a node, the creator can have relationships to other data with different entities and attributes. With such a relationship design, this graph database is particularly suited for exploring an adaptive technique. Two levels of nodes are designed in the database: categories and objects. Each object is a child of at least one category node and the category describes some elements of the object. Siblings are nodes which share at least one parent category node. In this design, objects can be related to each other by their common categories, and connections between objects can be determined by tracing their relationships to shared category nodes. The visitor is also represented by a node which is connected to individual category and object nodes with a special type of relationship, one containing an ‘interest’ attribute. The database is adapted to a specific visitor by updating these interest values each time they view an object. After continued use of the exhibit, each visitor will develop a unique set of interest relationships to the objects they have viewed, as well as to objects that are adapted to their interest via common categories. Figure 8 illustrates the relationships between the category and object.
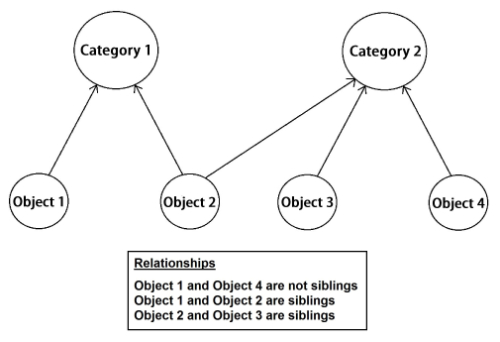
Figure 8. Representation of category, object, and their relationships
To create adaptivity, an algorithm was developed to analyze a visitor’s unique interest values. The interest amount increases in three situations: (1) when the visitor comes in close proximity to a specific object, (2) when the visitor opens an object’s metadata view dialog for more than 10 seconds (the average time needed to read through item descriptions of an object), and (3) when the visitor shares the object to their Google+ profile. After the object and time data are POSTed to the server via an ‘interest increase’ request, the interest value of the viewed object is updated in the database, along with the interest values of all objects related to it. Based on these current values, the database utilizes algorithms implemented with the Phalcon PHP framework to gather a set of objects to return to the client, which then refreshes the objects displayed in the 3D exhibit space. The assumption is that the visitor is likely to have interest in other items that share attributes with the item of current interest. For example, a visitor who views various portraits of Chancellor Ritchie may be delighted to discover the carillon in the bell tower in the Ritchie Center on the University of Denver campus. Figure 9 illustrates the interest value design in the database and figure 10 describes the adaptivity techniques.
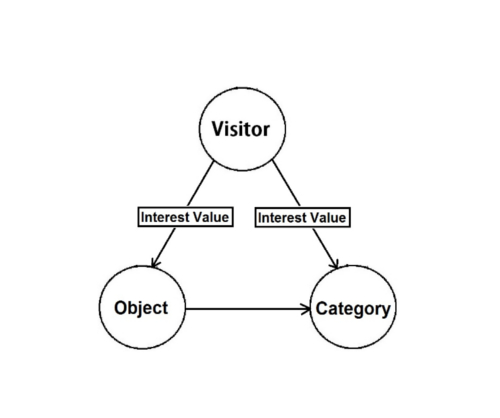
Figure 9. Interest value design in the Neo4j graph database
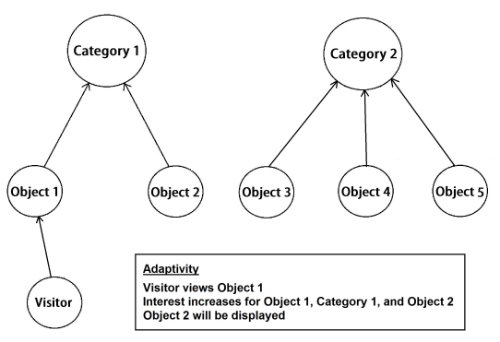
Figure 10. Adaptivity technique
Conclusions
Due to limited availability of funding, this study has a few limitations. First of all, we prototyped the concept rapidly and experimented with one direction of presenting adaptivity, i.e. visitor’s interaction with the objects. There are other possible ways to promote serendipity. For example, Toms (2000) suggested the exploring of “role of chance” or “blind luck” as well as “reasoning by analogy” which are complex, yet intriguing concepts. Secondly, we required authentication with a Gmail account to enable social media features. This can be redesigned to utilize other methods without authentication requirements. Thirdly, we did not factor in privacy concerns nor implement responsive design as part of the development scopes. Fourth, the amount of fitting objects and their metadata obtained from the targeted collections was small, thus difficult to guarantee relatedness. This limitation can be overcome with enriched and quantified metadata. Finally, the prototype is not currently available outside of the university firewall. When we identify a team of developers to further implement AVE, we will propose a University sponsored development environment for external collaboration and usability testing.
3D interfaces are a paradigm shift away from 2D representations that are based on icons, menus, and pointers. An exhibit presented in a 3D environment simulates the visitor’s experience with a feeling of being present within an exhibit space. Adaptive computing applied in interface design seeks to personalize the behavior of a system to reflect the user’s particular search goals, attitudes, and interests. Both of these technological advances have been widely adopted in the video gaming industry; however, this is the first work that explored these techniques with a university’s digital assets. Accordingly, there is also a lack of literature about these technologies in the Library and Information Science discipline. The authors hope to generate interest in the library application development community and form an alliance to make the AVE available for general deployment. What we envision is to not only address the current limitations but also build a 3D adaptive interface for 3D objects.
Acknowledgement
This project was funded by a $2,898.45 Faculty Research Fund (FRF) from the Office of Research and Sponsored Programs at the University of Denver. The authors would like to thank Andrew Darby for his valuable comments and suggestions to improve the quality of the paper.
References
Bonis, B., Vosinakis, S., Andreou, I., Panayiotopoulos, T. (2013). Adaptive virtual exhibitions. Journal of Library & Information Technology 33(3): 183-198.
Kobsa, A., Koenemann, J., Phol, W. (2001). Personalized hypermedia presentation techniques for improving online customer relationships. The Knowledge Engineering Review 16(2): 111-155.
Toms, E. (2000). Serendipitous information retrieval. In Proceedings of The First DELOS Network of Excellence Workshop: Information Seeking, Searching and Querying in Digital Libraries, Zurich, 11-12 December, 2000. Available from: http://www.ercim.eu/publication/ws-proceedings/DelNoe01/3_Toms.pdf
What is a graph database? [Internet]. [updated 2015]. Available from: http://neo4j.com/developer/graph-database/
About the Authors
Shea-Tinn Yeh
Library Digital Infrastructure and Technology Coordinator, University of Denver Libraries
Email: sheila.yeh@du.edu
Jeff Rynhart
Systems Programmer II, University of Denver Libraries
Email: jeff.rynhart@du.edu
Thomas Dressler
Programmer, Webroot
Email: thomas.dressler1@gmail.com
Fernando Reyes
Senior Systems Analyst, University of Denver Libraries
Email: fernando.reyes@du.edu

Subscribe to comments: For this article | For all articles
Leave a Reply