by Brighid M. Gonzales
Introduction
OCLC’s EZproxy is an authentication software that allows libraries to authenticate their remote users for access to the library’s subscription resources. In addition to authenticating users, EZproxy allows for a great deal of customization in its configuration, including what type of log files are collected on the server and what information is collected within those logs. While some of these logs, like the audit logs and message logs, can be useful for troubleshooting user access, monitoring usage limits, and debugging database access problems, others collect the type of specific, detailed information that libraries can analyze to find useful data and trends on how their resources are being used. In particular, EZproxy’s default monthly logs and the non-default SPU (Starting Point URL) logs collect a great deal of information on resource usage. Parsing and analyzing that data can be difficult, even with the assortment of free and ready-made tools that exist for that purpose. In some cases, using Python along with its collection of data analysis-specific modules can ultimately lead to better and more useful data for libraries.
Collecting the Data
EZproxy’s default monthly logs are automatically generated by this command in the configuration file:
LogFormat %h %l %u %t “%r” %s %b
The data collected by this directive includes the user’s IP address (%h), the user’s username if it is available (%l), the session id (%u), a time and date stamp (%t), the http request (“%r”), the status of the request (%s), and the bytes transferred (%b).
EZproxy’s SPU logs are so-named because they collect information about the “Starting Point URL,” [1] a URL to a protected resource that is appended to the EZproxy login URL so that a user is forced to login before accessing that resource. In addition, administrators can add a variety of other fields to the directive to configure EZproxy to log other information as well. Because it collects information on a user’s starting point as well as other configurable data, the Sueltenfuss Library at Our Lady of the Lake University decided to implement SPU logs in our EZproxy configuration and use those logs for data analysis. The LogSPU command configured by the Sueltenfuss Library contains the following directives:
LogSPU -strftime SPUlogs/spu%y%m%d.log %h %t %u
%{ezproxy-session}i %U %b %{ezproxy-spuaccess}i %{referer}i
From this directive, the EZproxy server creates an SPU log file for each day of the month and saves it in a folder on the server named SPUlogs. The data collected by this directive includes the user’s IP address (%h), a time and date stamp (%t), the user’s username if it is available (%u), the session id (%{ezproxy-session}i), the requested URL (%U), the bytes transferred (%b), whether the user is on or off campus (%{ezproxy-spuaccess}i), and the URL that referred the user to the EZproxy login (%{referrer}i). Many other pieces of data can be collected by adding other fields [2] to the directive in the EZproxy configuration file.
Parsing the Data
While OCLC’s website says that it doesn’t endorse any one program for log file analysis, it does list six different programs that can be used to analyze EZproxy log files: AWStats, EzPAARSE, FastStats Analyzer, Sawmill, The Webalizer, and XpoLog [3].
Sueltenfuss Library had previously tried using EzPAARSE without success, and before implementing the Python script had been using another free program not on the list called Analog [4] to analyze EZproxy log files. Running Analog on the EZproxy SPU log files results in an HTML file which can then be saved as a PDF for sharing and preserving the monthly data. While some of the information gleaned from the output report was useful, such as the number of requests by day of the week and by hour of the day, which gave us a good idea of what days and times the server was most used, other information, such as the referrer and request reports, were less useful. Since many of the URLs captured were dynamically constructed and included session information and search query information among other things, they were often several lines long and it was difficult for the program to parse them in a way that provided any meaningful information. A majority of the data collected in the logs and parsed by Analog ended up not being useful to us at all.
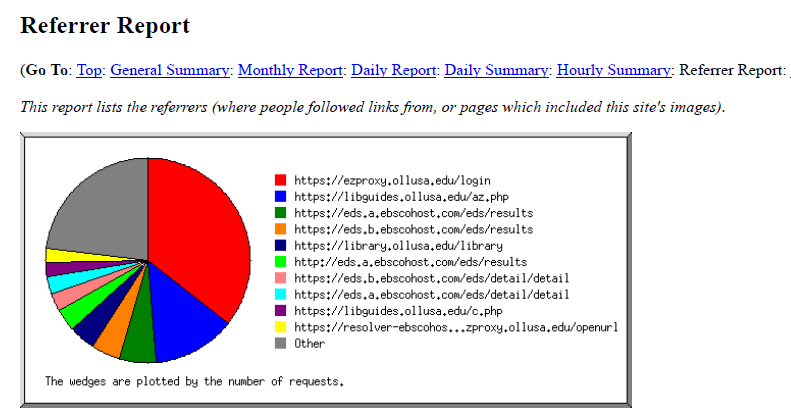
Figure 1. A chart from Analog’s report showing referring URLs
The library decided that we could get better and more useful information from the log files by writing a script to parse the file ourselves. We decided on using Python, a scripting language often used for analyzing large data sets, with the Python libraries Pandas for analyzing the data and Matplotlib for visualizing the data.
The first step was to decide what information from the log files we wanted to analyze. The IP address, while not that useful in itself outside of troubleshooting, could ultimately be used to get an approximate geographical location for the user. In addition to knowing where our users were located, the time and date stamp could give us information about what day of the week, day of the month, and hour of the day they were using EZproxy. Like the IP address, the username was not inherently useful outside of troubleshooting, however, the username could be used to find out the user’s status on campus (whether they are a regular on-campus student, a remote graduate student, a doctoral student, faculty, etc), which would ultimately be useful information. Neither the session id nor the number of bytes transferred were particularly useful for us, so we opted to ignore that data in the files. The next piece of information was whether the user was accessing EZproxy from on or off campus, which was also information we wanted to analyze. That left the referring URL and the requested URL, which would give us more information about which resources our users were requesting access to, and what site they were on when they requested that access.
After determining which information from the logs needed to be kept, the next step was to parse each of the logs line by line so that each piece of data we wanted could be saved individually. To accomplish this, one month’s worth of EZproxy SPU log files were copied and saved into a folder named ‘ezproxy_logs.’ In Python, we first had to import ‘glob’ and ‘os’ which allow us to access all of the files from the ‘ezproxy_logs’ folder. Then we went line by line through each file in the folder and split each line into an indexed list in order to access each of the data variables separately. The following code accomplished this:
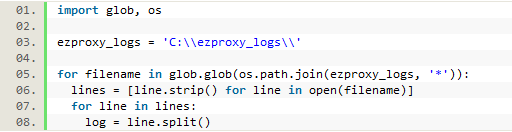
Figure 2. Python code to go through each log file line by line
In this single line from the first log file, the code above splits the line into a list, with each element then accessible by its index number:
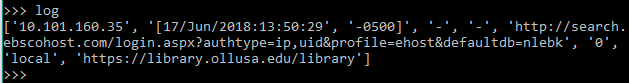
Figure 3. One line from a log file split into a Python list
In this case, log[0] (the first index of the list) represents the IP address. The time and date stamp has been split because of the space between the time and date stamp and the time zone indicator. So log[1] and log[2] together represent the full time and date. The username (log[3]) and the session id (log[4]) are both dashes, meaning this user was on campus and passed through to the resource without being required to login. This is confirmed by log[7] which has been recorded as ‘local,’ (but would be recorded as ‘proxy’ if the user was off campus). The URL the user requested is log[5]. The ‘0’ in this line is the number of bytes transferred, log[6], which is data we are not keeping. Finally at the end of the line log[8] represents the referring URL. Each of the elements in this list can now be saved to a variable for later use, leaving out the data that we previously decided not to analyze (the session id and the number of bytes transferred, or log[4] and log[6]:
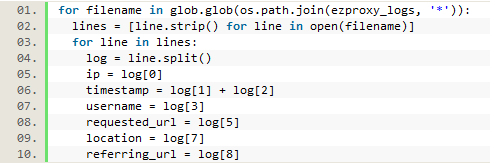
Figure 4. Saving each part of the line as a separate variable.
Cleaning Up and Refining the Data
Before simply recording all of these variables in a csv file, we first cleaned up the data and recorded it the way we ultimately wanted to be able to use it. For instance, we didn’t really want the user’s IP address; we wanted their location. There are many services available online which will translate an IP address into an approximate geographic location; some paid and some free. We chose to use one called ipstack because it is free for up to 10,000 requests per month, enough for analyzing a month’s worth of our EZproxy logs.
After registering with the service we received an access key which allowed us to run an IP address through their API and get back JSON data which included a country, state/region, and city, each of which were saved instead of the IP address. If the location can’t be determined, the API returns ‘None,’ which we changed to ‘Unknown’ before saving. We also combined the city and state rather than just saving the city in order to disambiguate cities of the same name. In order to retrieve the data from the API, we needed to import the Requests and JSON modules at the top of the file.
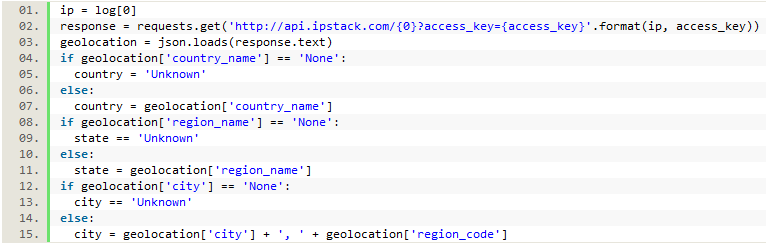
Figure 5. Using the ipstack API to get location data from the IP address
Next, we needed to convert the timestamp data into data we could more easily analyze. When using the Analog program, we were able to analyze the log files to find out what days of the week and hours of the day were most active for our EZproxy users. We wanted to record similar information here, as well as the day of the month. Since all of the time zone information recorded by EZproxy is the same, we left out that element, using only log[1], which returned this:
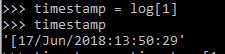
Figure 6. Raw timestamp data pulled from a log file
To eliminate the ‘[‘ at the beginning of the string, we trimmed it off using a slice:
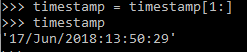
Figure 7. Timestamp data with extra characters removed
We first split the timestamp using the ‘/’ as a separator to give us the day first, then the month, and then the year plus time. Then we spliced the year/time element to pull out just data we wanted, namely the hour. We also wanted to find out the day of the week so we could analyze that data as well. This information was not explicitly in the log, but we used the information that was there to get it using a Datetime function. To use this function, we needed to import the Datetime module, and we also needed to know the year, a number representing the month, and the day of the month. From the timestamp data, we had all of that information already except that the month was saved as a string abbreviation of the name of the month, rather than the number (‘Jun’ rather than 6).
To accommodate this, we created a dictionary with the month abbreviations as keys and each assigned a corresponding number value (‘Jan’: 1, etc.). Since the Datetime function returns a number representing the weekday (with 0 = Monday, 1 = Tuesday, etc.), we also created a list of the weekdays starting with Monday. This allowed us to save the day of the month, weekday, and hour of the day to our collected data for analysis.
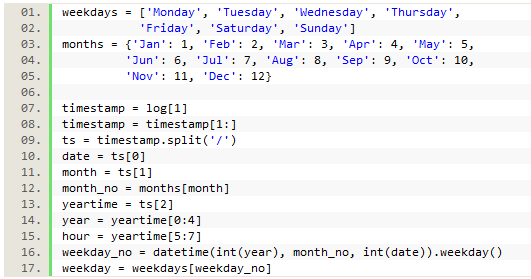
Figure 8. Code parsing the timestamp into separate pieces of data
The information in log[7] provided us with data about whether the user went through the proxy to access a resource (i.e., is off campus), or not (i.e., on campus). If a user is on campus they are passed through the proxy server without being required to login, which results in very little data being collected about that user, such as their IP (i.e., their location). To correct this, we automatically saved local geographic data if the user was on campus, as well as a location of ‘on campus.’ If they were logged as going through the proxy, their location was recorded as ‘off campus.’
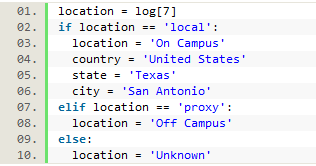
Figure 9. Recording location data
The most difficult information to parse were the usernames and the URLs. Since we didn’t actually want to record the user’s identity, we had to implement a way to get the information that we actually wanted, which was their status at the university. To do this, we created a csv file where each username was matched with the user’s university status (online student, on campus undergrad, distance master’s students, etc.) from user records pulled from the university’s Colleague system. After opening this file in the Python script, we looped through it row by row to save the key-value pairs into a dictionary named ‘users’ to be used later. To do this we also needed to import the CSV module.
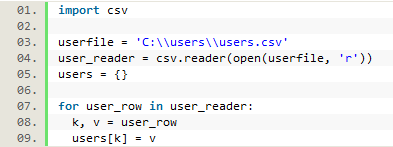
Figure 10. Creating a user dictionary
The username was collected from the log file, then passed through the user dictionary to retrieve and save the user’s status, with the username ultimately discarded.
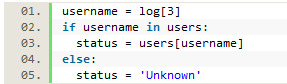
Figure 11. The username is used to find the user’s status
The requested and referring URLs were particularly difficult to parse as the captured URLs are often several lines long and contain numerous special characters. They also often contain our proxy information, and many contain search query data which is something we neither wanted nor needed to keep.
Trying to match each URL to an individual database, while potentially possible, would be even more difficult and ultimately be more granular data than we felt we needed. Instead, we created a csv file with key words or URL snippets that would identify a longer URL as being part of a particular provider’s resource. For instance, all URLs containing ‘ebsco’ would be identified as part of our Ebsco databases (though we did separate out URLs that came from EDS and those that came from a search in Ebsco versus from a link resolver). Other database providers and packages were added to the csv file in this way as well. We looped through this file to create a database dictionary, and then used the dictionary to create a list of keys that could be looped through to match each logged URL.
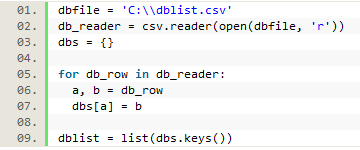
Figure 12. Creating a database dictionary
Since the logged URLs were so unwieldy it was necessary to first strip them down to their most essential elements. We used re.sub to strip out different variations of our proxy prefix first. Next we split the long string into smaller parts by separating on a common character usually found multiple times in the URL (first an ‘=’ sign, then a ‘%’ sign), and then only saving the first section, which would hopefully contain the main domain of the URL). If, after stripping out all of the proxy information, nothing was left, we saved that URL as an EZproxy login URL. If something was left, we ran a loop where each element in the previously created list of database keys was compared to the URL. If an element from the list was found, it was used against the database dictionary to get the value that was then saved. This same process was used for both the referring URLs and the requested URLs from the log files.
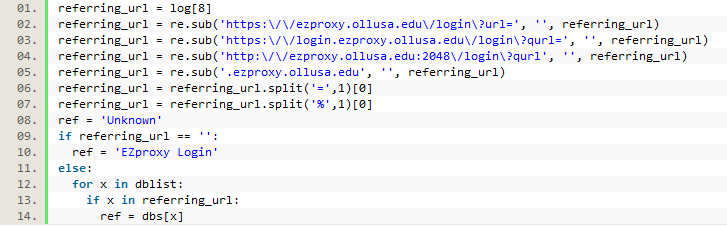
Figure 13. Matching a URL to a database
Finally, each of the saved elements was written out to a csv file, after which the loop would return to the beginning to gather the same data from the next line in the log file.
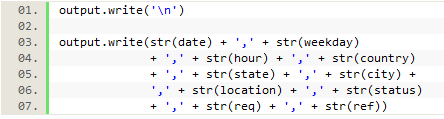
Figure 14. Writing the data to a csv file
Analyzing and Presenting the Data
At the end of this process we had a complete csv file of raw data saved for the month of EZproxy log files. While it is useful to have the raw data on file, to get the most out of the data, we needed to first analyze the data and then find a way to share and present the data with others. For this part, the Pandas and Matplotlib modules in Python are especially useful.
After importing both modules, we used Pandas to open the new csv file into what is referred to as a dataframe, which can then be analyzed using Pandas. We wanted to analyze each data variable and then use the data to create sets of x and y values that could then be plotted onto a chart. For example, one of the variables that was saved was the state the user was in (extracted from their IP address in the logs). After creating the dataframe, we used Pandas to group and then count the number of sessions by state. Since all 50 states (as well as any non-U.S. regions) would be too much for one chart, we limited it to the top 10 represented states. Finally, since we used the ‘Date’ column to count instances of each state, we renamed the columns so that they appeared as ‘State’ and ‘Sessions.’

Figure 15. Counting the number of sessions by state
This produced a list of the top 10 states with the most EZproxy sessions from our data:
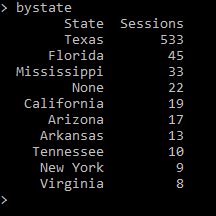
Figure 16. Top 10 most EZproxy sessions by state
Since a percentage is often more useful than a number, we added a percent column to our data by dividing the number of sessions in each state by the total number of sessions for all states, then manipulating the raw decimals so that they appeared as easy to read percentages.

Figure 17a. Adding a percent column
This resulted in a new dataframe that looked like this:
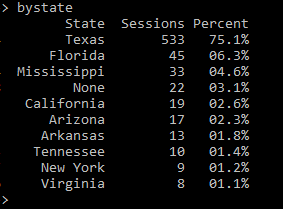
Figure 17b. Adding a percent column
We then saved the list of states and the list of session data as Python lists, so those lists could be used as x and y values to plot a chart using Matplotlib.
![]()
Figure 18. Creating lists of x and y values
The following code was used to plot and save a chart of this data using Matplotlib:
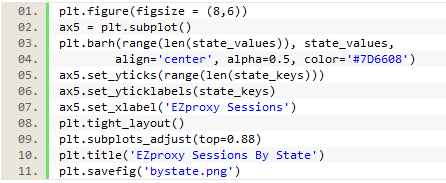
Figure 19a. Creating a chart with Matplotlib
The resulting chart appeared like this:
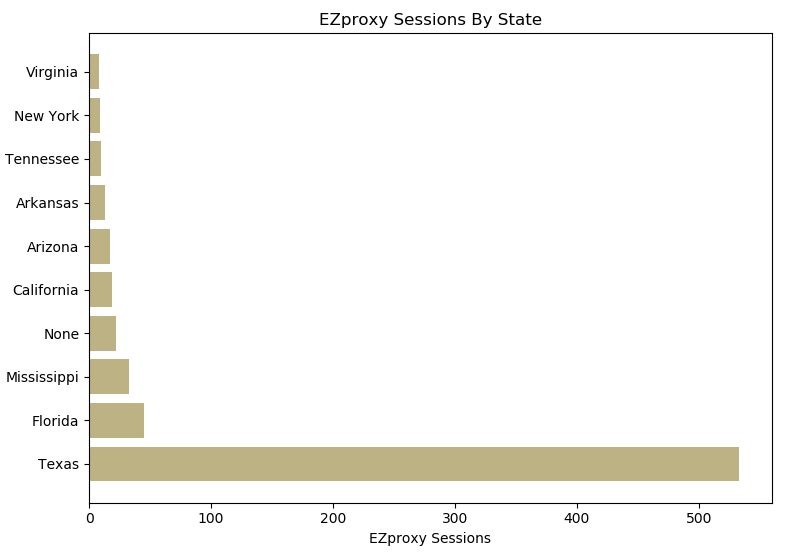
Figure 19b.
This code can also be used on each of the other pieces of data that was saved to create a complete set of charts for the logged data. Using the ‘to_html()’ method on each dataframe also allows us to include a printed table of data with each chart when we create the final html file.

Figure 20. Writing the chart and table data to an html file
The result is a complete html file of visualized data for that month of EZproxy logs, which can then be printed to PDF and shared or saved.
Conclusion
When considering the best way to analyze EZproxy server data, it helps to begin by first thinking about what data will be the most useful to you and what data may not need to be collected in the first place. For example, username data, while useful for troubleshooting user access issues, may not need to be part of the EZproxy log analysis. If retaining that kind of identifying data, care should be taken to protect the privacy of the user with anonymization. Data with identifying information should not be retained any longer than necessary.
Many alternate programs already exist that can help libraries parse and analyze their EZproxy data, many of them free. However, using Python to create a custom script gives each library the opportunity to collect exactly the data they need and analyze it in the way that will be the most useful to them. Being able to visualize the data from our EZproxy server logs has given us useful insights such as the days and times of the month when the server is the most and least busy, allowing us to better plan for upgrades and maintenance. Seeing from the data that a specific section of our off-campus students use EZproxy more heavily than others can help us better direct some of our future outreach and instruction strategies. Future refinement of the analysis process could include better, more detailed parsing of the requested and referring URLs or potentially the collection of additional information in the logs themselves.
The complete script for analyzing EZproxy log files using Python can be found on the author’s Github page: https://github.com/bmgonzales/EZproxy_LogFileAnalysis
About the author
Brighid M. Gonzales is the Web Services/Technology Librarian at Our Lady of the Lake University in San Antonio, Texas, where she manages the library website as well as library-specific software such as EZproxy, ILLiad, and LibGuides. Email: bmgonzales@ollusa.edu.
Notes
[1] More information about starting point URLs can be found at https://www.oclc.org/support/services/ezproxy/documentation/concept/starting_point_url.en.html
[2] More information about the LogFormat directive and possible fields that can be added to it can be found at https://www.oclc.org/support/services/ezproxy/documentation/cfg/logformat.en.html
[3] More information about tools for EZproxy log file analysis suggested by OCLC can be found at https://www.oclc.org/support/services/ezproxy/documentation/manage/log-files.en.html#1480337837
[4] More information about Analog can be found at http://mirror.reverse.net/pub/analog/

Subscribe to comments: For this article | For all articles
Leave a Reply