by Monica Maceli
Introduction
Controlling environmental conditions is an important tool used in preserving collections, with building design and HVAC systems widely used to achieve the desired conditions. Tools used in conjunction with HVAC systems are independent datalogger devices, which store and monitor data such as temperature, relative humidity, light, and air quality. Commercial devices in this realm are available from vendors such as Onset® (with HOBO® dataloggers) and the Image Permeance Institute (IPI). These range from simple dataloggers with USB access (such as the PEM2® dataloggers) to more complex and costly networked solutions that include WiFi or Bluetooth capabilities. [1] Used in combination with data collection devices are tools for reporting and data analysis. The IPI’s eClimateNotebook® is a popular choice for integration with IPI’s dataloggers or other devices whose data can be imported in a suitable text file format.
Challenges have emerged over time with the use of these devices in practice, with archival professionals occasionally turning to devices in other domains, such as weather monitoring stations or low-cost generic consumer temperature sensors to overcome these issues. A review of related literature and the findings of a focus group with archival practitioners revealed notable problems including difficulty monitoring collections that are housed off-site, budgeting for costly devices, excessive time spent in collecting data by hand from dozens of devices, and maintaining devices that are unable to be recalibrated easily. [2] The available commercial devices can be both costly and inflexible in supporting new uses or novel data analysis tools and methods.
Though there is existing research in this area that has focused on developing and deploying wireless sensor networks (WSNs) for environmental monitoring within cultural heritage organizations (e.g., Londero et al., 2016; Klein et al., 2017) these have not yielded reusable, open hardware and software solutions that could more widely serve cultural heritage organizations. On a much smaller scale, a simple temperature and humidity logger is a popular do-it-yourself (DIY) project that many tinkerers with interest in microcontrollers have created. There are numerous open source projects, tutorials, and Github repositories with creators showcasing their code and solutions in this area, though the majority approach these projects from the home automation perspective and do not specifically address the needs of cultural heritage organizations.
The Beginning: A Simple DIY Datalogger
The author’s prior research has explored stand-alone alternatives to popular and easy-to-implement dataloggers which serve small collections well without the need for complex networked features. In the summer of 2017 a prototype datalogger was constructed and tested using the Raspberry Pi™, a popular low-cost single-board computer, which provided temperature and humidity sensing and stored data locally and to the cloud in a Google Sheet. More detailed findings are reported in Maceli, M. & Cocciolo, A. (2017).
The device performed comparably to a similarly-featured commercial device (the PEM2® Datalogger) for approximately ¼ the price. Reviewer and practitioner feedback suggested that the device should be independent of power and networking requirements, have better calibrated sensors, be smaller and more unobtrusive, and have the ability to read data from multiple sensors distributed throughout a larger monitored space. In addition, practitioners noted the staff time lost in needing to physically collect data from each device via USB drive, as is a common feature with such dataloggers. For organizations with 60+ devices, an entire staff member’s day might be taken up with collecting data and replacing batteries.
Exploring Wireless Solutions
The next iteration on the environmental monitoring system, dubbed the “EnviroPi”, intended to manage the tradeoffs identified in prior research work, as well as support the needs of practitioners expressed in a critique of the Raspberry Pi™-based datalogger. The goal of the project was to create an environmental monitoring system made with readily-available off-the-shelf components, capable of being constructed using hobbyist level skills, and using open protocols, software, and hardware as much as possible.
A popular protocol for Internet of things devices is Bluetooth Low Energy (BLE), which was released in 2009. Distinctly different than the original Classic Bluetooth, BLE enables smaller, more power optimized devices and is natively supported by most modern mobile and desktop operating systems. Within BLE specifications, Generic Access Profiles (GAP) allow BLE devices to advertise their name and services, with devices serving as peripherals that connect to a more powerful central device.
Bluetooth Low Energy specifications also detail Generic Attributes (GATT) services: collections of characteristics and relationships to other services, for example, heart rate monitor data in a wearable device. Of relevance to this project, the Environmental Sensing Service (ESS) exposes measurement data from an environmental sensor that can include temperature and humidity. By using GATT standard services, any BLE standard device capable of serving as a central device, such as a smartphone or laptop, can view the sensor data provided. Furthermore, due to the use of the standard BLE identifiers for temperature and humidity, the data is automatically recognized as environmental sensing data (e.g., as seen in the mobile app screenshot in Figure 1, below). Given the many potential benefits of BLE in lightweight sensing projects, this project explored using BLE-enabled Arduino devices as mobile battery-powered data collection stations, placed in the environment as needed, that advertise and transmit data using the standard BLE Environmental Sensing Service.
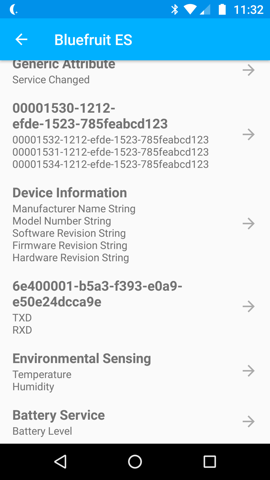
Figure 1. Bluetooth Low Energy (BLE) device advertising its name “Bluefruit ES” as well as temperature, humidity, and battery level services (at the bottom of the screenshot), as viewed within a general-purpose BLE mobile app
Employing Arduino and Raspberry Pi™
Arduino is a commonly-used open source electronics platform, with robust software support and numerous expert communities and resources online. There are a dizzying array of Arduino devices and compatible sensors available with different hardware features and price points. In the case of this project, only Arduinos with an integrated Bluetooth Low Energy module were considered, which narrowed the field considerably. The potential devices were further assessed based on size, ease-of-use (e.g., those with pre-existing software libraries, minimal soldering, vendor-provided documentation, and public forums), use of open source hardware, and inclusion of Bluetooth Low Energy (BLE) modules to transmit data wirelessly in a potentially non-networked space. Most devices in this category use Nordic Semiconductor’s popular nRF51822 Bluetooth Low Energy chip to provide BLE capabilities.
Though many potential devices (Figure 2, below) were reviewed and experimented with, the Adafruit® Feather 32u4 Bluefruit with the Adafruit® Si7021 Temperature & Humidity Sensor Breakout Board ultimately fit the requirements best and were simplest to implement using Adafruit software libraries. The temperature and humidity sensor chosen provided higher accuracy than those used in the previous datalogger, with ± 3% relative humidity accuracy and ±0.4 °C temperature accuracy. Many of the devices assessed can serve only as a BLE peripheral that transmits data and have limited storage space and features, so the system was designed such that all of the sensing devices connect wirelessly via BLE to a more powerful central hub, powered by a Raspberry Pi™.
The Raspberry Pi™ 3 Model B+ supports BLE natively (as does the smaller Raspberry Pi™ Zero W model) and provides the more robust computing power necessary to host a MySQL database to store data, as well as a web server to present data visualizations to viewers or JSON endpoints for use by other services. This also provides the future flexibility to integrate with many popular and powerful data dashboard and analysis tools, most of which can read data live from a relational database or JSON endpoint as needed.
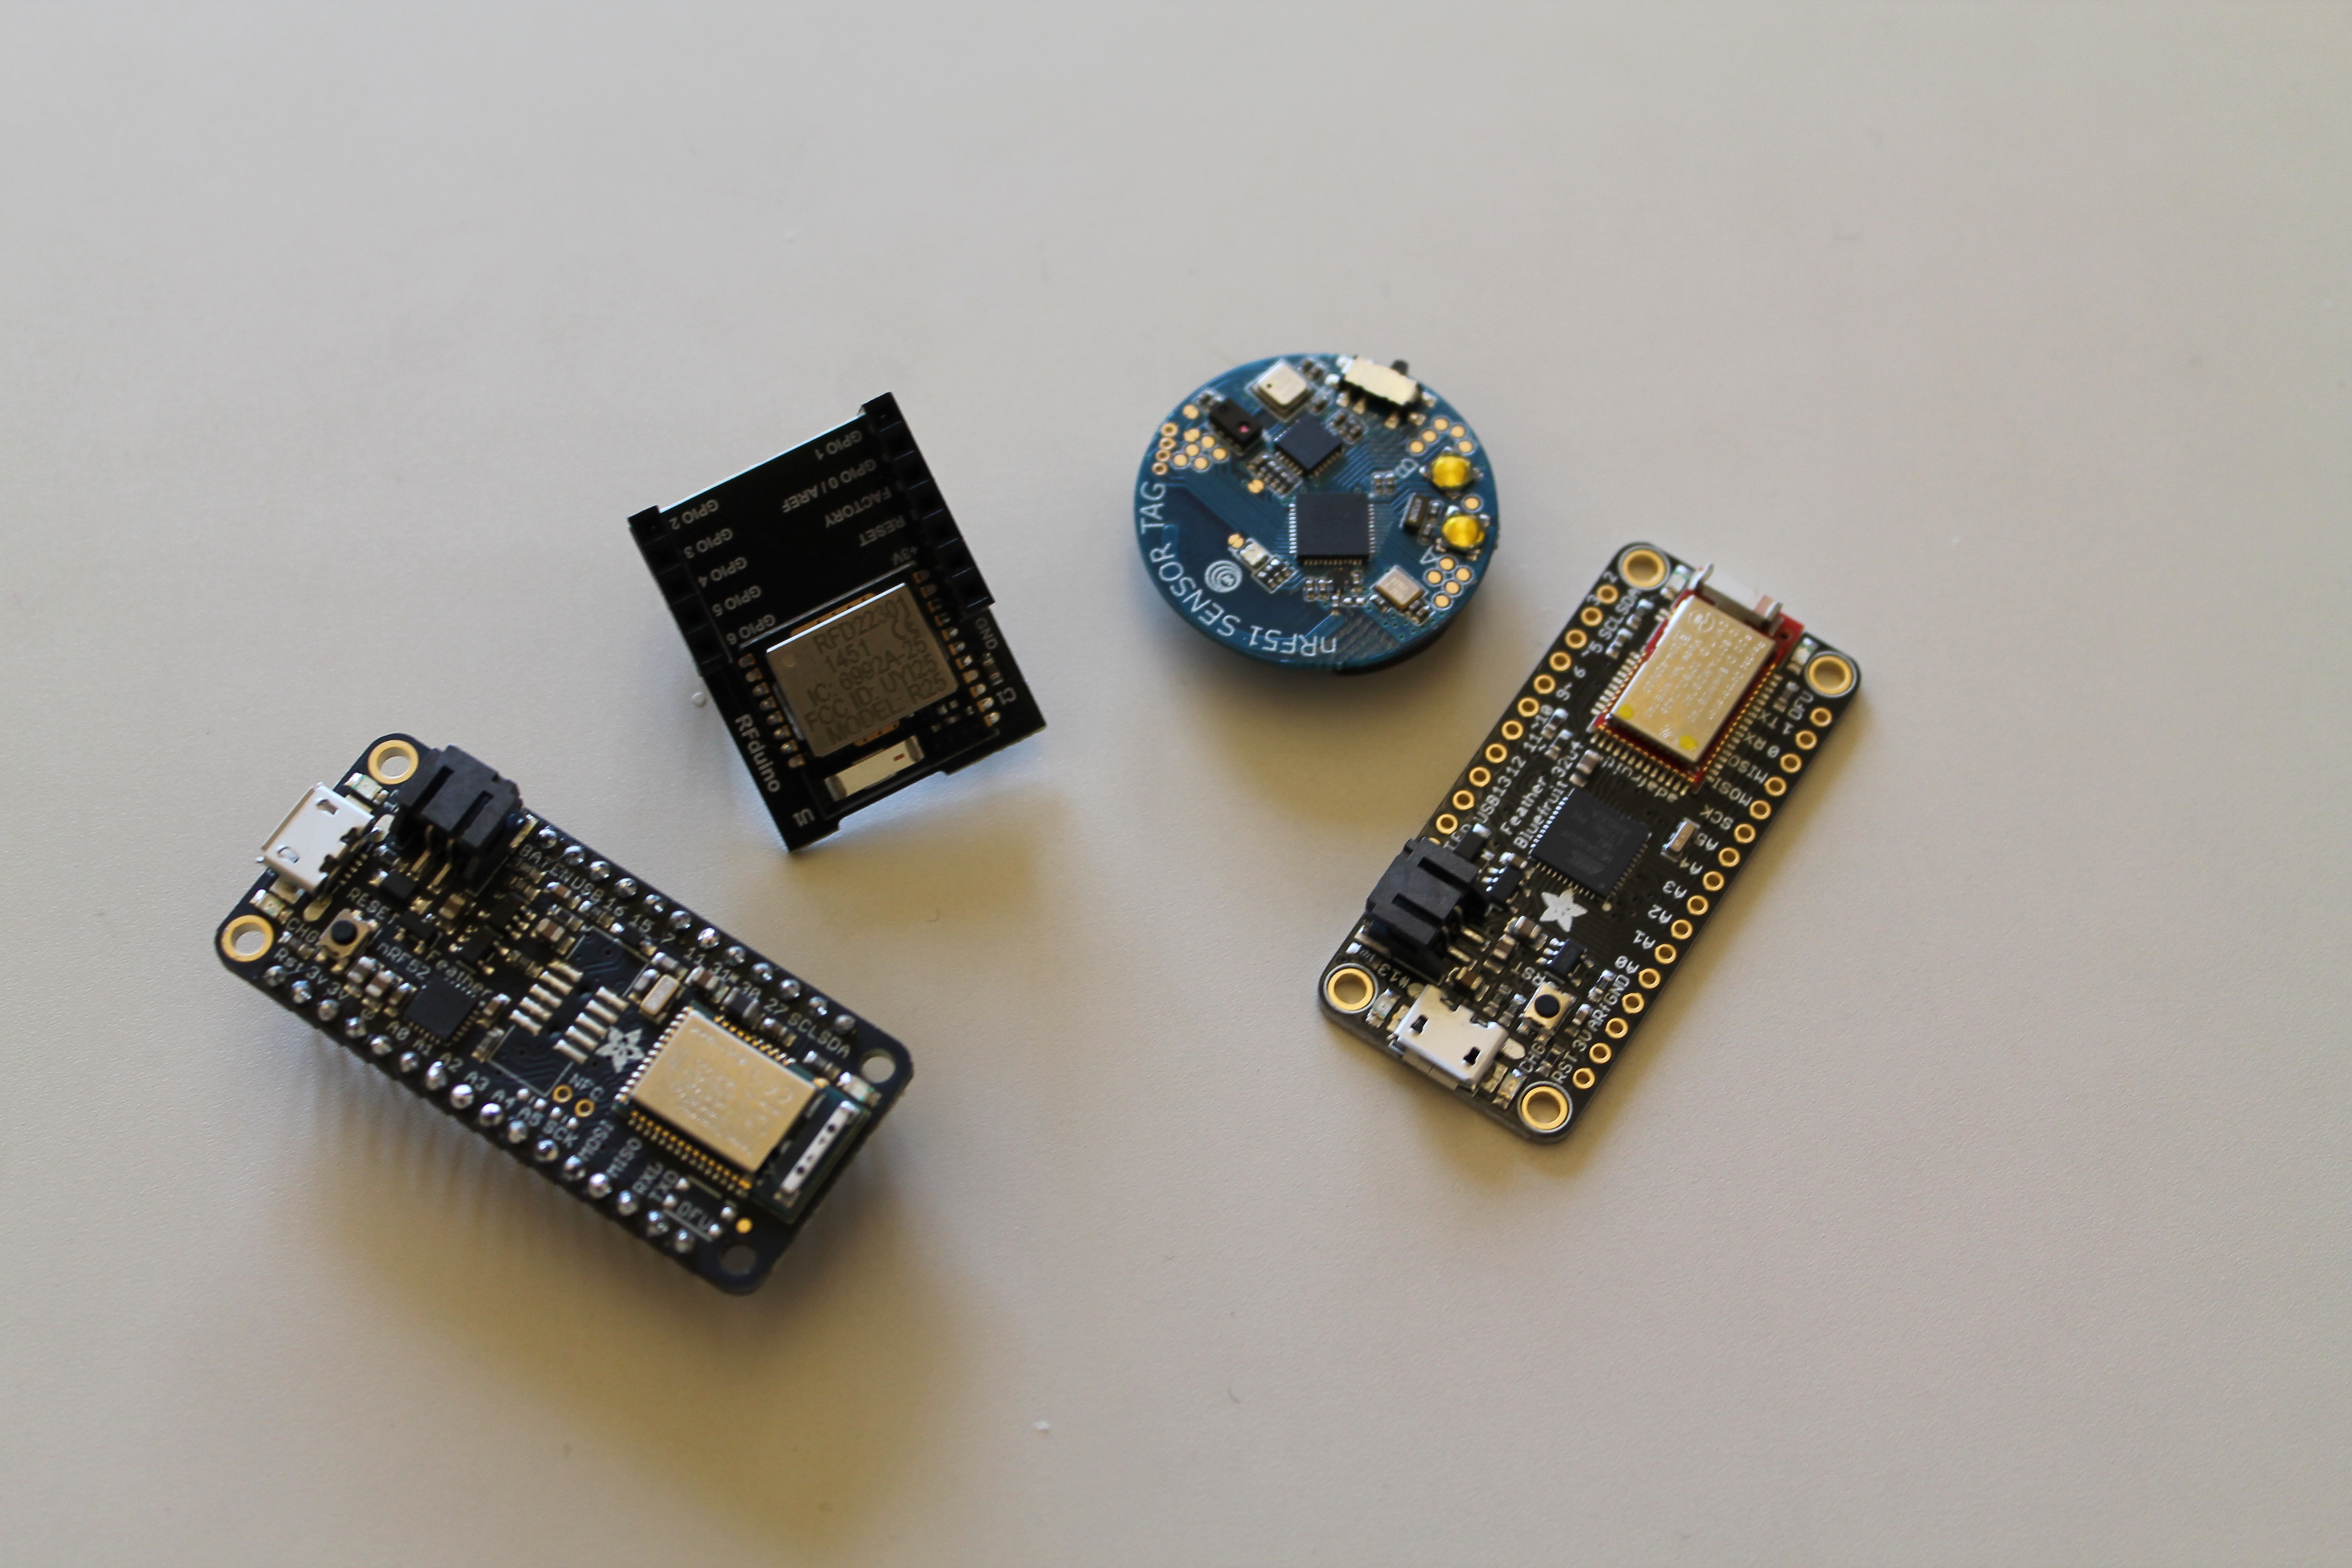
Figure 2. Sample of BLE devices assessed, including (from left to right): the Adafruit® Feather nRF52 Bluefruit, the RFduino, an NRF51 Sensor Tag, and the Adafruit® Feather 32u4 Bluefruit.
Prototype Design
The final prototype system design (Figure 3, below) consisted of a Raspberry Pi™ 3 central device, running a MySQL database and an Apache web server on the Raspbian operating system, along with a Python 3 script utilizing the pygatt library to read data from the BLE sensors at 10-minute intervals initiated by a cron job. The Raspberry Pi™ is powered by an electrical outlet and included a small touch-screen, as well as an external Wi-Fi Antenna to boost its ability to connect to the available wireless LAN from a further distance. A simple touchscreen interface, displaying the latest device readings and buttons to control the Raspberry Pi™, was created using Python’s Tkinter graphical user interface package (Figure 4, below).
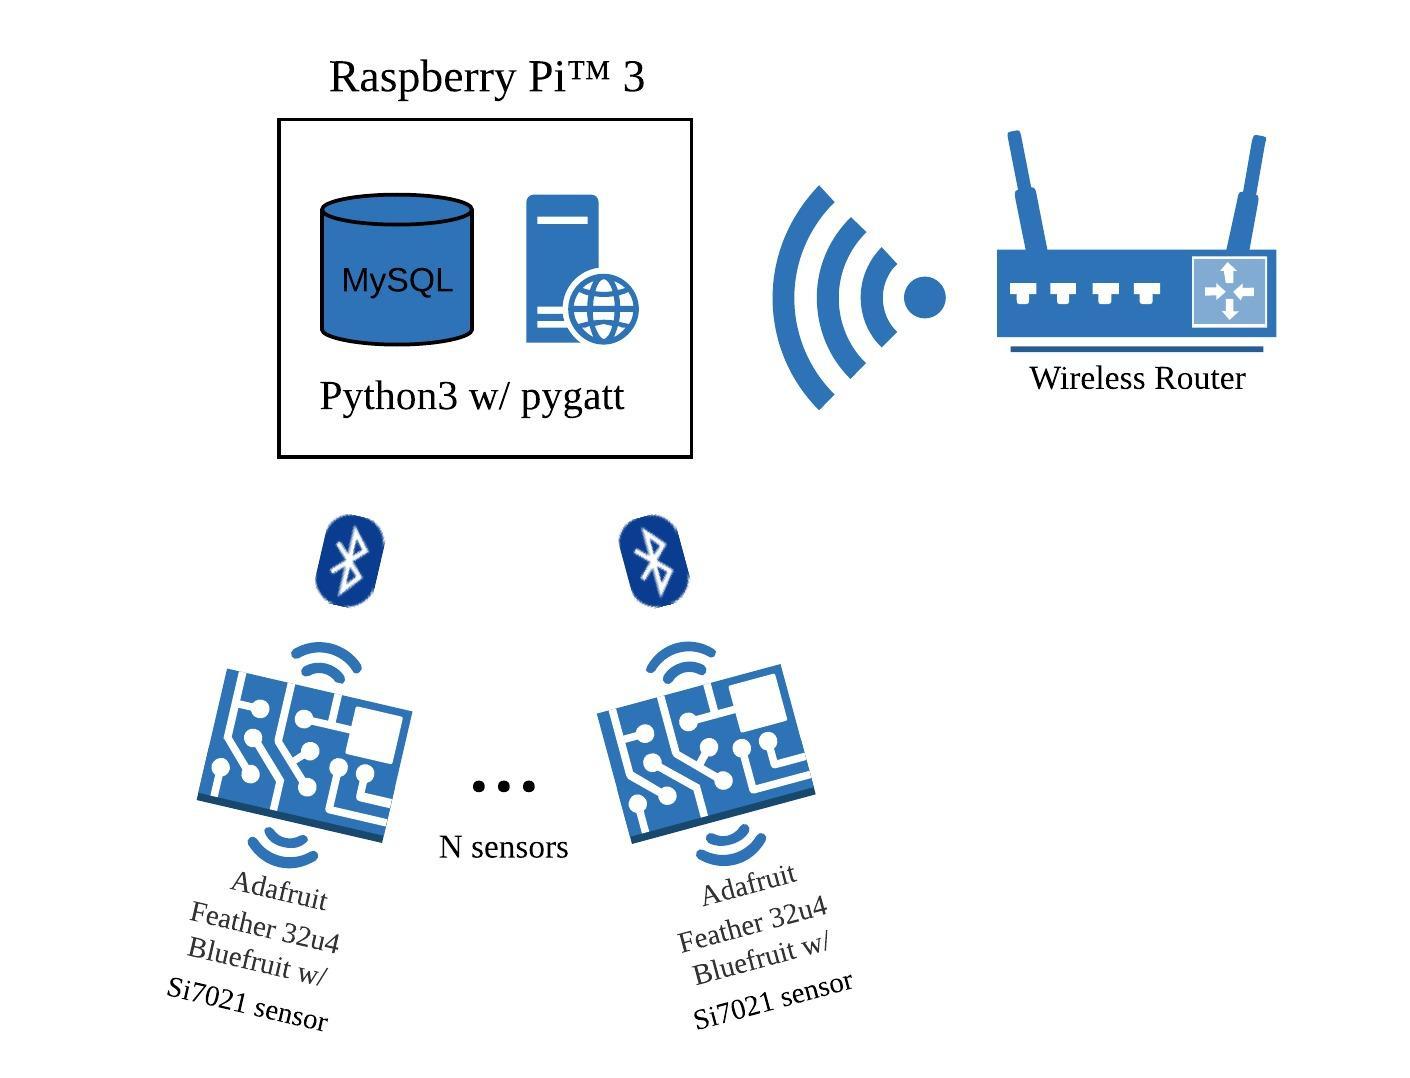
Figure 3. Prototype system design
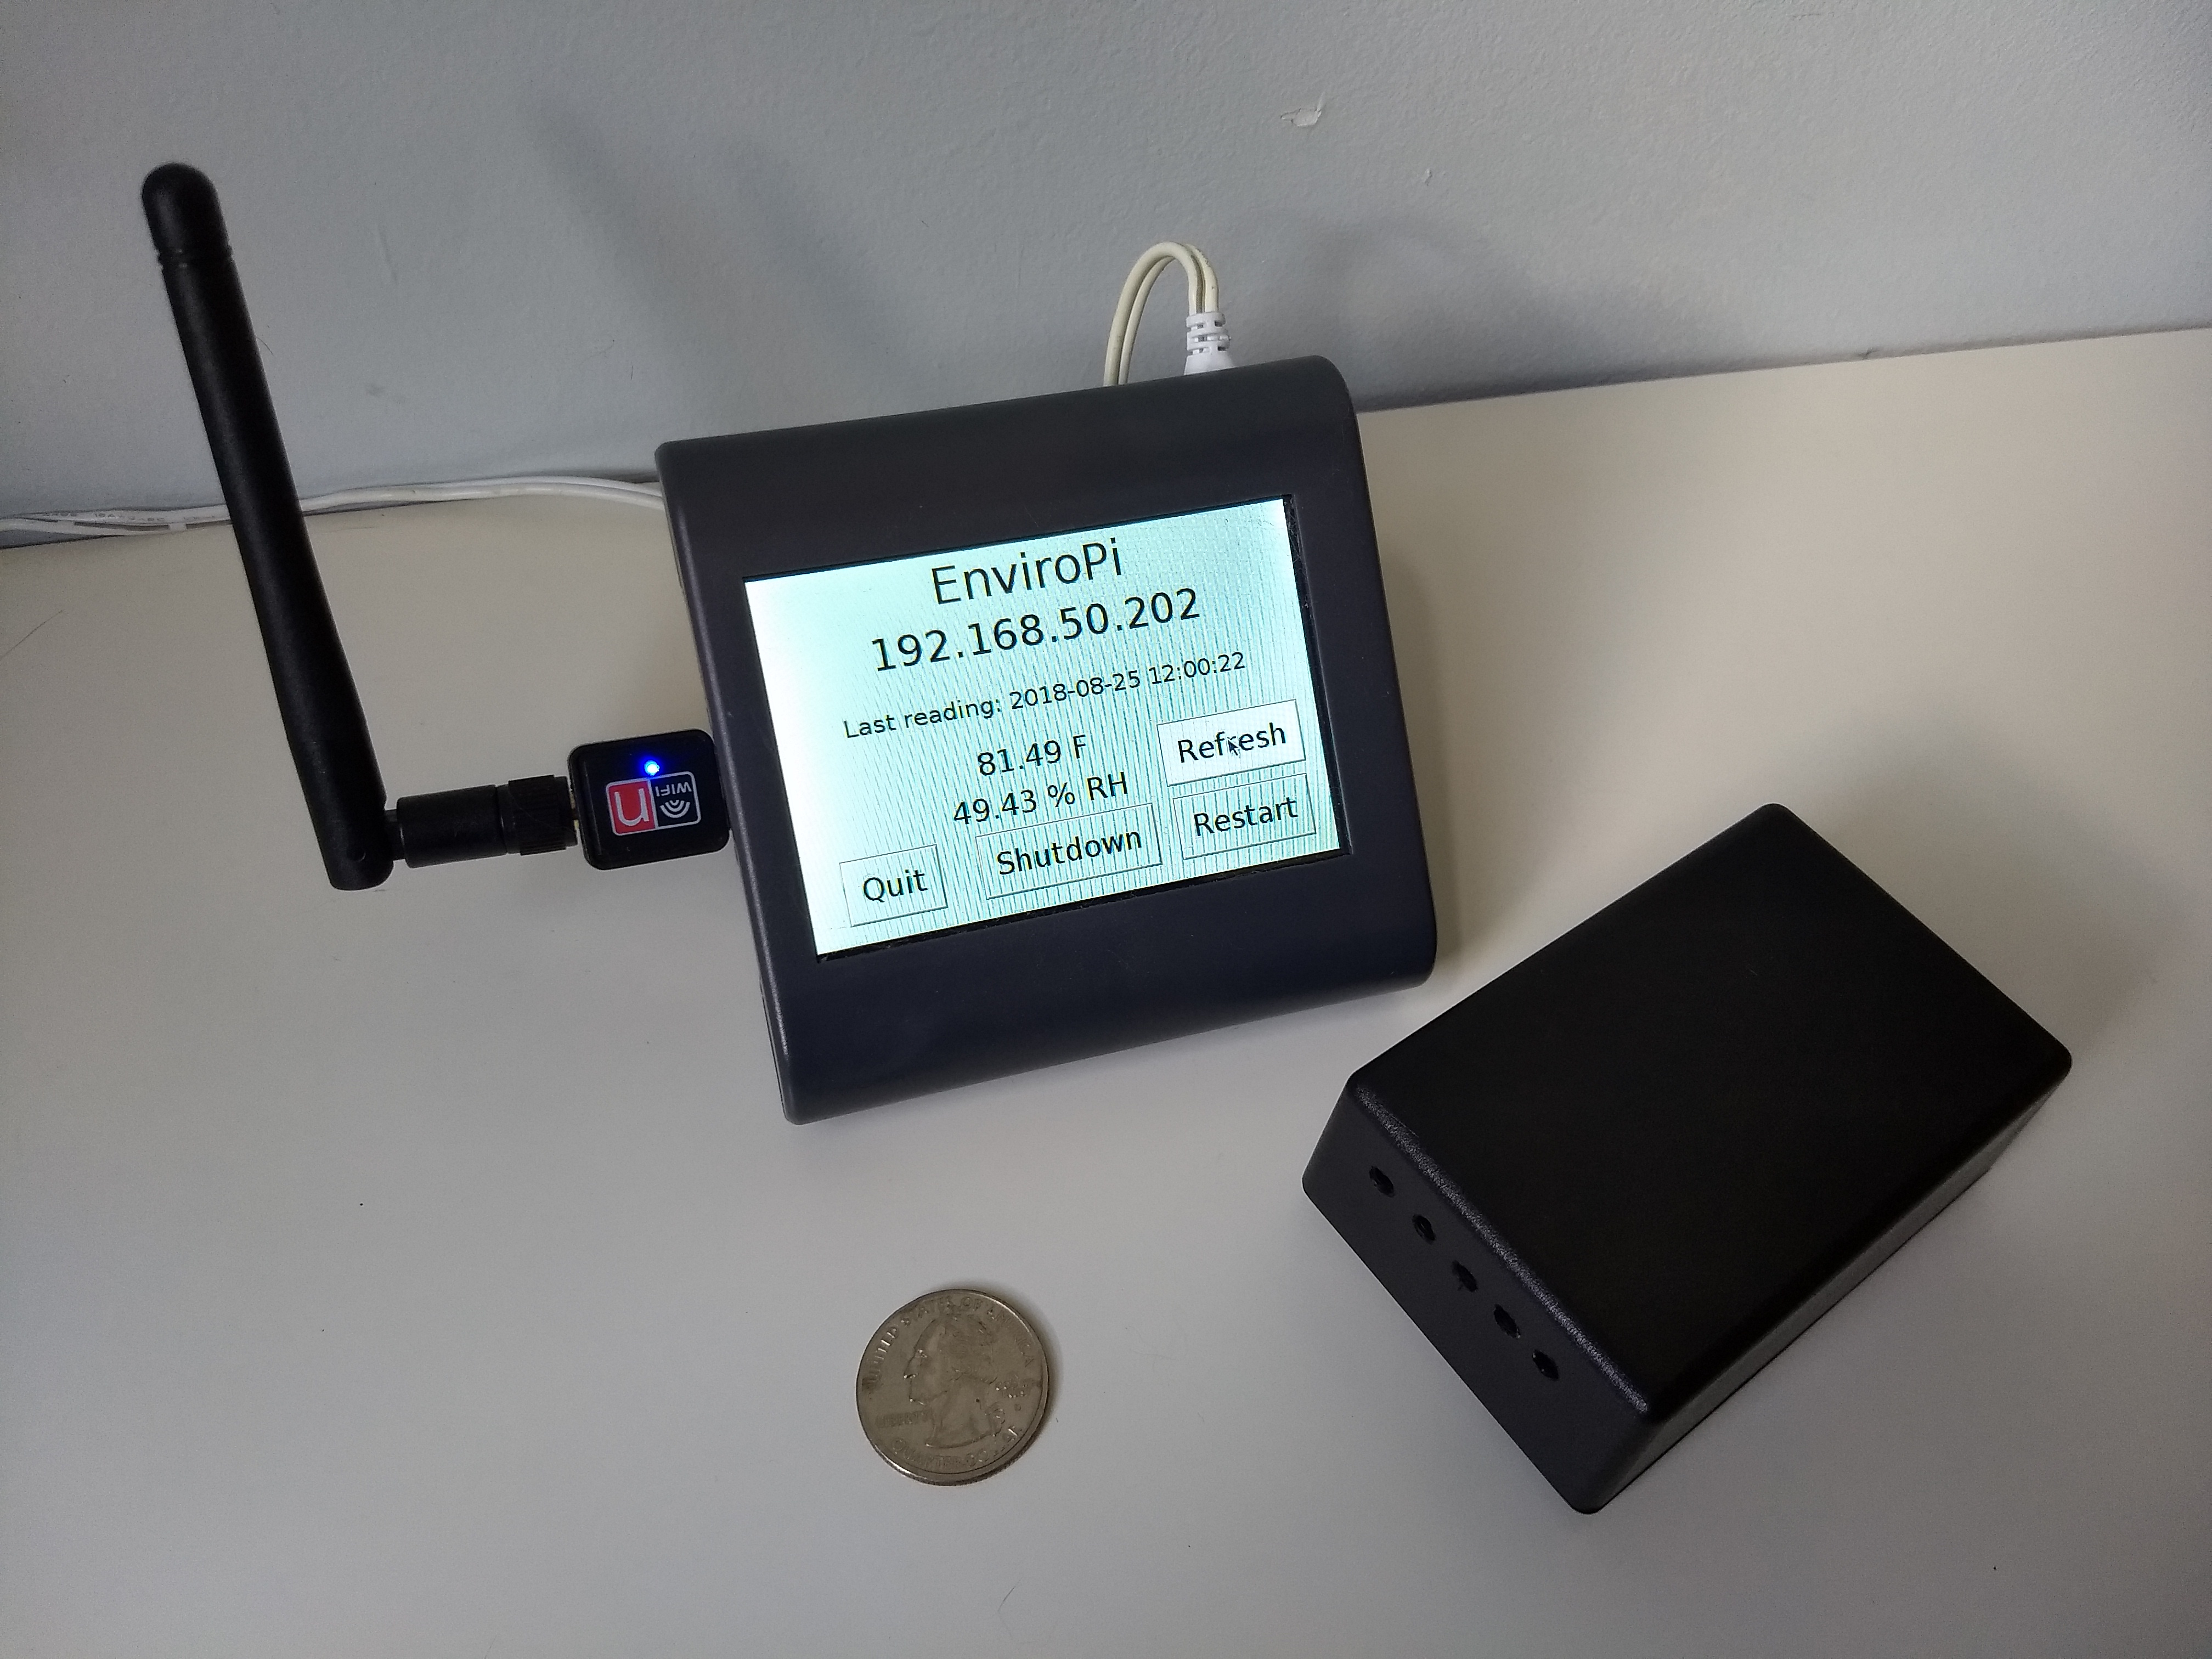
Figure 4. Raspberry Pi™ central device (left) and one Adafruit Feather 32u4 Bluefruit-based sensor device (right) concealed in a project box enclosure
An automated install script provides for initial setup of a customizable number of BLE device addresses, corresponding to the sensor in use. Each remote sensor is housed in a plastic project box enclosure and includes an Adafruit® Si7021 temperature sensor attached to an Adafruit Feather 32u4 Bluefruit board and a Lithium Polymer (LiPo) battery (Figure 5, below). At 10-minute intervals, the Python script reads from each configured and available BLE device and writes the data to the MySQL database. PHP and Chart.js were used to create a simple web-based chart interface (Figure 6, below) and JSON endpoints, though any combination of web technologies capable of connecting to a relational database or reading JSON data could be used in the future.
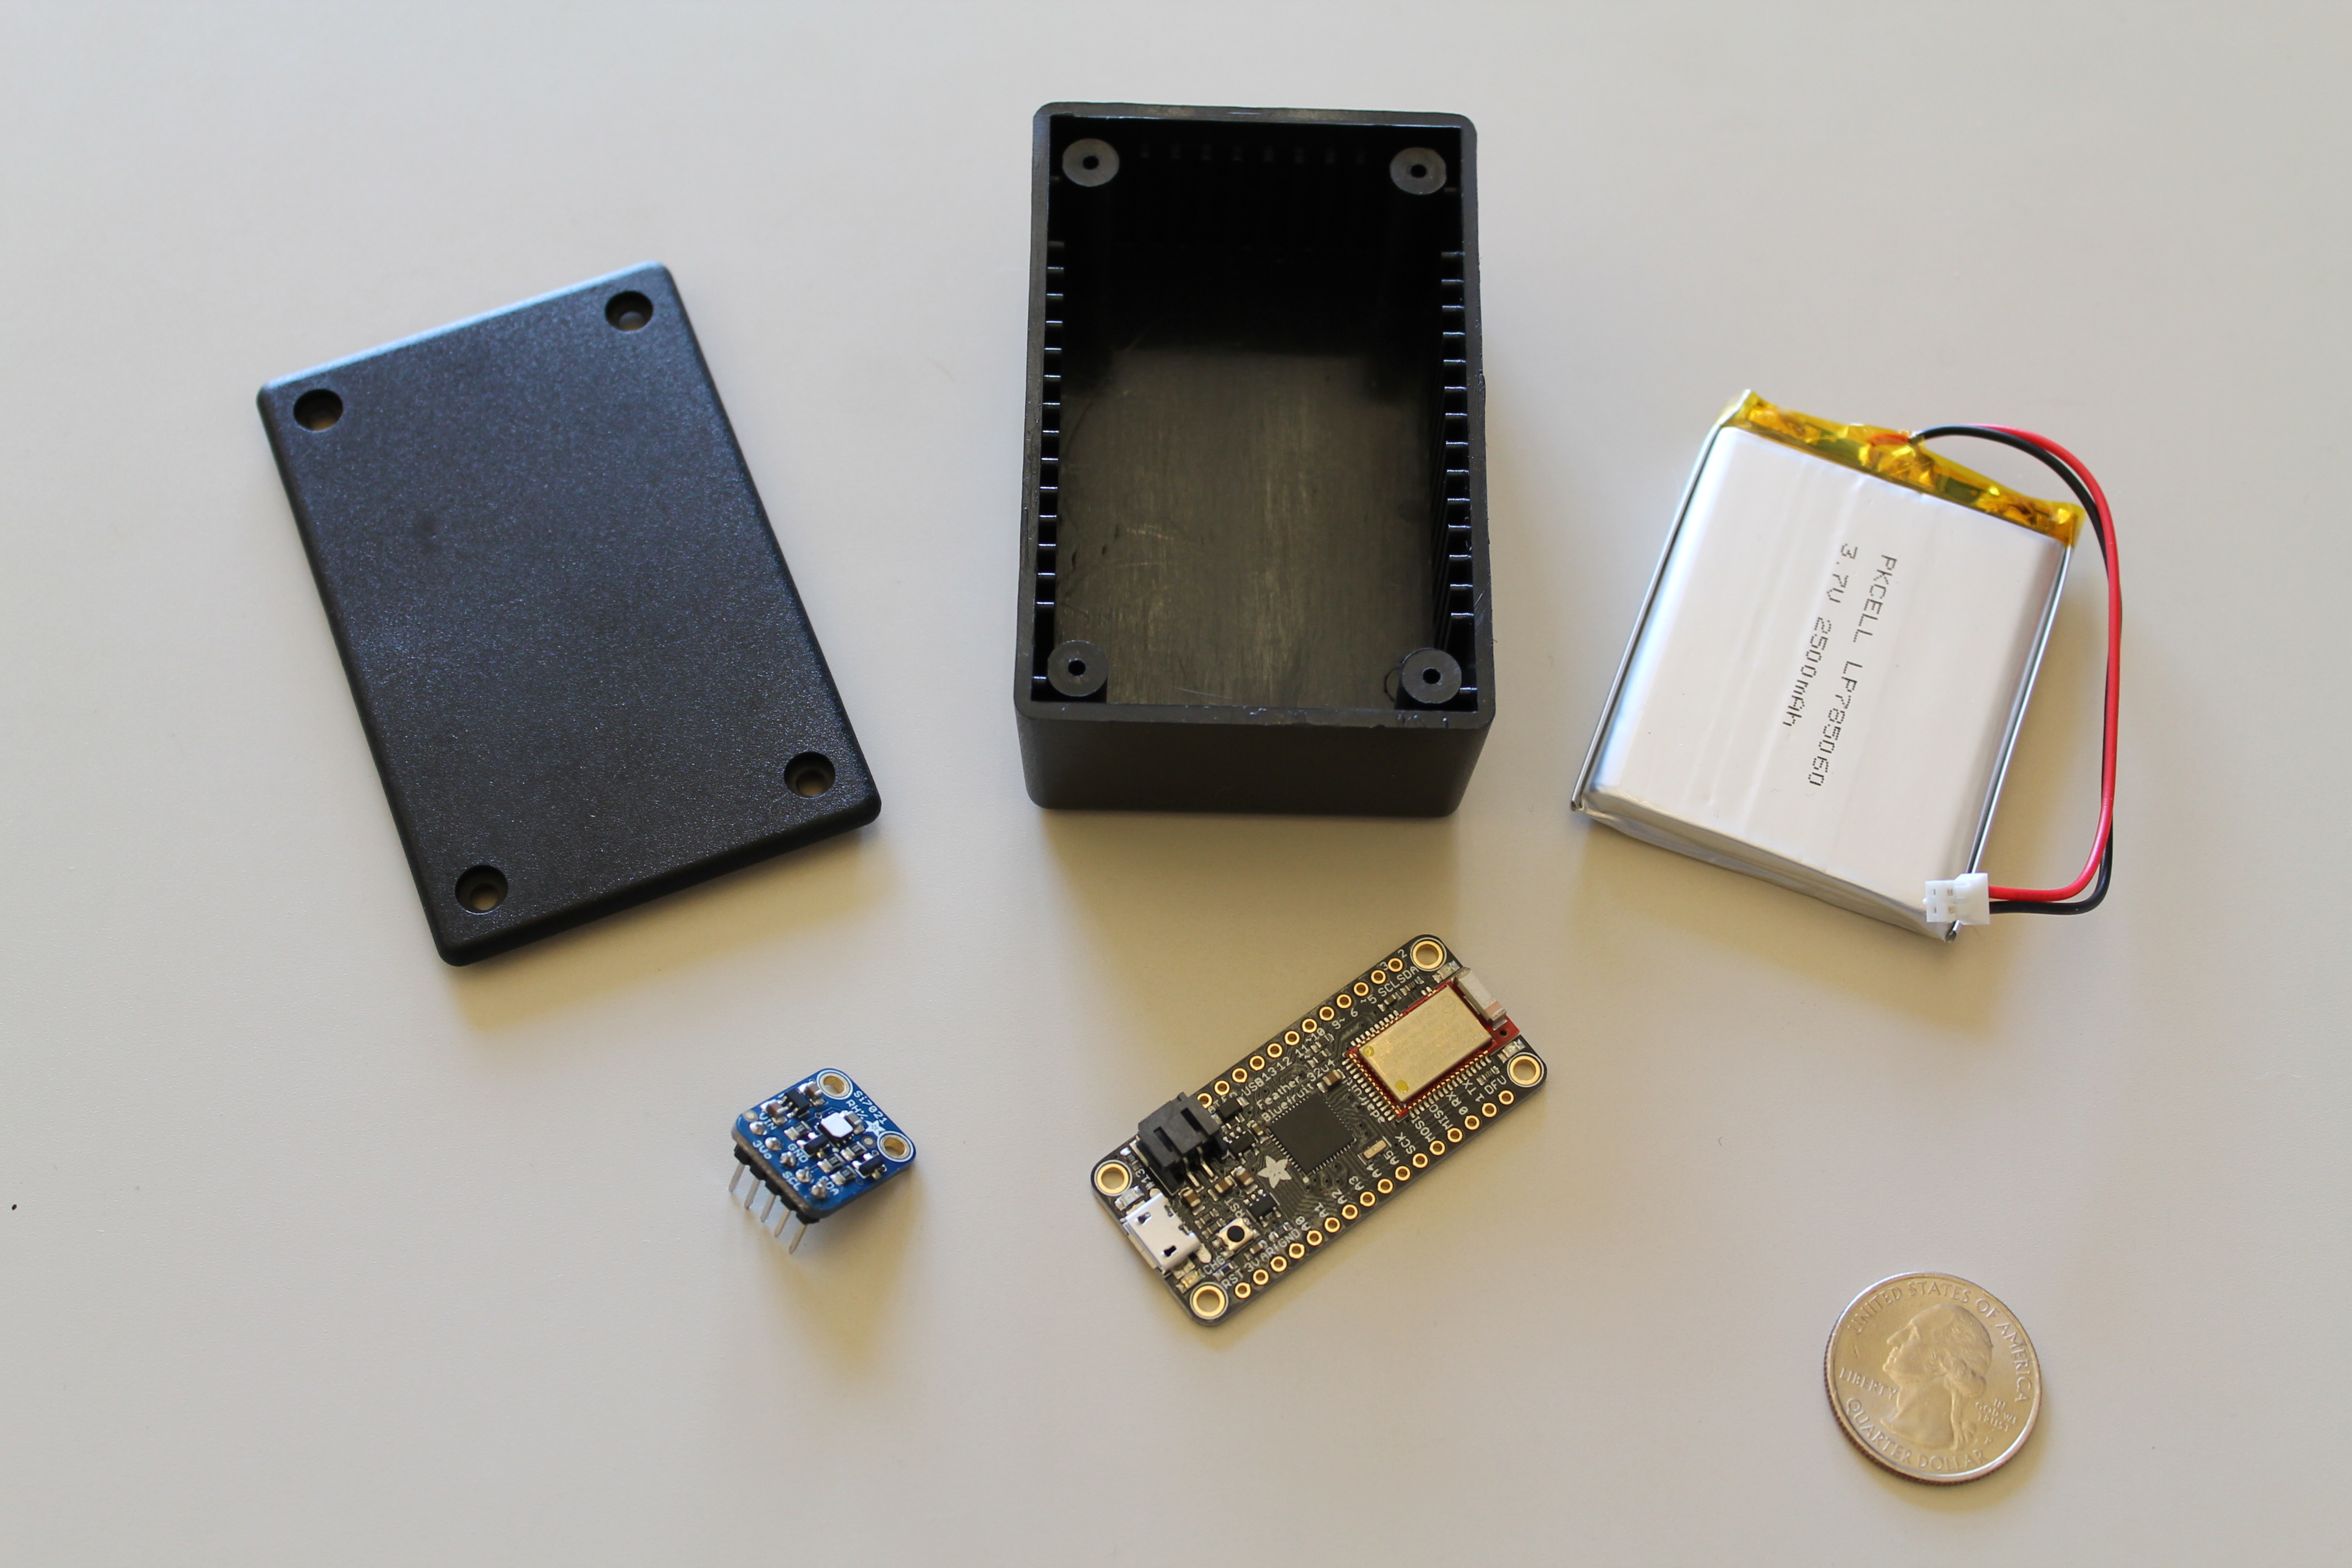
Figure 5. Components of each sensor, including (from left to right): the Adafruit® Si7021 Temperature & Humidity Sensor Breakout Board, the Adafruit® Feather 32u4 Bluefruit, and a Lithium Polymer (LiPo) battery.
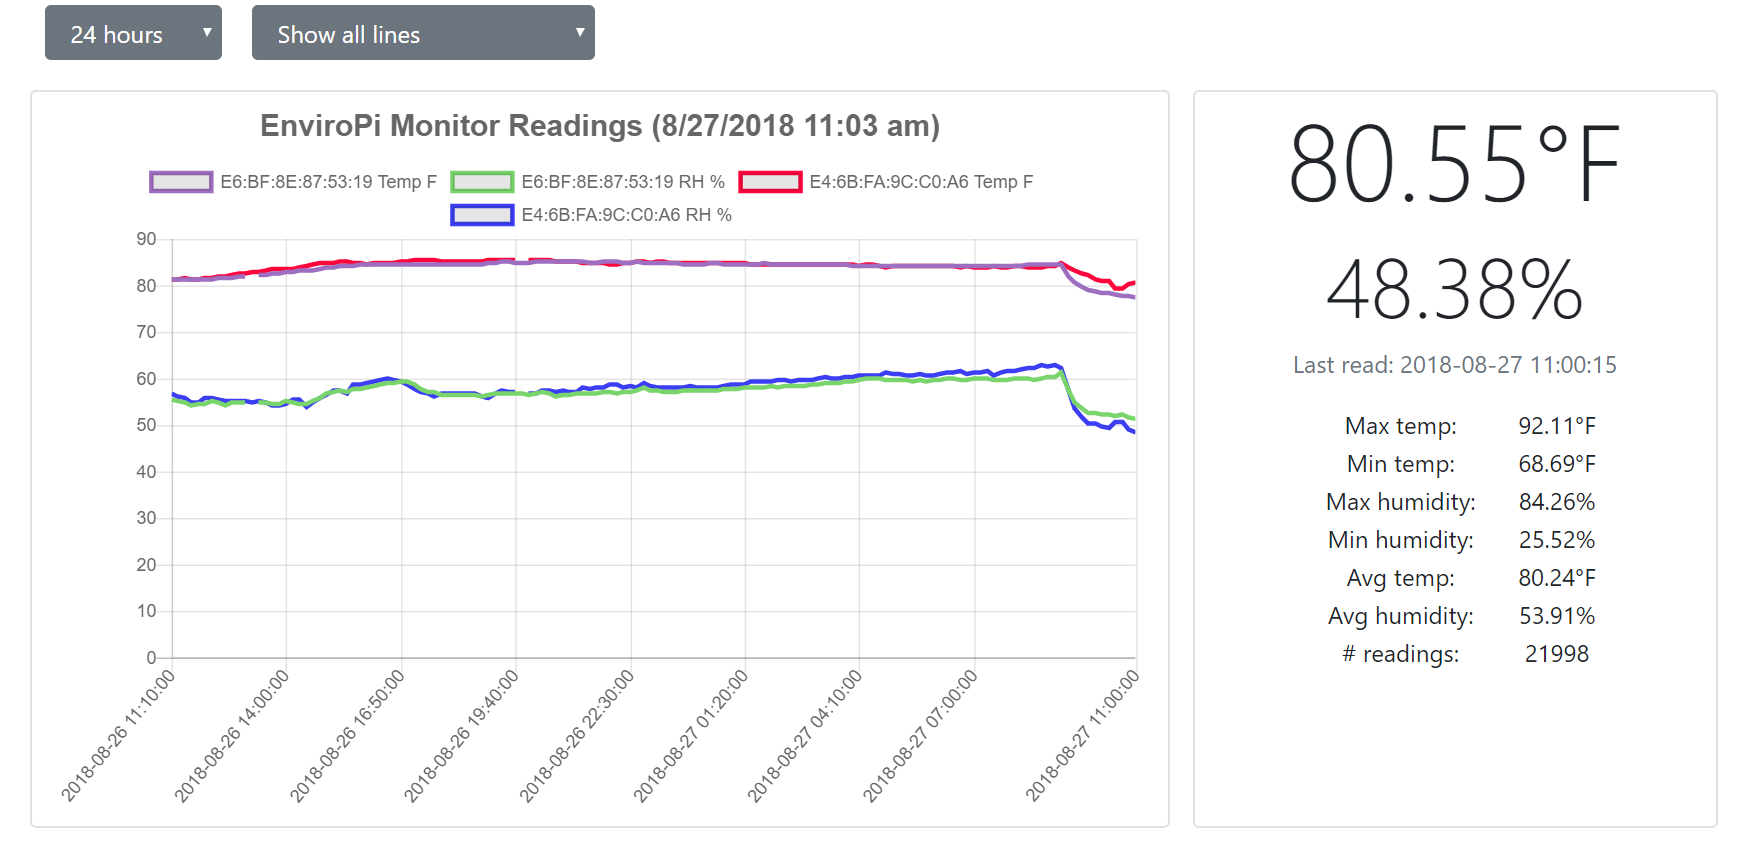
Figure 6. Web interface hosted on Raspberry Pi, with two sensors reporting data
On the battery-powered remote sensor devices, Adafruit and SparkFun software libraries for working with the Feather 32u4 and the Si7021, respectively, were incorporated into the Arduino sketch. The BLE specifications were used as a reference when creating the environmental services and characteristics (e.g., for the temperature characteristic), then the code was written and uploaded to the devices using the Arduino IDE. A snippet of the Arduino code to create the ESS service and temperature is included below, with the full sketch file available on GitHub:
/* Add the Environmental Monitor service */
// Environmental Sensing org.bluetooth.service.environmental_sensing 0x181A  GSS
Serial.println(F("Adding the Environmental Sensing Service definition (UUID = 0x181A): "));
success = ble.sendCommandWithIntReply( F("AT+GATTADDSERVICE=UUID=0x181A"), &esServiceId);
if (! success) {
    error(F("Could not add ES service"));
}

// Temperature ESS Characteristic
Serial.println(F("Adding the Temperature Measurement characteristic (UUID = 0x2A6E): "));
success = ble.sendCommandWithIntReply( F("AT+GATTADDCHAR=UUID=0x2A6E, PROPERTIES=0x10, MIN_LEN=1, MAX_LEN=5"), &tempMeasureCharId);
if (! success) {
    error(F("Could not add temperature characteristic"));
}
As mentioned earlier, using the BLE standardized identifiers for environmental services and characteristics, e.g. temperature characteristic identified as “0x2A6E”, allows the data advertised by the device to be recognized as such by any BLE-enabled device, such as a mobile phone BLE scanner app. Each sensor runs the same code but may be distinguished by its unique Bluetooth hardware address, for scanning and data storage purposes.
In the current prototype, the Raspberry Pi™ connects to an existing LAN via Wi-Fi or Ethernet. If no LAN connection is available, say in remote storage locations, there is also potential to add a cellular shield for cell phone network access to the Raspberry Pi™ central hub. The sensing devices may connect to any central BLE device in range, such as one’s smartphone, to obtain sensor readings directly off the device. As discussed later in the future work section, new tools exist for rapid mobile app development, giving the option of creating and deploying one’s own simple mobile app for reading data directly from sensor devices.
The unobtrusive case and a touchscreen for the Raspberry Pi™ could be considered optional add-on features, as the device’s data is web accessible. However, practitioners’ feedback in the focus group emphasized the need to walk around the building space and easily view environmental condition data directly on the device. Also, the need for an aesthetically pleasing, or at least unnoticeable, device enclosure was stressed as well, so these features were required.
Testing the Prototype
Though the devices performed reliably over a test period of several months within the expected accuracy parameters (gathering tens of thousands of readings), two main challenges during operation emerged: 1) managing battery life versus range, and 2) the relative flakiness of the BLE connections. Minimizing power usage is a key concern in IoT devices generally, many of which are expected to run without user intervention for months or years at a time. Though wireless protocols designed for use with IoT devices are relatively low power, there is a tradeoff between wireless range and battery usage. The Arduino code written employed several power-saving measures, such as turning off LEDs and using a low power library to sleep the device between reads.
Additionally (and with a more significant impact on battery usage), the transmitting radio power of the BLE device can be lowered by configuring the Arduino’s code to preserve battery usage, but this, in turn, reduces the signal range. This can lead to inconsistencies in battery life and sensor reading reliability depending on the physical layout of the space in which they are deployed. However, the Adafruit devices chosen may also be powered from a computer’s USB port, which provides a means of avoiding battery constraints entirely if archival storage locations are co-located with computer workstations.
Several types of batteries and connectable battery packs were tested, including LiPo, alkaline, and rechargeable batteries. Though all types could be suitably connected to and run the Feather device (anywhere from one week to several months depending on battery type and capacity), the LiPo battery proved to supply the longest-lasting power in the smallest form factor with the added benefit of being able to be recharged from the USB cable. However, LiPo batteries require special care in charging and storage, to reduce fire risk, which may be unacceptable to an organization with valuable collections.
Though development is quick and easy with prototyping boards, such as those from Adafruit, the downside is that such devices often include extra features that consume power but may not be needed for the final project. Designing and manufacturing a custom board with the bare minimum features needed would allow for reducing the power needs more drastically, as is seen in commercial products. For the more robust central device, the Raspberry Pi™ running the web server and database, battery power is not a viable option, unless the device is to be run for short periods. Even the smaller and less power-hungry Raspberry Pi™ Zero W has relatively high-power needs compared to the Arduino. Hopefully, it is reasonable to assume that the one central device would be able to have access to a power outlet and thus avoid the need for battery power.
Another issue observed was the tendency of the Bluetooth connection to drop mid-stream or fail to be made when attempting to read data from the sensors. To combat this, the final Python script to read data allowed for several tries to be made during each read and included error handling for the various exceptions that may be commonly raised. Despite some intermittent failures in reading the data at each interval, given a few tries the data was always able to be successfully read eventually, so no data points were ultimately missing.
More generally, due to the various constraints and tradeoffs around using battery-power and achieving the needed functionality, the project necessarily employed several different technologies and skillsets, from designing a (simple) relational database to writing and modifying code in multiple languages. With the installation script, a Raspberry Pi™ device and its sensors could be set up and operational in a few hours, but only if the creator was familiar with the techniques and tools used (for example – imaging an SD card for Raspbian, light through-hole soldering, etc.)
Conclusions and Future Work
In the world of manufacturing, supply chain solutions, and elsewhere, IoT sensor networks for environmental monitoring have become commonplace. However, these don’t necessarily fit the needs of cultural heritage organizations, which are often limited by budget and tend to develop their environmental monitoring solution in a piecemeal fashion over time. Additionally, preservation metrics that assist archivists in identifying problematic environmental conditions for artifacts of various materials are specific to the cultural heritage realm. Of the devices and systems that are oriented towards the monitoring work of cultural heritage organizations, the practitioner focus group detailed many desired improvements that are either currently unavailable or unaffordable to them. As a result, many are turning to cheap generic consumer devices or ones designed for other domains, such as weather-monitoring.
The focus group also detailed novel features that would expand the scope of the project immensely. Many practitioners reported checking in on environmental conditions from home or on weekends and advocated for a remotely-accessible mobile app and responsive web interface to make this work more efficient. Though most reported that one staff member took the lead in monitoring activities, they also expressed a desire for the ability to allow other users access to the data, with the available features restricted to different user roles, such as themselves as an administrator or a board member as a viewer.
The cultural heritage field, more generally, supports many popular and active open source software projects. A goal of this project was also to employ open source hardware, which opens future possibilities for modification and customization. The full set of requirements generated by the practitioner focus group is ambitious, in suggesting the development of a mobile app and web interface, as well as multiple IoT devices that must run without user intervention for significant time periods. These are ongoing challenges in the wider realm of IoT work and, in particular, dealing with the power-related tradeoffs may be a difficult task. In the context of a small-scale open source, low-cost project, these requirements may currently be out of scope for a project without the funds and ability to design novel hardware and/or engage in significant mobile app or web development.
As mentioned earlier, though, new services and tools are emerging on a frequent basis, that begin to tackle some of the common needs of IoT projects, particularly those run by the hobbyist. On the data dashboard side, new cloud services, such as the Adafruit IO project, aim to provide “the easiest way to stream, log, and interact with your [IoT] data.” These may provide the means to avoid reinventing the wheel in developing a novel mobile app or responsive web interface. Moreover, tools such as Adafruit IO also offer appealing data ownership and retention policies.
An experimental dashboard was created using this service, by adding an Adafruit-created Python library to the Raspberry Pi™’s code, such that it would take the additional step of pushing data to the cloud service each time it was read. An Adafruit.io user account was created, then several feeds were configured for temperature and humidity data collection. This feed data was then visualized through a widget-based dashboard interface. Though the features of the Adafruit.io service are still in development, a simple “live” data dashboard was created with relative ease (Figure 7, below). This would remove the need for a web server and custom web interface hosted on the central hub device computer.
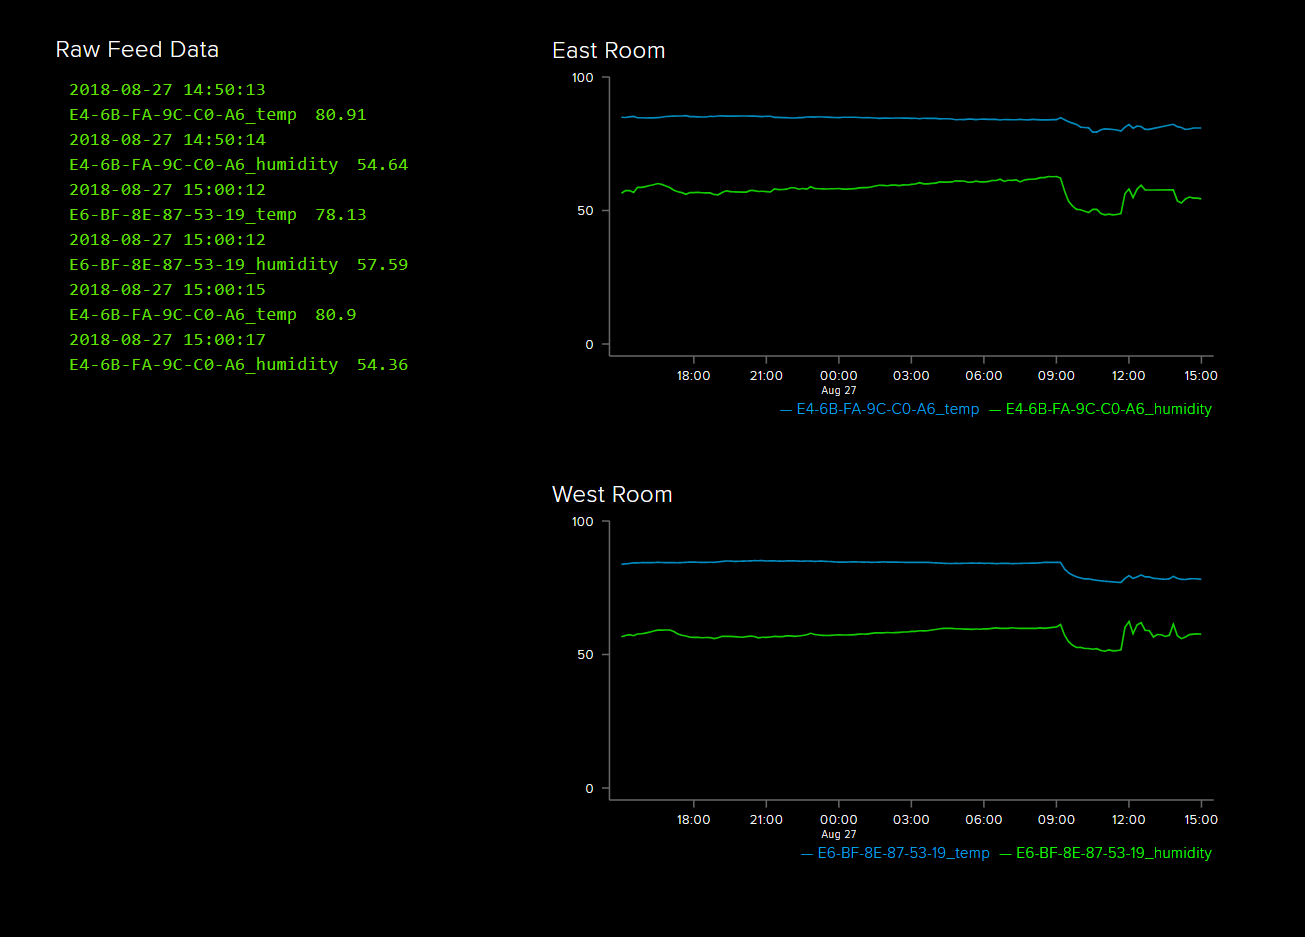
Figure 7. Example experimental data dashboard created through Adafruit.io with live EnviroPi data
Another promising tool is the Blynk platform which allows for quick IoT mobile app prototyping and deployment. The platform facilitates easy creation of mobile apps that directly connect to BLE devices or control devices remotely via Wi-Fi (if the device is Wi-Fi-capable). Utilizing Arduino devices with Wi-Fi capabilities (though these tend to require more power) would allow easy integration with such services. Apps could also be used to read data directly off devices when traversing the physical space.
A simple example (Figure 8, below), created in under an hour using the Blynk Arduino library, is able to automatically connect to the device over BLE, when in range, and read from the sensors at the desired time periods. Another option is running one’s own Blynk server, which can be installed on the Raspberry Pi™, removing the need for a cloud host and handling all the interactions and data between the mobile app and connected sensors.
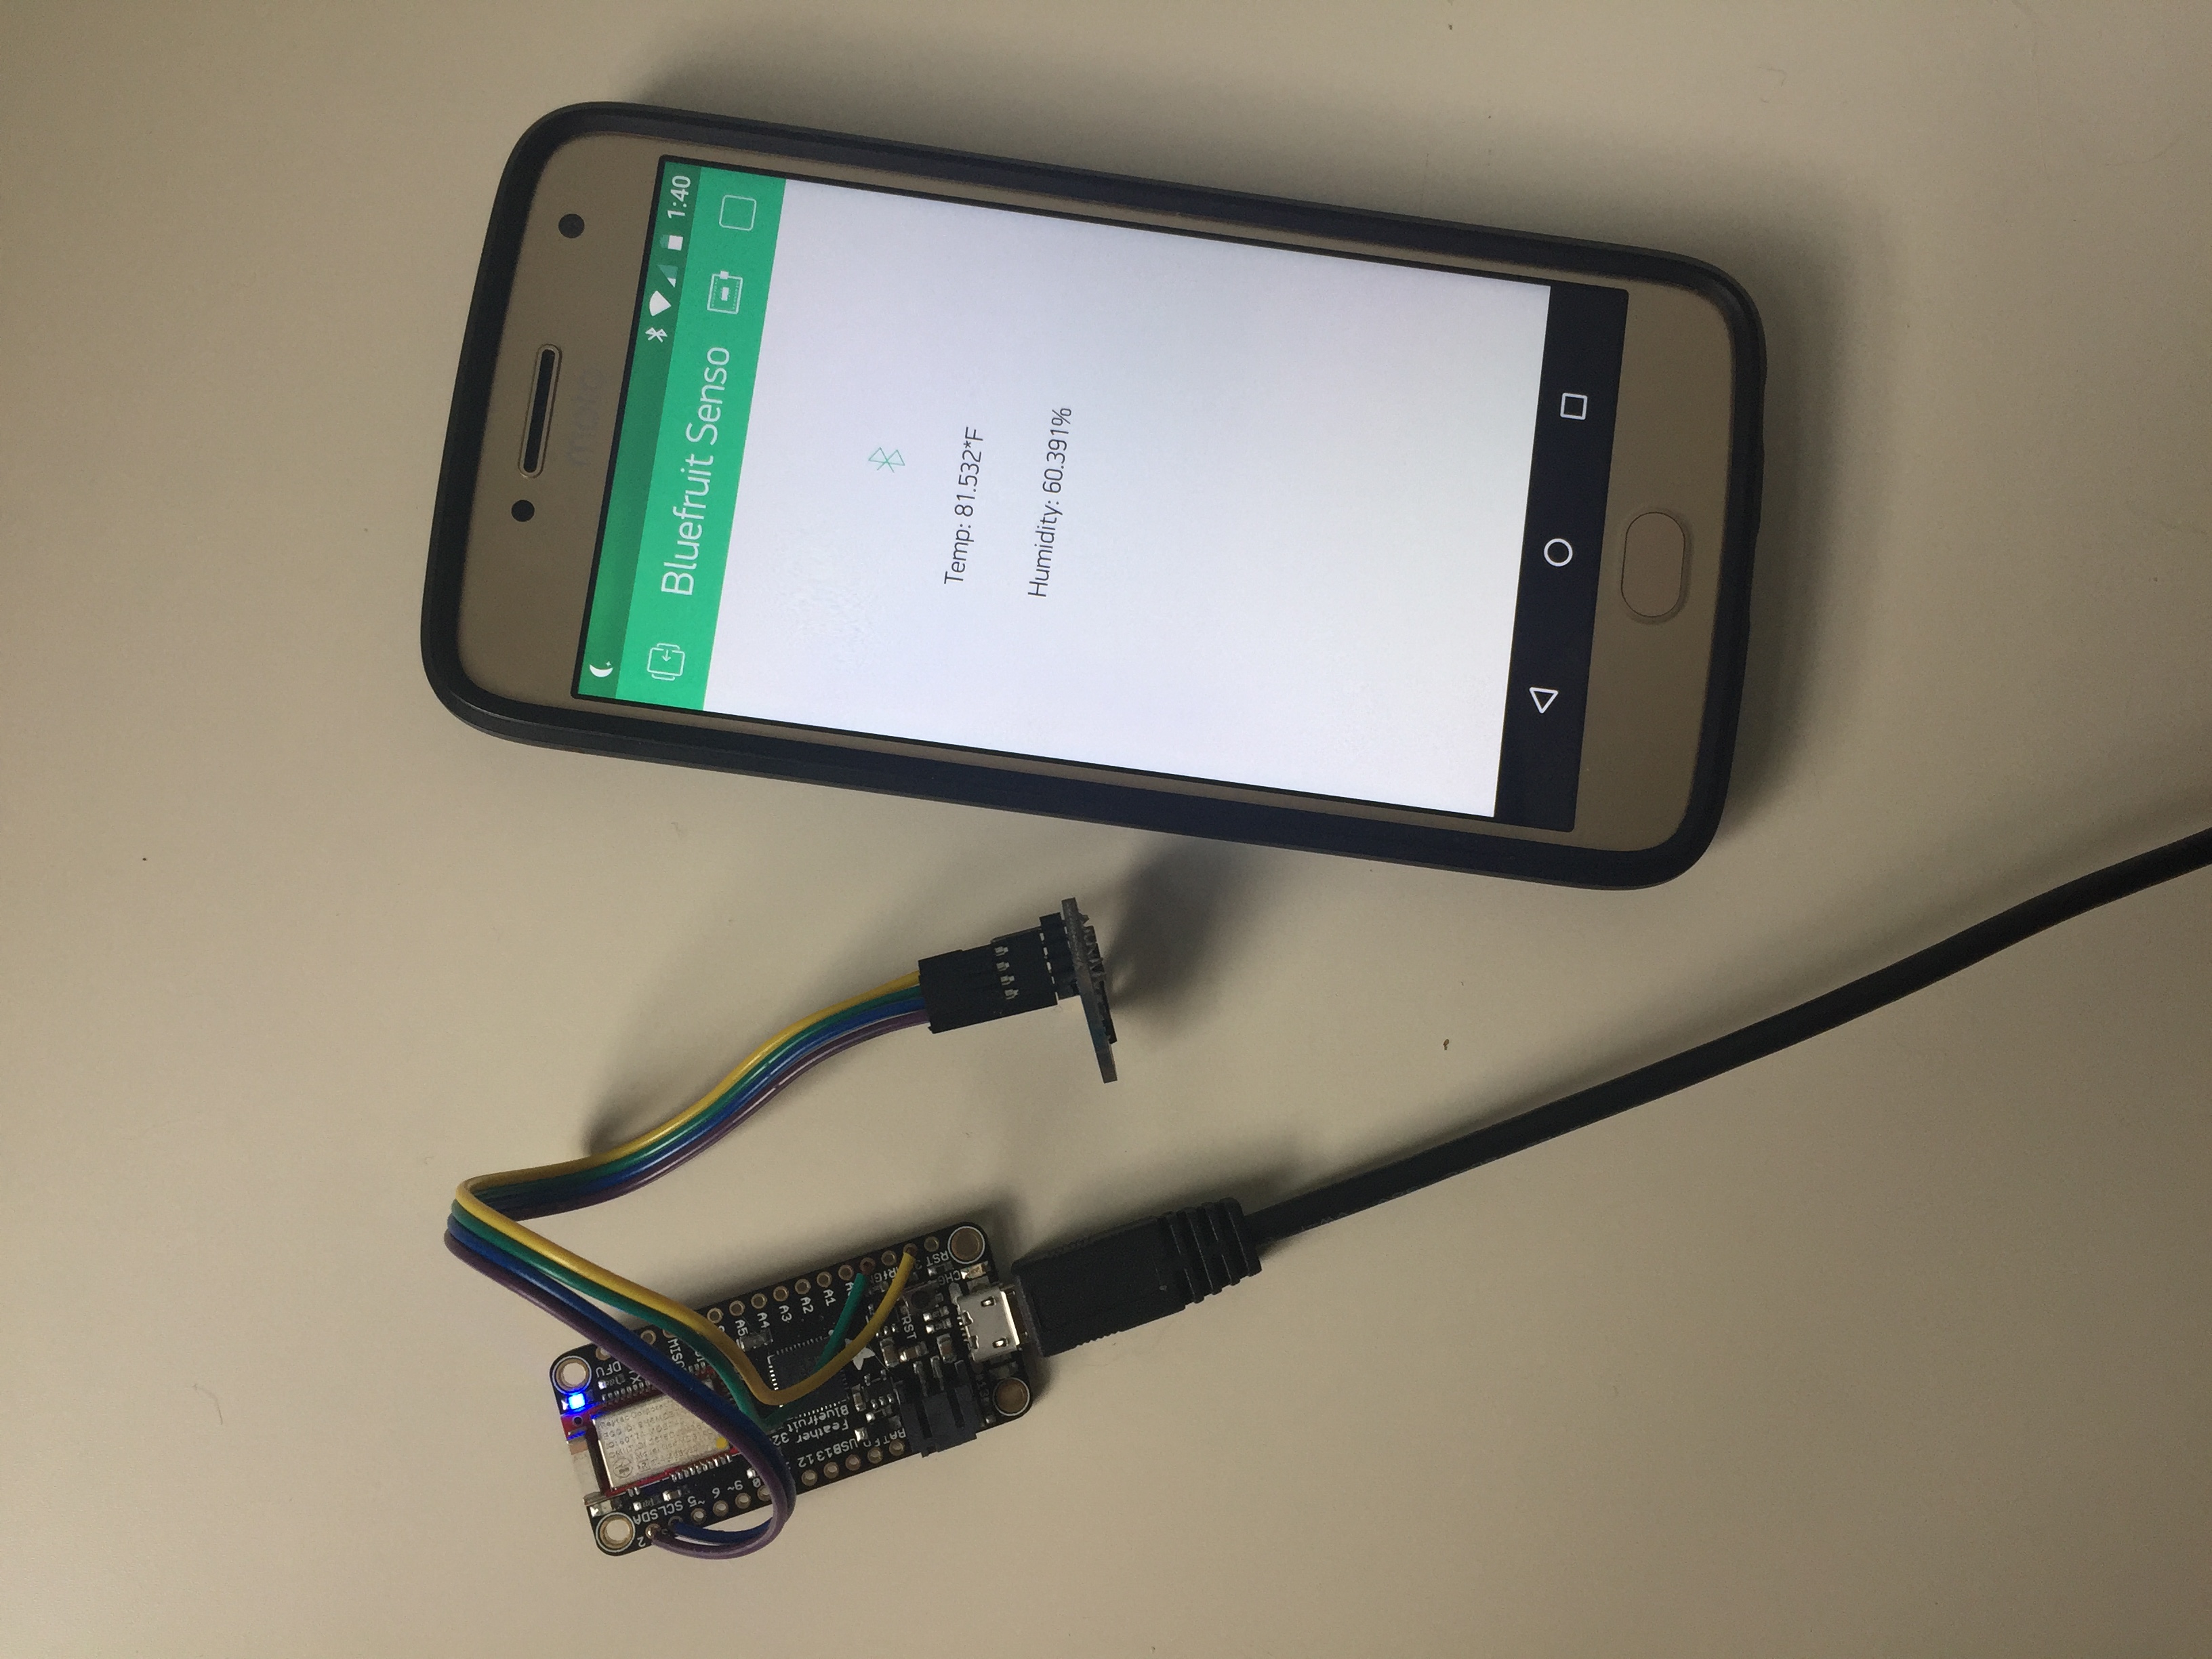
Figure 8. A minimal Android mobile app created in Blynk, connected to sensor device and displaying live readings of the temperature/humidity sensor
These general-purpose IoT services, and a growing number of other alternatives, offer many novel possibilities in integrating with the variety of tasks involved in environmental monitoring, from data collection to analysis and sharing, while allowing for a more open community-driven codebase. In addition to services, new IoT hardware devices for wireless and mesh networks offer many future possibilities, such as the Particle mesh microcontrollers. The author’s research work in this area will be continuing, and additional ideas, comments, or contributors are very welcome.
Endnotes
[1] See http://www.onsetcomp.com/ and https://www.imagepermanenceinstitute.org/ for examples.
[2] Maceli, M. (2018). [Environmental monitoring focus group]. Unpublished raw data.
Bibliography
Klein, L.J., Bermudez, S.A., Schrott, A.G., Tsukada, M., Dionisi-Vici, P., Kargere, L., Marianno, F., Hamann, H.F., Lopez, V. & Leona, M. (2017). Wireless Sensor Platform for Cultural Heritage Monitoring and Modeling System. Sensors, 17(9), 1-21.
Londero, P., Fairbanks-Harris, T., & Whitmore, P. M. (2016). An Open-Source, Internet-of-Things Approach for Remote Sensing in Museums. Journal of The American Institute for Conservation, 55(3), 166-175.
Maceli, M. & Cocciolo, A. (2017). Monitoring Environmental Conditions with Low-Cost Single Board Computers. Preservation, Digital Technology & Culture, 46(4), pp. 124-131.
About the Author
Monica Maceli is Assistant Professor at Pratt Institute School of Information, focusing on emerging technologies in the information and library science domain. She earned her Ph.D. and MSIS from the College of Information Science and Technology (iSchool) at Drexel University. She has an industry background in web development and user experience, having held positions in e-commerce, online learning, and academic libraries.

Subscribe to comments: For this article | For all articles
Leave a Reply