by Devin Becker, Evan Williamson, and Olivia Wikle
Context
Unsatisfied with the limited options for customizing collections hosted in their digital asset management (DAM) system, CONTENTdm, librarians at the University of Idaho developed CollectionBuilder-CONTENTdm, an open source approach that uses CONTENTdm’s API to build customized, discovery-focused web pages and visualizations on top of a collection’s metadata. Acting as skins, these overlaying web pages provide an alternative interface for users to explore collection content and context, without directly interacting with CONTENTdm’s website.[1] The digital collection websites built with this tool are generated from CSVs using a static web generator, and provide users with total access to and control over all code and data. This article briefly details the background of the “skin” approach, provides an in-depth look at the code making up the CollectionBuilder-CONTENTdm template, and lays out the workflows used at the University of Idaho to build and maintain the University of Idaho Digital Collections.
Why a Skin?
While CONTENTdm facilitates certain features that are difficult to replicate via other tools or services—namely full-text and cross-collection searching, media object storage and retrieval, and established workflows for ingesting/exporting/exposing metadata and objects—we developed skins for our collections for three main reasons:
- We don’t believe the default CONTENTdm interface is particularly user-friendly, and we don’t find the customization options effective or usable enough to accommodate the discovery-focused designs we aim for with our digital collections.
- We believe our collections (and archival collections in general) are truly ‘special’ and as such demand and reward customized treatment to relate their extraordinary nature to our users. Items in our collections are not disembodied database objects, and we want to ensure context is communicated to users.
- The SEO practices and machine-readable markup, or lack thereof, of CONTENTdm do not promote the discovery of individual collection items via external search engines.
The ‘skin’ approach allows us to utilize the search and storage features of CONTENTdm that we find difficult to reproduce, while allowing us to curate a user experience for the collection that matches the quality and interest of the content we are charged with stewarding.
Historical Development
We began using this skinned approach with our digital collections in earnest around 2012. Starting by hand-coding websites using basic design features, we quickly progressed to exporting metadata from CONTENTdm as XML and using XSLT worksheets to generate the overlaying HTML pages for each customized collection. Some of these XML/XSLT techniques were described in a 2014 Code4Lib article detailing the development of the Latah County Oral History Collection.[2] Template elements, such as headers, footers, and analytics, were added using PHP includes to simplify maintaining consistency. Links to individual items pointed to the CONTENTdm item page. This workflow was effective in many ways but required the maintenance of many different XSLT files that were then run against metadata XML files. Since each transformation had to be run individually, and the outputs had to be moved to a development server to test the code, viewing results from iterative development was slow. The system was also highly idiosyncratic, making it difficult to collaborate with other developers.
In 2015, we started to experiment with employing modern static web generators to build our collections and found that this method of development resolved the issues of version control and collaboration that hindered our XML/XSLT workflow, allowing us to consolidate our code and create collections that are at once more uniform in terms of layout and individualized in the way of content. The concepts behind our original skins were not abandoned: the visualizations, designs, and patterns of use have inspired and informed many of the components we have developed for CollectionBuilder.
We detail these components below, including brief discussions of how CollectionBuilder’s current code has been influenced by past tools and methods as our new approach has matured into a project capable of efficiently generating our new collection skins. If you’d like to fully understand how the system works, and its various requirements, please peruse the documentation available on the CollectionBuilder website.
Code
CollectionBuilder-CONTENTdm uses the static web generator Jekyll together with the templating language Liquid to build the layouts and features of the generated websites. Three main components are provided or edited by a user to build an individual digital collection website:
- a CSV file containing the collection’s metadata;
- two main configuration files (_config.yml and _data/theme.yml);
- and a series of page-specific config files (in CSV format) that determine what content appears on certain pages.
During generation, Jekyll exposes the metadata CSV from the project’s “_data” directory, making it available for use in pre-built templates throughout the project to build out visualizations. Despite much of the code being pre-built, each page can also be flexibly modified using the user-generated configuration files. This enables the tool to accommodate a wide variety of collection types and content without a user needing to edit the base code. It also allows us to develop the entirety of our digital collections site via one Git repository with a branch for each collection.
Collection as Data (and more data and more data …)
CollectionBuilder’s visualizations, features, and item pages demonstrate an expression of the “collections as data” ideal in that they are fundamentally metadata- and data-driven. Using Liquid templates, the code for each visualization creates specialized derivatives of metadata that are consumed to generate the web page. This approach puts the focus on metadata as data, rather than loosely structured description, and rewards high quality metadata by creating intricate browsing pathways for users.
Jekyll and Liquid are particularly suited to this sort of data transformation, able to generate new formats that can be reused in other applications. Rather than hide this data, we made the decision to expose it, making a variety of publicly re-usable derivatives easily downloadable from the site. For example, below is a list of the outputs (with links) that are listed at the bottom of the home page for the Archival Idaho Collection:
- Metadata CSV – all metadata fields in CSV format, configurable by the “metadata-export-fields” variable in theme.yml
- Metadata JSON – all metadata fields in JavaScript Object Notation (JSON) format
- Subjects JSON – unique subject terms and their counts in JSON
- Subjects CSV – unique subject terms and their counts in CSV
- Geodata JSON – a GeoJSON file with geographic coordinates and associated item metadata
- Locations CSV – unique location terms and their counts in CSV
- Locations JSON – unique location terms and their counts in JSON
- Timeline JSON – a JSON file formatted for use with TimelineJS
- Facets JSON – unique terms and counts for all metadata fields listed in the “metadata-facets-fields” variable in theme.yml
These metadata downloads and a table representation are further highlighted on the Data page. The web table is powered by DataTables with the JS code optimized to handle thousands of items; it allows users to filter and export subsets of the metadata records. Of course, all of these data formats are not necessary for every collection, so the tool will only build each data file if the related web page is also included in the navigation configuration file (_data/config-nav.csv), which controls which pages display as headers for the site. This means, for instance, that if one were to remove the map page from their navigation configuration file, the system would not expose a GeoJSON file for the collection.
In designing the tool, we took the “collections as data” mantra to heart. We hope this explicit acknowledgment of the data underlying the digital collection will encourage others to creatively reuse and rethink our repository. We also see this feature as an acknowledgment of the reality of migration: no platform is future proof–instead keeping the focus on investing in quality machine- and human-readable data in a variety of formats from the start ensures the collections we steward are ready for migration, preservation, and reproducibility.[3]
Home Page, a Bento Box of Options
First impressions, as we all know, are important. Most digital collections, however, are introduced poorly or not at all. Out-of-the-box CONTENTdm collections, for instance, feature a “landing page” that provides a space for a general textual description of the collection, that with some work can be customized with a few visual features (e.g. 2016 example of our Higgins collection). Alternatively, many more complex systems simply drop a user into a catalog-like presentation of the collection, eschewing contextual information altogether. We believe our collections—and, for that matter, the collections held by libraries and other institutions like them across the US—deserve better introductions than they currently receive. The design of our various skins throughout the years reflect that belief, as does our current iteration.
Our early skins often included a feature such as a carousel[4], map[5], timeline, or interactive display[6] to draw users into the collection. CollectionBuilder sites go a bit further, providing both an eye-catching featured image and contextual information about the collection. The tool uses a collection’s metadata to generate an overview of the collection’s era, location, subject matter, size, and content, and provides entry links from the overview information to encourage exploration. In some ways this is influenced by the popular concept of “dashboards,” but rather than forefronting administrative and use data, we are summarizing metadata to create a simple visualization of overall context for the collection.
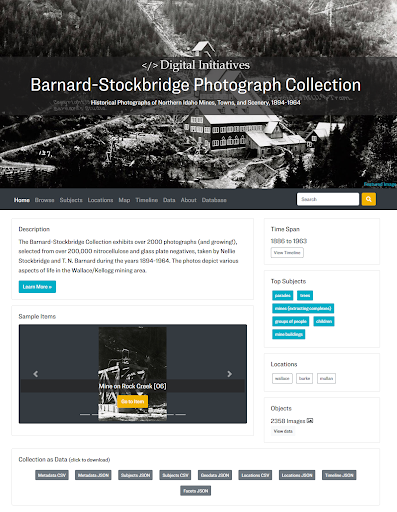
Figure 1. The CollectionBuilder-generated Home page for our Barnard-Stockbridge Photograph Collection.
The home page is customizable via the configuration of the theme file (_data/theme.yml). The theme allows a user to choose the featured image, determine the content of the carousel, and adjust the number and/or content of the featured subjects and locations. This allows for a great deal of customization and impact without modifying the base code. Choosing a featured image, for instance, is an important act of curation for the collection, as derivatives are used to represent the collection in meta tag markup (which will be displayed on social media). The theme also allows one to adjust the size and placement of that image, which has a significant impact on the look and feel of the home page.
Below the featured image, the infographic layout is made up of a series of modular cards presented in a bento-box style populated by automatically generated content. For example, “carousel” provides a Bootstrap carousel with a randomly selected group of images with direct links to the items. The ‘Time Span’ card calculates the date range of the collection and links to the Timeline visualization page. The code in our “Top Subjects,” “Top Locations,” and “Objects” cards calculates the unique values in specific metadata fields and provides links to the Browse page which will sort to that grouping. These cards can be swapped out depending on which work best with the collection’s metadata by replacing Jekyll _include commands — {% include index/[filename].html %} — on the home-infographic-layout.html file, which is contained in the _layouts folder. This enables the page to be quickly rearranged using Liquid includes and Bootstrap columns to provide variety.
Browse Page as Discovery Engine
Early versions of the skin often featured a “browse all” page with all collection images represented on an (almost) infinitely scrolling page. For some collections, all items were further represented as cards with image and basic metadata displayed. These cards were created using XSLT from the XML metadata, and arranged on the page using the jQuery plugin Isotope with masonry layout. Isotope allowed for randomizing the items and filtering using a simple search box. These early pages allowed users to seamlessly browse through all items at a larger scale as an alternative to clicking through page after page of thumbnails in the CONTENTdm interface “browse.”
Building on these earlier designs, we developed a Browse page that provides cards for every item in the collection. The metadata featured on each card is fully configurable (via the config-browse.csv in the _data folder), and field information can appear as textual or be represented as a button that, when clicked, instantly filters the page (see Figure 2 for an example of the result). This filtering feature is central to CollectionBuilder sites, as links on almost every page lead back to filtered versions of the Browse page. This allows users to quickly explore groupings and subjects that they discover while browsing items across the site. The page tracks filtering via URL hashes, making any filter shareable by copying the link, and allowing other pages to link into the filtered view.
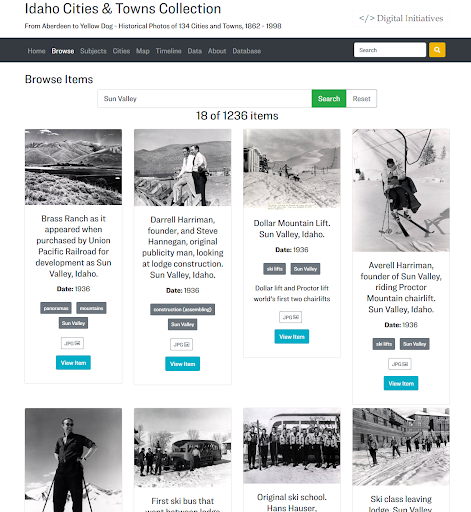
Figure 2. A portion of the Browse page for the Idaho Cities & Towns Collection, filtered to those items located in Sun Valley.
To make this visualization scaleable to thousands of objects[7], the creation of item cards and filtering is handled by JavaScript. Following options set in the config-browse.csv file, Liquid is used to create a subset of metadata in the browse-js include as a JS variable that then drives the visualization. The config file also controls the metadata fields which are displayed on the item card, using Liquid to manipulate the JavaScript function that creates each card. This function is kept fairly simplistic to enable easy modification of the card contents in cases where the automatic configuration is not flexible enough for the needs of the collection. The aim here, and throughout the codebase, is to keep the JavaScript simple and well commented enough that a typical digital librarian can figure it out, even if they are not expert developers.
Word Cloud (Still a really good visualization)
Word clouds are a common, yet useful way to quickly visualize word frequency in text. Applied to a metadata field, they provide a simple representation of the unique facets of a collection, allowing users to get an overall sense of the content, while also surfacing the unexpected. Some of our early skin sites featured word clouds of subject terms inspired by the Tagcrowd.com implementation.[8] Each subject term in those early word clouds linked to a CONTENTdm search, thus sending users out of the skin to the database view. Building on this concept, CollectionBuilder contains a flexible cloud layout, designed as a template that can generate a word cloud from any relevant metadata field, such as subjects, locations, or creators. Each unique term is rendered in the cloud as a button (highlighting its “clickable-ness”), with font size scaled to its relative frequency, and given a hyperlink to the Browse page which will display the related group of objects.
Despite the final result being a fairly simple visualization, this is one of the more complex pages to build, given the need to calculate unique terms and counts from the metadata fields which may contain thousands of individual values. Our first implementation was done entirely in Liquid, requiring several “for” loops within loops and a hacky data structure (as Liquid only supports a basic form of an array). A version of this Liquid routine is used in the lightweight version of CollectionBuilder, CollectionBuilder-GH, which is designed to run on GitHub Pages where Jekyll plugins are not allowed. We include it here, as it demonstrates a complex use of Liquid:
---

# find and count unique subjects used in the metadata

---

{%- if site.data.theme.subjects-page == true -%}

{%- assign cloud-fields = site.data.theme.subjects-fields | split: ";" -%}

{% comment %} Capture all cloud terms {% endcomment %}

{%- assign raw-terms = "" -%}

{%- for c in cloud-fields -%}

{% assign new = site.data[site.metadata] | map: c | compact | join: ";" %}

{% assign raw-terms = raw-terms | append: ";" | append: new %}

{%- endfor -%}

{%- assign raw-terms = raw-terms | downcase | split: ";" -%}

{% comment %} Clean up raw terms {% endcomment %}

{%- capture terms -%}{%- for t in raw-terms -%}{%- if t != "" and t != " " -%}{{ t | strip }};{%- endif -%}{%- endfor -%}{%- endcapture -%}

{%- assign terms = terms | split: ";" | sort -%}

{%- assign uniqueTerms = terms | uniq | sort -%}

{ "subjects": [

{% for u in uniqueTerms %}{% assign count = terms | where_exp: 'item', 'item == u' | size %}{ "subject": {{ u | jsonify }}, "count": {{ count }}, "link": {{ u | url_param_escape | prepend: '/browse/#' | absolute_url | jsonify }} }{% unless forloop.last %},

{% endunless %}{% endfor %}

]

}{%- endif -%}
Liquid iteration tags like those used above, however, are fairly slow, which can lead to unreasonably long build times as the size of projects or data increase. In our initial iterations this slowness was compounded, as code throughout the repository calculated unique terms for several data outputs in addition to the Cloud page. As we began redesigning larger digital collections, the speed of Liquid became a limitation, making iterative development cumbersome as build times soared. At first, we would use smaller subsets of the metadata and turn off calculating clouds during development so that rapid iteration was still possible. One of the advantages of working with CollectionBuilder, however, is the way it exposes issues (and interest) in the metadata, so working with subsets is a suboptimal solution. This led us to explore methods to optimize the Liquid code, such as replacing “for” and “if” statements with equivalents using “where” or “where_exp,” which are significantly faster and minimize iterations.
Even with optimization, using Liquid for calculations within Jekyll slows build time significantly—a much more efficient solution is to use a Jekyll plugin. Jekyll’s Ruby-based plugin system provides a means to add custom functionality injected into the generator engine at build time. A large ecosystem of formally packaged plugins exist, or any new plugin can be written in Ruby and added to the project “_plugins” directory. Any calculations completed directly in Ruby will be exponentially faster than complicated Liquid routines.
After much experimentation, we developed a plugin “array_count_uniq” that adds a new Liquid Filter to the project environment. To use it, we first gather the desired data as a Liquid array, then apply the new filter:
{{ myArray | array_count_uniq }}
The filter will return a hash of the unique values and their frequency counts which can then be iterated over like any other array to use the calculated values in the page template. Following CONTENTdm conventions, we use semicolons to denote multivalued fields. For example, an average value in the Subject column might look like “Idaho; Potatoes; Mountains,” which is obviously three separate subject terms, not a single value. Thus, to prepare the array, the cloud layout uses “map” to extract values from the desired field(s), joins them with a semicolon, then splits on semicolon to create a unified array of all terms which can then be passed to the “array_count_uniq” filter. Using the filter on a single metadata field (“example_field”) would look like:
{% assign uniqueHash = site.data.metadata | map: "example_field" | join: ";" | downcase | split: ";" | array_count_uniq %}
The implementation in the cloud-js include is more complicated because we support combining multiple metadata fields into a single visualization.
This plugin filter reduces build times exponentially, completely removing the old bottleneck of calculating unique counts. Since the plugin is fairly simple and idiosyncratic to the needs of the CollectionBuilder project, we haven’t independently packaged it—we consider it part of the template and it can be found in the _plugins folder. We see the creation of additional plugins as a way forward for making CollectionBuilder more efficient, but hope to balance it against our aim to keep the overall project complexity low.
Seeing Space: From Fusion Tables to Leaflet
When our early PHP-based skins were developed, creating your own interactive map layer was a very challenging undertaking. So when Google Fusion Tables launched in 2009,[9] the web service was embraced by librarians looking to build map visualizations using only a spreadsheet and bit of configuration on the platform. We implemented Fusion Tables extensively for our digital collections, customizing Google API JavaScript examples to load Fusion Tables-based maps on our collection pages. Like so many other Google products, however, Fusion Tables was terminated in December of 2019, and all our old map features are now obsolete.
Luckily, already growing cautious of 3rd party services, we had begun moving our map applications to self-contained JavaScript using the open source library Leaflet.js in 2017. Leaflet is efficient, well documented, and has a robust plugin ecosystem, making it relatively easy to implement custom map features on static pages using openly available tile layers.
To provide data to the map, we use a Liquid template to generate GeoJSON features for the items that contain latitude and longitude metadata values. Other descriptive metadata configured in “config-map.csv” is included on popups from the map pins or used in searching. A GeoJSON file with more complete metadata is also generated in the data exports, which can be easily used in other projects and analysis. Using Liquid templates with the metadata is a practical way to carry out these types of data transformations, as can be seen in the code to generate GeoJSON:
---

# generate geojson data for collection items with lat-longs

---

{%- assign items = site.data[site.metadata] | where_exp: 'item','item.latitude != nil and item.longitude != nil' -%}

{%- assign fields = site.data.theme.metadata-export-fields | split: "," -%}

{

"type": "FeatureCollection",

"features": [

{% for item in items %}

{

"type":"Feature",

"geometry":{

"type":"Point",

"coordinates":[{{ item.longitude }},{{ item.latitude }}]

},

"properties":{

{% for f in fields %}{% if item[f] %}{{ f | jsonify }}: {{ item[f] | jsonify }},{% endif %}

{% endfor %}

"reference_url": {{ '/items/' | absolute_url | append: item.objectid | append: '.html' | jsonify }}

}

}{% unless forloop.last %}, {% endunless %}{% endfor %}

]

}
Three Leaflet plugins add further functionality to the map visualization: 1) leaflet-fusesearch which provides basic search functionality for the items displayed on the map; 2) Leaflet.markercluster, which clusters individual items on the map, cleaning up the display and significantly improving performance and useability for large collections; 3) Leaflet.MarkerCluster.Freezable, which allows clustering to work alongside search by temporarily unclustering to display query results. To make working with Leaflet easier, we expose the basic map configurations and plugin options as values in the theme.yml file, allowing you to quickly test different settings for each collection. To ensure missing configuration options won’t break the visualization, we set sane defaults using Liquid’s “default” filter.
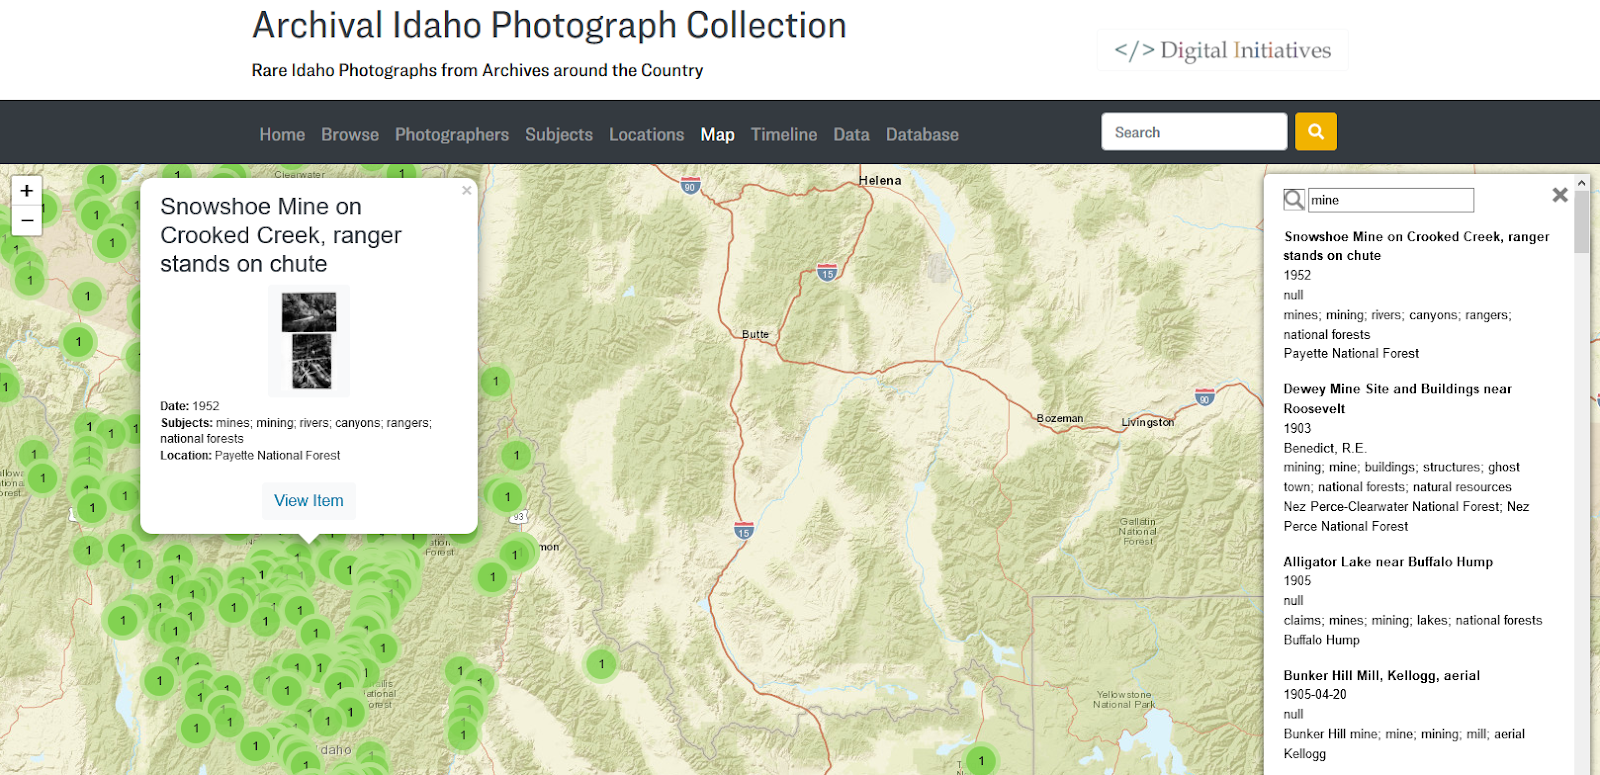
Figure 3. An example CollectionBuilder Map page from our Archival Idaho Photograph Collection. Leaflet plugins allow clustered map items to be searched.
Traveling Time: From Simile Timeline to Simple Table (+ timelinejs)
It seems dated now, but Simile’s JavaScript Timeline visualization was all the rage about 10 years ago. We still believe it’s a fairly good visualization, even if it isn’t that mobile friendly or up to today’s design standards. We used to implement Simile Timelines for all our collections, generating the required XML file from the collection’s metadata and customizing the timeline code to work with our collection’s time spans. We still proudly use one on our main digital collection website to this day.
However, with CollectionBuilder, we realized it was probably time to say goodbye to Simile Timeline. At first, we thought we might need a sophisticated tool that allowed for unique viewing methods such as horizontal scroll. Yet as we examined other visualizations, we realized a simple table with the capacity to jump to certain years provided the best use case for our collections.
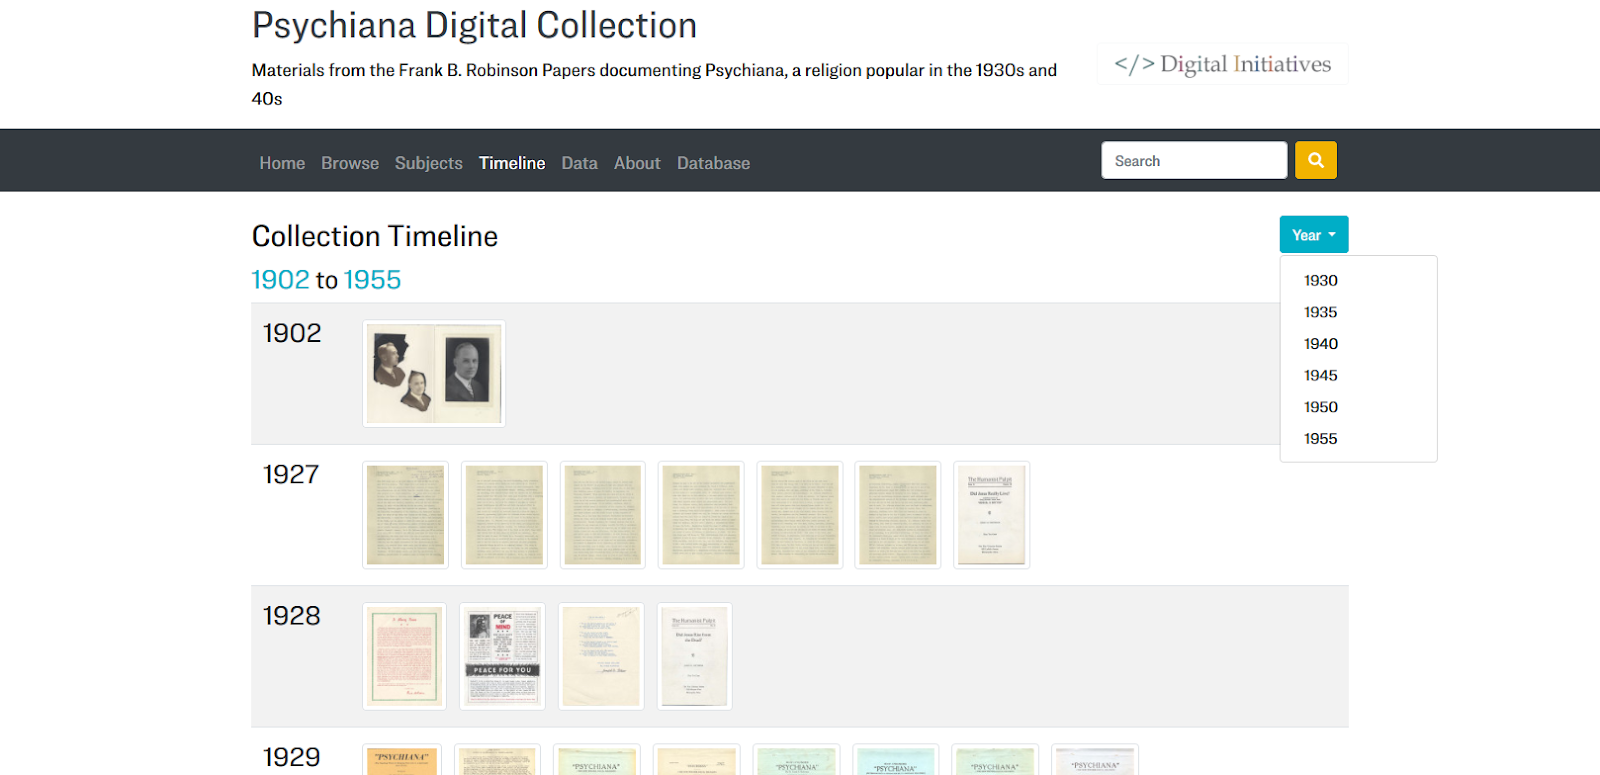
Figure 4. An example CollectionBuilder Timeline page from our Psychiana Digital Collection. A simple table format has proven to be an effective way to organize items by year.
The Liquid code that generates the timeline operates by mapping all the dates in a collection and finding unique years. It then builds a row for each year that drops a thumbnail or text-based card for each item that has a date field containing that year. We have found, somewhat to our surprise, that this is often the best visualization for us to get a good overview of our collection, and we believe it to be a very effective timeline visualization, possibly even better than Simile’s.
We also recognize that there is often a need for curated timelines that look a bit fancier and are more enticing to the user. TimelineJS is a well-known visualization built and maintained by the Knightlab. We had previous experience building TimelineJS visualizations by connecting published Google Sheets with metadata, but with CollectionBuilder we decided to generate a JSON file that could be consumed by TimelineJS to build a timeline. This is currently a feature that can be included on a collection’s index in the home-infographic layout or separately as its own page. We use this timeline, for example, on the front page of our Dworshak Dam Collection to provide a historical overview of the politics and media surrounding the debate around building a northern Idaho Dam in the 1960s. The include to add the TimelineJS code to any page looks like this: {% include index/timelinejs.html %}. The feature is driven by the timelinejs.json file, which is generated automatically using Liquid.[10]
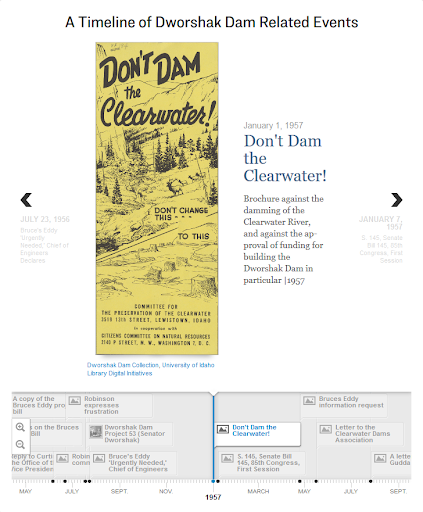
Figure 5. An example of the TimelineJS include on The Dworshak Dam Collection’s index page.
Item Pages – Built to be Found
Our earliest skins provided the browsing features described above, but when it came to displaying individual object pages, links would lead directly to the CONTENTdm item page. This was unsatisfying in that it kicked users out of the skin website and into a separate ecosystem without meaningful links back into the discovery features on the collection’s skin. This also meant that the representation of the object on CONTENTdm must be the definitive one, featuring the most up-to-date and complete metadata. Given that individual CONTENTdm metadata is notoriously difficult to update in bulk, this can lead to a large amount of work or technical debt when updating aging collections.
The earliest proto-CollectionBuilder site was a project to redesign the Idaho Waters Digital Library. A small grant provided resources to employ a graduate student with disciplinary expertise to enhance existing metadata, as well as add new documents to the collection. This overhaul of the metadata was too difficult to bulk re-ingest into CONTENTdm, so we decided to provide static item pages featuring the enhanced metadata, rather than forcing it back into CONTENTdm. As we further explored this approach, we realized that because static item pages provide the opportunity to: 1) embed rich markup driven directly by a collection’s metadata CSV, 2) include links back into the skin visualizations, and 3) customize the presentation of objects, they were a better option for all of our collections.
To generate individual HTML pages directly from the metadata CSV, we turned to the “Jekyll Data Pages Generator” plugin by Adolfo Villafiorita, which was slightly modified for the needs of our project. Configured in _config.yml, this plugin injects a page object for each line of a data file into the Jekyll engine on build.[11] For CollectionBuilder, this means that each object in the metadata will generate an HTML page and all field values will be available to call into the template using Liquid, allowing the metadata to drive the creation of detailed, machine-readable markup and full item representations.
Creating the object pages is handled by the “item” layout. The look and feel of these pages originally mirrored the CONTENTdm item pages, while cleaning up and simplifying the interface with a two column approach (collapsing to one column on mobile). The left side features an image representation and object download buttons that are logically selected based on the format field in the metadata. These use the CONTENTdm APIs to load images and download objects. The right column features the metadata displayed in an easily readable format that can also be copied by the user.
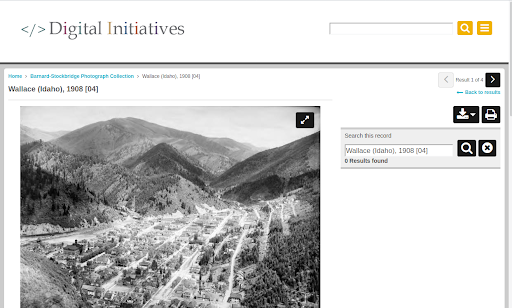
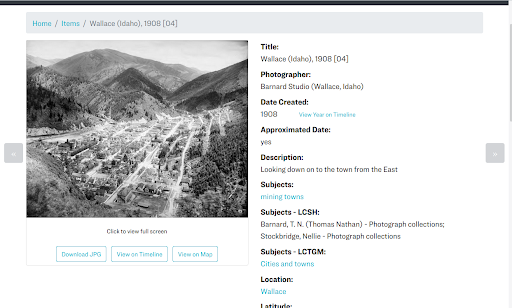
Figure 6. An example CONTENTdm item page from our Barnard Stockbridge Collection (top) and the same item’s page in our CollectionBuilder site (bottom).
The metadata fields displayed and meta markup on the item page is configured by the config-metadata.csv, allowing for easy customization of what information is exposed on the page. This config file allows individual fields to be designated as browse links, which transforms values into hyperlinks that lead back to the Browse page, which is filtered on the term. Items with latitude and longitude will feature the button “View on Map,” linking to the item’s location on the Map page, and likewise those with a date have a “View on Timeline” button, linking to the item’s location on the Timeline page. These linkages drive the interactive pathways for the user to explore each collection through visualizations.
Although the item pages may look similar to CONTENTdm’s object display, underneath things are quite a bit different. CONTENTdm pages are generated using JavaScript, which loads data from the database, but fails to add any semantic markup standards to the base or rendered page.
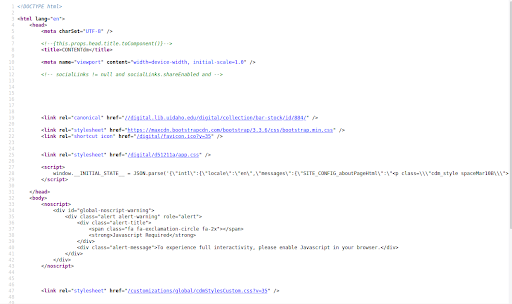
Figure 7. An example of CONTENTdm item page markup.
In contrast, CollectionBuilder exposes rich, machine-readable markup driven by the full collection metadata. The Item layout calls a special meta markup in the head element (_includes/head/item-meta.html). This adds three semantic markup standards in addition to standard HTML meta tags.
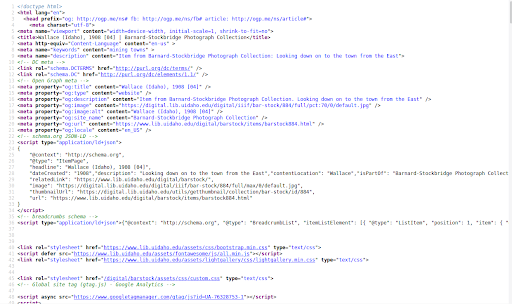
Figure 8. CollectionBuilder item page, rich meta markup in a variety of standards.
First, this item-meta code adds meta tags containing Dublin Core terms schema based on mappings set up in the config-metadata file. This implementation is based on the output of DSpace repositories (e.g. view the source of this WSU Research Exchange item page). This is not a commonly used form of markup, but since it is used by other repository systems, there may be harvesters designed to crawl it.
Second, it adds Open Graph meta tags. Open Graph protocol was originally designed by Facebook to create a standard for assigning metadata to represent webpages on the social media site. Other platforms, such as Twitter, maintain separate markup standards, but can also read Open Graph as a default, making it a good generic choice to provide this functionality. The Open Graph prefix is declared on the head element:
<head prefix="og: http://ogp.me/ns#">
The schema can then be used in meta tags following the standard, with values added from the item metadata using Liquid, e.g.
<meta property="og:title" content="{{ page.title | escape }}" />
This structured data will be used by social media platforms to create the familiar card representations when links are entered into posts, providing an official preview of the content. Thus, if you tweet out a CollectionBuilder item page, the object image or thumb will appear along with the actual item title and description.
Third, the item-meta include creates Schema.org markup in JSON-LD format. The data is contained in a script element of type “application/ld+json.” A Liquid template adds appropriate metadata fields, image links, and establishes an “isPartOf” relationship to the full digital collection. Additionally, breadcrumbs are provided in the Schema standard, further reinforcing the contextual relationship of the object. This structured data is used by search engine crawlers to learn more about the page and its relationships, semantic markup that can help with SEO and with the representation displayed to users in search results.
How We Use CollectionBuilder
We started using CollectionBuilder in earnest to develop our digital collections at the end of 2018, using an agile ‘sprint’ in the Data and Digital Services Department at the University of Idaho Library to jump start the creation of the necessary data and design files. Although this early version of CollectionBuilder was not fully developed, our team was able to prepare the metadata, configuration files, and textual content. Since this data (literally the collection as data) is independent of the CollectionBuilder template, the implementation of visualizations and infrastructure could continue to develop and evolve separately, much like a WordPress theme. Due to staffing issues, we did not return to applying CollectionBuilder to our own collections in earnest again until the summer of 2019, during which we solidified our workflow for building and updating all of our digital collections.
Currently, we use CollectionBuilder via a Git/GitHub focused workflow to develop our digital collections in an open, collaborative way with librarians and staff at the University of Idaho Library. The code for all collections is contained in a single GitHub repository with the master branch representing the generic template. Each individual collection is developed in a new branch within the repository, allowing us to create unique sites while maintaining a central codebase. This approach helps us to keep the underlying code up-to-date with improvements we often make while retaining each collection’s individual customizations and commit history that details the changes that were made.
The basic workflow moves through seven areas of activity:
- Repository Branch Creation (GitHub)
In our CollectionBuilder GitHub repository, we create a branch for the collection, using a branch name that corresponds to that collection’s short URL name. For example, the collection https://www.lib.uidaho.edu/digital/barstock/ is developed on a branch named ‘barstock.’ - Metadata Extraction/Preparation/Revision
We extract a TSV file of the collection’s metadata from CONTENTdm using the export feature on CONTENTdm’s Project Manager tool. We upload this data into Google Sheets, where we check the metadata for errors, correct any field names that need to change (subjects becomes subject, etc.), and add a unique objectid field. Finally, we download the CSV of the document and add it to the _data folder of our branch. - Config File Editing
We configure the various files that drive the generation of the site. These include: /_config.yml, where we record which collection and URL we’re building; /_data/theme.yml, which controls the basic configurations for all of our visualizations (map, timeline, word clouds, etc.), data files, and our front page; and a series of “config-(…).csv” files (config-map.csv, config-browse.csv, config-metadata.csv, etc.) that further configure what information shows up on which pages. - Development Server Review
We serve up the newly configured site on our computer with the Jekyll serve command (‘jekyll s’). We then examine the website generated for obvious errors and additional visualization or browsing feature possibilities. We often look at the facets.json data file generated by the system (and configured by the theme.yml file) to see if there might be other fields to visualize in a word cloud format, or even a modified timeline. - Build Static Web Files
We’ve added a rake command to build our website for production. The command ‘rake deploy’ builds the site for production by running the Jekyll command `JEKYLL_ENV=production jekyll build.` The production environment triggers the addition of features left out during development, such as full meta markup and Analytics snippets. This keeps our analytics account clean from server hits, while allowing us to have the code pre-built with an analytics variable in our _config.yml file. - Deploy Web Files to Production Server
We then copy the files and folders contained in the _site folder and add those files to the correct directory on our production web server. - Push Changes to Git Branch of the Repository
If more complicated revisions or additions are being made, we try to push changes several times as we revise the site running on the development server. If the changes are small, however, we just push these changes at the end of the process.
When substantial development changes are made to the master branch code, these are pulled into all of the collection branches. These collections are then rebuilt, deployed, and their updated code is pushed to the repository (Steps 5 through 7). This framework facilitates the rapid development of custom visualizations and features, enabling us to generate unique interfaces for more collections. Low priority collections use the standard template, reaping the benefits of the skin interface without a large investment of time. Meanwhile, higher priority collections can be more quickly developed into unique sites, while still maintaining elements of a common theme and branding. For collections requiring extensive customization, the templates act as recipes that can be quickly adapted to new purposes, without getting too far from the original code base, making maintenance easier.
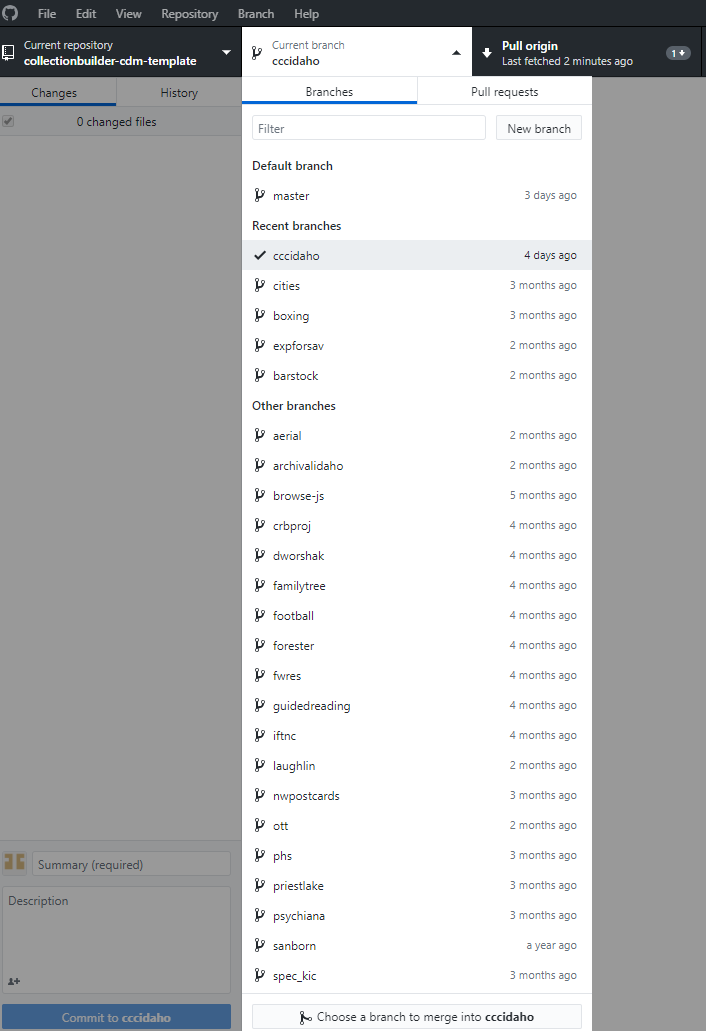
Figure 9. Detail of the branches for our digital collections, as seen listed in a GitHub desktop platform.
Besides being an excellent way to keep our collections’ code up to date, creating and managing our collections on GitHub has also expanded collaborative opportunities, allowing more staff to participate in creating collections and giving them an opportunity to learn from the updates and alterations their colleagues make. More people working on collections makes it easier for us to keep our collections up to date, and any mistakes that might be made by those relatively new to working with our digital collections can be easily reverted by CollectionBuilder’s developers using Git.
Conclusion: Next Steps
Throughout our development of CollectionBuilder-CONTENTdm, we have been encouraged by the value that this tool can bring to other contexts, especially situations involving teaching digital collections and operating without a DAM system altogether. This has led us to develop other versions of the tool which function independently of the APIs our skin version relies on.
Two versions, CollectionBuilder-GH (GitHub Pages) and CollectionBuilder-SA (Stand Alone), utilize Lunr.js to power searching within collections as fully static sites. GH is designed to be set up entirely using the GitHub web interface and hosted on GitHub Pages. This “lite” version is optimal for pedagogical environments because it does not require users to generate derivatives of their digital objects or install any software, which frees up more time for teaching metadata and web skills. SA combines the optimized code base of CollectionBuilder-CONTENTdm with the independence of GH, allowing users to create a more robust collection not tethered to a DAM system or APIs. This version requires that the user generate thumbnails and small image representations of their full size objects, optimizing the performance and accessibility of the site. Once ready to deploy, these digital objects are hosted alongside the site’s static pages on a basic web server of the user’s choice.
CollectionBuilder-ES (Elastic) is currently the least developed, but combines the code of the SA version with powerful new search functions that will make large-scale use of CollectionBuilder a possibility. By connecting individual digital collections in a modular fashion, our Elastic version of CollectionBuilder will enable cross-collection searching, and allow for pulling together curated exhibits of items from a variety of collections across different institutions. This could provide a viable alternative to traditional database-driven DAMS systems for individual libraries and organizations, and open unique possibilities to cross institutional boundaries. To accomplish this goal we are working with a developer to integrate Elasticsearch functionality and investigate object storage solutions as well as a variety of deployment options that would enable the tool to follow the JAMstack model.
Ultimately, even as these versions become more mature they will retain their focus on leveraging the collection as data in order to present the collection as a collection, i.e. a grouping that comes to mean more than the sum of its items. Through our continued investment in the metadata driven visualizations that inspired our initial skin version and new features such as our recent efforts to help users more easily compose engaging “about” pages, we endeavor to move beyond the catalog-based view offered by most DAMS platforms. To this end, CollectionBuilder opens up possibilities for the librarians, library staff, archivists, and other GLAM professionals that use it to provide contextually based and data-driven features for the collections they steward. This in turn allows our users to discover and engage with digital collections as collections rather than a series of disembodied items stored in systems we did not design, do not control, and which do not sufficiently communicate the value of the collection as such.
For additional information, please see the CollectionBuilder website, as it is regularly updated with latest features, a variety of documentation, and examples.
About the Authors:
Devin Becker is the Director of the Center for Digital Inquiry and Learning (CDIL) and the Head of Data & Digital Services at the University of Idaho Library. Becker is also a writer. His most recent (static!) web project, CTRL+Shift, provides visualizations and analyses of interviews he conducted with prominent poets across the country.
Olivia Wikle is the Digital Initiatives Librarian at the University of Idaho, where she coordinates the digitization of the University’s archival material and builds digital collections that disseminate historical resources. She also works closely with humanities faculty to create digital scholarship projects and teach digital literacy skills to students.
Evan Peter Williamson is the Digital Infrastructure Librarian at the University of Idaho Library, working with Data & Digital Services to bring cool projects, enlightening workshops, and innovative services to life. Despite a background in Art History, Classical Studies, and Archives, his recent focus has been on data-driven, minimal infrastructure web development, currently embodied in the CollectionBuilder project.
Endnotes
[1] This setup could be more colloquially described as a “party in the front, CONTENTdm in the back” approach to development.
[2] Devin Becker and Erin Passehl-Stoddart, “Connecting Historical and Digital Frontiers: Enhancing Access to the Latah County Oral History Collection Utilizing OHMS (Oral History Metadata Synchronizer) and Isotope”, code4lib 29, 2015-07-15, https://journal.code4lib.org/articles/10643
[3] The human-readable aspect of this has come as a revelation, as the facets.json file has now become the first thing we look at when designing a new collection. We use it to quickly evaluate which fields have data within them that would reward a word cloud (or visually faceted) expression, as well as to familiarize ourselves with a quick overview of the collection.
[4] e.g. 2016 capture of the Stonebraker Collection
[5] e.g. 2019 capture of Campus Photograph Collection
[6] e.g. Argonaut newspaper headlines
[7] Having thousands of images on the page obviously also requires “lazy loading” to avoid page load issues. To intelligently defer image load, we use lazysizes, a simple to use, up-to-date lazyload library that requires no initialization, and will simply load all images if browser support is missing. Images are given the class=”lazyload”, and “src” is replaced by “data-src”.
[8] e.g. 2016 Stonebraker Subject Cloud
[9] https://en.wikipedia.org/wiki/Google_Fusion_Tables
[10] We’ve found that it’s best to edit this file down significantly for the best performance, which we do either manually or by creating a truncated CSV of the collection’s full metadata CSV file. We then edit the code generating the JSON to refer to that data file, adjusting the “{%- assign items = site.data[site.metadata] -%}” line at the top to reference the truncated CSV, i.e. {%- assign items = site.data.psychiana-select -%}.
[11] Building item pages using our modified version of the Data Page Generator plugin is efficient, since the iteration through the metadata is done in Ruby. However, the sheer number of items becomes a major factor in the build time for the site. Since the Jekyll build process involves writing out so many files on disk, the speed is not limited by your computer’s CPU, but by the write speed of your hard drive.

Subscribe to comments: For this article | For all articles
Leave a Reply