by Qing Zou
Introduction
EZproxy is a popular web proxy server that is widely used in academic libraries for providing off-campus access to their owned or subscribed electronic resources. Although EZproxy provides many mechanisms (e.g. auditing, intrusion detection, server sessions status, and usage limit functions) to ensure secure accesses, malicious system intrusions and illegal downloading have been experienced by many libraries. These activities may cause temporary blockage of access to certain electronic resources by content providers. Due to the high amount of usage and limited existing functionality of EZproxy for monitoring users’ activities, it is challenging for libraries to be more proactive in detecting users’ illegal activities.
Approach
This paper proposes a novel way to monitor EZproxy in real time by integrating Elasticsearch/Logstash/Kibana (ELK) into the existing EZproxy environment. In this approach, the log files of EZproxy are considered as valuable dynamic data sources. Unlike normal traditional approaches[1] to analyzing EZproxy log files, users’ activities through EZproxy are monitored and visualized in real-time.
System Architecture
In this approach, each open source application package of ELK plays a different role collaboratively to “make searching and analyzing data easier than ever before” [2]. Built on Lucene search engine, Elasticsearch [3] provides indexing functionality for handling log information. Logstash [4] is a tool for managing events and logs . Kibana [5] is used to visualize logs and time-stamped data.
Since a typical EZproxy server may run with limited memory (1 Gigabyte Random Access Memory or less) and ELK requires more memory to run smoothly, it is not practical to run ELK and EZproxy on the same server. Fortunately, Logstash-forwarder [6] is able to run with limited memory and ship logs out of the EZproxy server without significantly decreasing the level of performance of the existing EZproxy server. Figure 1 shows how ELK works with an existing EZproxy server.
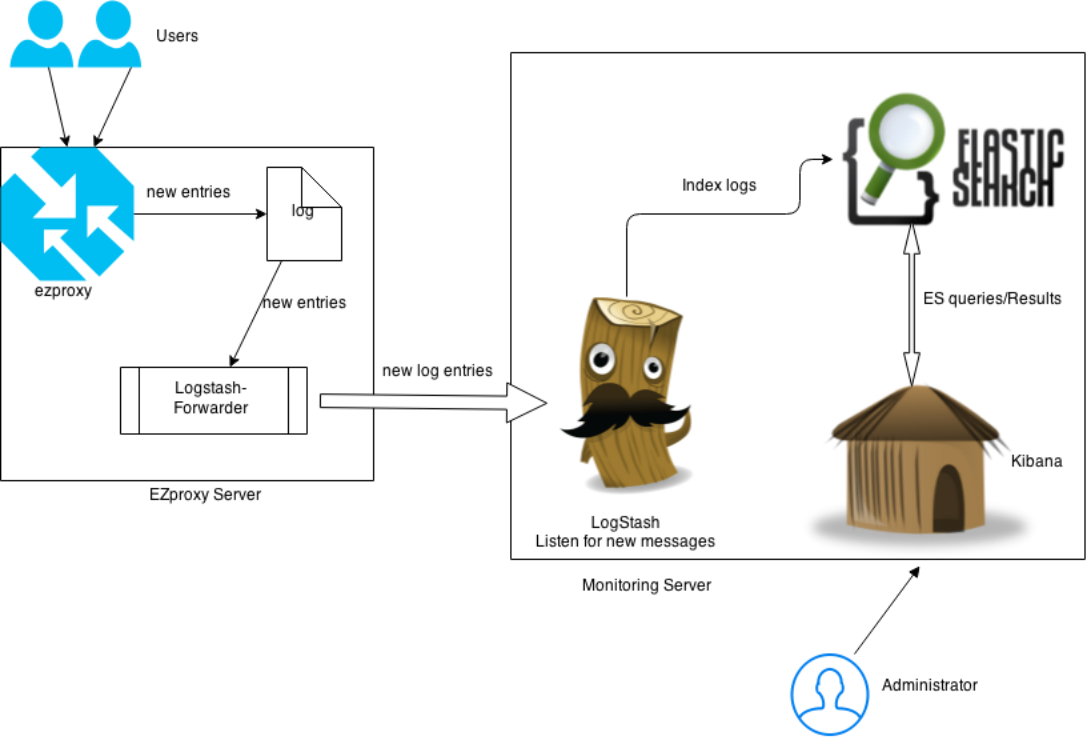
Figure 1. System Architecture
Basically Logstash-forwarder works with an EZproxy server and monitors any changes of the log file of the server and sends new log entries to the monitoring server. On the monitoring server, LogStash listens for new messages (log entries) from the Logstash-forwarder and indexes them into Elasticsearch. Kibana visualizes the indexed logs and presents them to administrators.
How it Works
This approach converts unstructured EZproxy log entries into structured indexes. EZproxy records any accesses in log files. The typical entry in an EZproxy log file looks like as follows:
xxx.xxx.xxx.xxx rezou1 [01/Feb/2015:04:07:44 -0500] GET
http://apps.webofknowledge.com:80/WOS_GeneralSearch_input.doSID=1
CZc4vBpTsUjJE4mdGy&product=WOS&search_mode=GeneralSearch&errorQid=
45 HTTP/1.1 200 81049
The format of log entries is controlled by LogFormat [7] in the EZproxy configuration file. The example above is using the following format:
LogFormat %h %l %t %r %s %b
| Field | Value |
| %h | Host accessing EZproxy (always IP address). |
| %l | Remote username obtained by idented (identd is not used, so this always inserts -). |
| %t | Date/time of request; may also appear as %{format}t to specify a strftime time format. |
| %r | Complete request (e.g. GET http://www.somedb.com HTTP/1.0). |
| %s | HTTP numeric status of request (always 200 in EZproxy 1.0 and 1.2). A table of special EZproxy-specific status codes appears below. |
| %b | Number of bytes transferred. |
Figure 2 LogFormat Fields [7]
Logstash-forwarder is a log shipper that collects logs locally in preparation for processing elsewhere. The Logstash-forwarder is written in Go language [8] developed by Google and can be compiled into one executable binary file. It is rather simple to run:
Logstash-forwarder -config logstash-forwarder.conf
All configuration settings are from logstash-forwarder.conf as the -config option indicates. The content of the config file is straightforward, similar to the following:
{
 "network": {
  "servers": [ "logstatsh server:port" ],
  "ssl certificate": "/etc/pki/tls/certs/logstash-forwarder.crt",
  "ssl key": "/etc/pki/tls/private/logstash-forwarder.key"
 },
 "files": [
  {
   "paths": [ "/var/log/ezproxy/ezproxy.log" ],
   "fields": { "type": "apache-access" }
  }
 ]
}
The “network” stanza covers network configuration; “servers” indicates which server is listening for messages from the EZproxy server. The “ssl certificate” and “ssl key” are used to authenticate server connections so that only authenticated server(s) can receive messages. The “files” stanza tells Logstash-forwarder where the ezproxy.log resides and what type of the file it is.
The ELK stack is quite easy to install. Elasticsearch and Kibana almost work out of the box. The configuration of LogStash is similar to the following:
input {
  lumberjack {
    port => portnumber
    ssl_certificate => "/opt/logstash/logstash-forwarder.crt"
    ssl_key => "/opt/logstash/logstash-forwarder.key"
    type => "apache-access"
  }
}
filter {
  if [type] == "apache-access" {
    grok{
      patterns_dir => "patterns"
      match => { message => "%{EZPROXYLOG}" }
    }
  }
}
output {
    elasticsearch {
      host => localhost
    }
      }
The configuration consists of three parts: input, filter, and output. The input contains settings for connecting with the Logstash-forwarder on the EZproxy server. The “port” is the port specified in the Logstash-forwarder “servers”. The “ssl certificate” and “ssl key” are the same files for the Logstash-forwarder. The “filter” stanza is for dividing messages into small separate pieces. Since the type of our messages from the EZproxy server is set as “apache-access”, the filter matches this type of messages and uses Grok [9] to parse log data and to follow the pattern called “EZPROXYLOG” shown as follows:
EZPROXYLOG %{IP:client_ip} %{USER:ident} \[%{HTTPDATE:timestamp}\]
%{WORD:verb} %{NOTSPACE:request} (?:HTTP/%{NUMBER:httpversion})
%{NUMBER:response} %{NUMBER:bytes:int}
The message is parsed into the following structure:
{
	"client_ip" => "xxx.xxx.xxx.xxx",
          "ident" => "rezou1",
      "timestamp" => "01/Feb/2015:04:07:44 -0500",
           "verb" => "GET",
        "request" => "http://apps.webofknowledge.com:80/WOS_GeneralSearch_input.doSID=1CZc4vBpTsUjJE4mdGy&product=WOS&search_mode=GeneralSearch&errorQid=45",
    "httpversion" => "1.1",
       "response" => "200",
          "bytes" => 81049
}
The “output” stanza is to tell Logstash to spill out the converted log data into Elasticsearch. By default, Logstash creates one index for the log data each day. For example, the message indexed in Elasticsearch is similar to the following JSON (JavaScript Object Notation) snippets:
{
"_index": "logstash-2015.02.01",
"_type": "apache-access",
"_id": "AUtXCf8A5aX4WyjlYJPR",
"_version": 1,
"_score": 1,
“_source”:{
     "message" : "xxx.xxx.xxx.xxx rezou1 [01/Feb/2015:04:07:44 -0500] GET 			http://apps.webofknowledge.com:80/WOS_GeneralSearch_input.do?SID=1CZc4vBpTsUjJE4md	Gy&product=WOS&search_mode=GeneralSearch&errorQid=45 HTTP/1.1 200 81049",
     "@version" : "1",
     "@timestamp" : "2015-02-04T15:59:32.223Z",
     "type" : "apache-access",
     "file" : "/var/log/ezproxy/ezproxy.log",
     "host" : "ezproxy.lakeheadu.ca",
     "offset" : "4937",
     "client_ip" : "xxx.xxx.xxx.xxx",
     "ident" : "rezou1",
     “timestamp" : "01/Feb/2015:04:07:44 -0500",
     "verb" : "GET",
     "request" : "http://apps.webofknowledge.com:80/WOS_GeneralSearch_input.do?SID=1CZc4vBpTsUjJE4mdGy&product=WOS&search_mode=GeneralSearch&errorQid=45",
     "httpversion" : "1.1",
     "response" : "200",
     "bytes" : 81049
}
The LogStash-Forwarder running on the EZproxy server watches for any additions to the ezproxy.log file and sends newly added entries to the LogStash. The LogStash service receives new entries and indexes the entries in Elasticsearch. Kibana loads changes in the Elasticsearch indexes and visualizes in real time.
Results
Visualization can be viewed using any modern browser. Kibana provides many ways to configure preferred views. The following bar diagram displays the amount of access from January 29th to February 3rd , 2015 at Lakehead University.
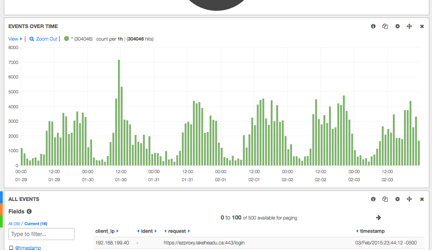
Figure 3. Events Over Time
The following is a combined view of top 10 users and top 10 IP addresses. One of the top 10 IP address has been selected, shown in the bottom pie diagram and the users who used this IP address shown in the upper diagram. It is clear enough to spot high volume traffic of a user or one IP address in either top 10 users or IP addresses diagrams. Usually, high volume may indicate potential problems.
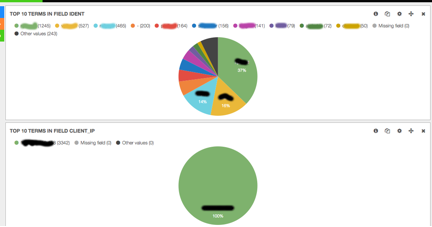
Figure 4. A Combined View of Top 10 Users and IP Addresses
Although this approach makes easier to visualize log entries and to spot potential problems, it still requires attention to check continually. Fortunately, raw log entries have been converted into structured indexes. More proactive approaches can be developed to detect anomalies or retrieve usage counts during a period of time. For example, the following query retrieves the users associated with 2,000 or more log entries and their corresponding IP addresses:
curl –XGET ‘http://monitoringserver:9200/_search?pretty’ -d ‘
{
  "aggs": {
    "users": {
      "terms": {
        "field": "ident",
        "min_doc_count": 2000
      },
      "aggs": {
        "ips": {
          "terms": {
            "field": "client_ip"
          }
        }
      }
    }
  }
Similarly, a query for retrieving a specific user’s usage can be developed. Other scripts can be developed to collect information and send emails to administrators automatically if there are activities that may indicate potential problems.
Future Work
More proactive approaches can be developed by applying data mining, pattern matching, or machine learning techniques for detecting outliers automatically. Elasticsearch provides rich support for geographical information. Meanwhile, Kibana has map plugins that can display geolocation of IP addresses in a straightforward way. Logstash provides a “geoip” filter to associate IP addresses with their geolocation, including latitude, longitude, city, region and country. With geolocation information stored in Elasticsearch indexes, it is easier to identify illegal usages (e.g. a user with multiple IP addresses and accesses from different locations at the same time).
Conclusion
The ELK approach has been explained and demonstrated in this paper. This novel approach will simplify the effort to monitor EZproxy users’ activities. It provides a friendly interface via visualization. It makes it possible to develop more proactive approaches to detect outliers and prevent blockages from happening.
Acknowledgements
The author would like to thank the editors and reviewers for their valuable comments and suggestions. Special thanks to Moira Davidson (Head of Technical Services at Lakehead University Library) for her suggestions to improve this article and working closely with the author to develop this approach.
Notes
[1] http://acrl.ala.org/techconnect/?p=4684
[3] http://elasticsearch.org/overview/elasticsearch
[5] http://www.elasticsearch.org/overview/kibana/
[6] https://github.com/elasticsearch/logstash-forwarder
[7] https://www.oclc.org/support/services/ezproxy/documentation/cfg/logformat.en.html
[9] http://logstash.net/docs/1.4.0/filters/grok
About the Author
QING ZOU is a systems librarian at Lakehead University and a PhD candidate at the School of Information Studies at McGill University, Canada. His research interests are integrated library systems, institutional repositories, metadata, ontology, knowledge organization systems, and digital archives.

Subscribe to comments: For this article | For all articles
Leave a Reply