by Andrew Darby
34
Welcome to Issue 34 of the Code4Lib Journal. We have a great issue for you, with articles about digital preservation, digital archaeology, open source application development, customizing proprietary applications, and more; please check them out. But it’s election season in the United States, polls and surveys and dubious statistics are in the air, so let’s talk numbers.
Author Demographics
Ten issues ago, Ron Peterson wrote about diversity as it relates to both authors and editors of the Code4Lib Journal (http://journal.code4lib.org/articles/9345), and he checked in again with the editorial for issue 33 (http://journal.code4lib.org/articles/11859). To attempt to get more accurate numbers about our authors, as of issue 35 we are now asking prospective authors to fill out a brief demographic survey. It is not required, but we would like to find out more about their institutional affiliation, gender identification and geographic location. We aren’t yet sure what we are going to do with this data; we just want to catch these numbers before they slip away.
1,382,173
That is the number of hits recorded by Google Analytics since the Code4Lib Journal opened its doors in December 2007 (through Oct 1 of 2016). I think all of us who work with web analytics take these numbers with a grain of salt, but they’re still fun to look at. So, I thought I’d run through some of the reports, and highlight things that struck me as interesting.
#1
Of course, everyone who has published an article in the Journal wants to know–who is the most popular author? The answer is clear: Andrew H. Bullen, for “Bringing Sheet Music to Life: My Experiences with OMR” (Issue 3, http://journal.code4lib.org/articles/84). Although Graham McCarthy and Sally Wilson might make a case for “ISBN and QR Barcode Scanning Mobile App for Libraries,” (Issue 13, http://journal.code4lib.org/articles/5014) since they had more unique pageviews, less time on the web, and further the average reader spent almost three minutes longer on their article. And any authors who have published more than once in the journal might want to add up their pageviews to see if they can rise above 27,071 and wrest away the crown.
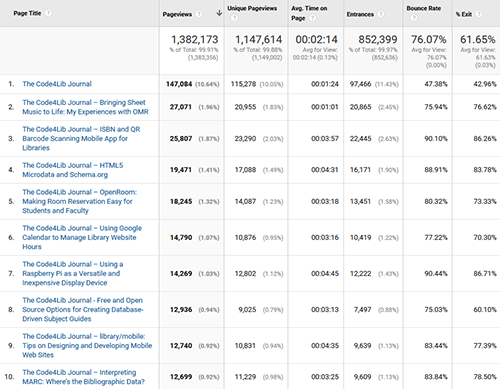
Figure 1. Top hits click to enlarge
#5
If I may raise my own oversized foam finger, I will note that an article I wrote way back in Issue 2 takes the fifth spot. I mention this because first, well, hey, #5! But also because every time I am reminded of this article, I’m also reminded that the information in there is completely obsolete. The Google Calendar API has moved along, the code won’t work anymore, and it seems like there should be a “do not read” banner at the top. I’m not sure how many other C4LJ articles suffer a similar malady, or what the solution is except caveat lector. But I think it’s easier to ignore that old timey copy of Windows 95 sitting in your office than a Google result that appears to be exactly on topic and with the Code4Lib imprimatur. And as for the proposed “do not read” banner–we are generally unwilling to modify an article after it is published, even though we are occasionally asked to do so.
I also think it’s interesting that the phrase “library hours” returns 100 hits on the old Listserv archives (https://listserv.nd.edu/cgi-bin/wa?A0=CODE4LIB) as well as a red message that reads “Your search produced too many hits and the query was aborted. Please narrow your search phrase and try again.” It seems that there are some problems for which there is still no perfect solution, and an easy way of managing library hours–perhaps across multiple branches, collections and service points–is one of them.
Referrals
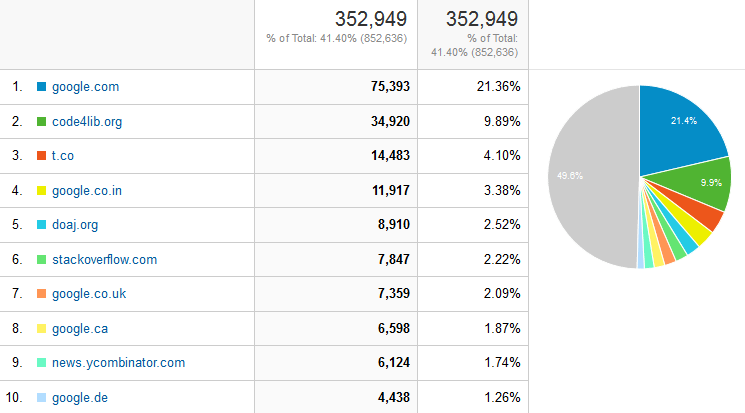
The referrals graph doesn’t hold a lot of surprises–our biggest referrer is Google, but it appears our articles are getting passed around on Twitter (t.co) and found via the Directory of Open Access Journals (doaj.org). We also are the answer to some questions on Stack Overflow.
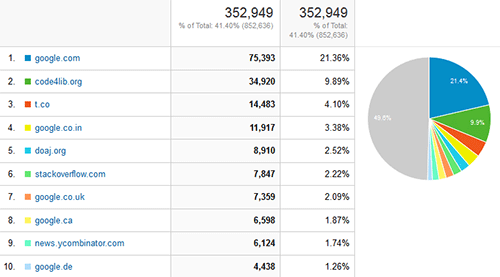
Figure 2. Top referrers click to enlarge
Social Network
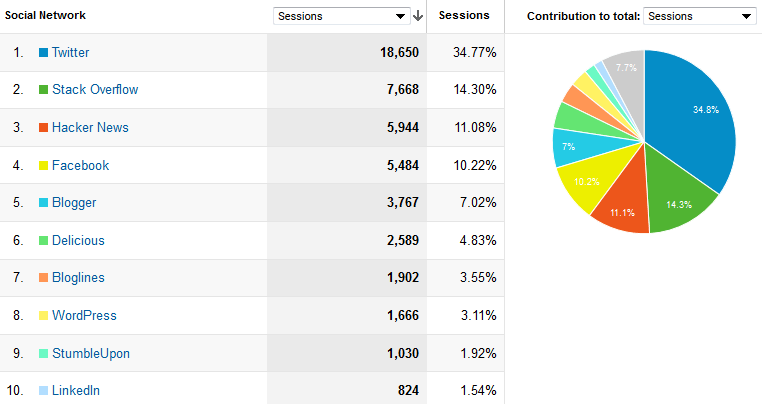
Twitter, as noted, is our top social network referrer, followed by Stack Overflow and . . . Hacker News? The once-popular Delicious also makes the cut, which is a reminder that our data stretch back almost a decade, a long time for the Internet.

Figure 3. Social networks click to enlarge
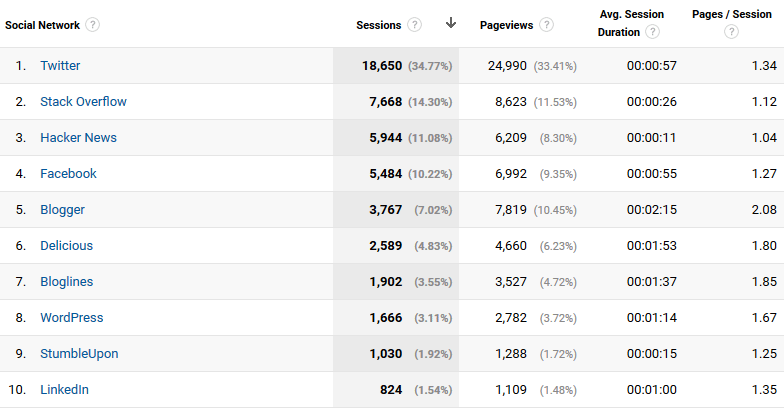
If we look at some more data, it turns out that our visitors from Hacker News didn’t know what they were in for when they clicked that link; their average session duration was only 11 seconds. Our friends from Blogger were more resolute, staying on average over two minutes.
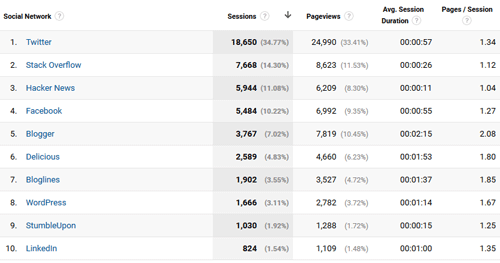
Figure 4. Social networks (again) click to enlarge
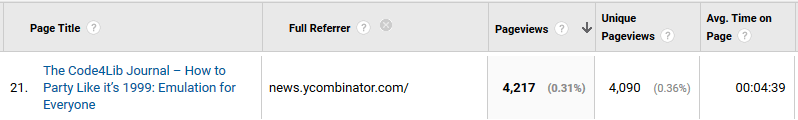
But maybe those Hacker News readers aren’t so fickle; if we drill down and see what brought them to the Journal, over two-thirds (by pageviews) of visitors were lured in by Dianne Dietrich et al‘s “How to Party Like it’s 1999: Emulation for Everyone” (Issue 32, http://journal.code4lib.org/articles/11386) from earlier this year. And they appear to have been engaged readers, since they stayed an average four and a half minutes.
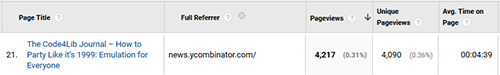
Figure 5. Hacker News referrer click to enlarge
More Interesting Nuggets
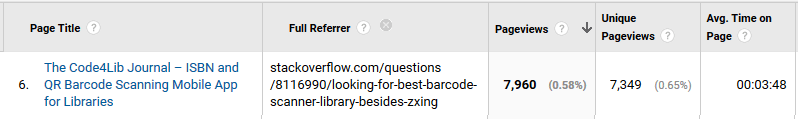
This list of “Page Title by Full Referrer” reveals some other interesting things. Our Stack Overflow readers were overwhelmingly coming to see a single article: “ISBN and QR Barcode Scanning Mobile App for Libraries.”
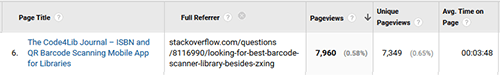
Figure 6. Stack Overflow referrer click to enlarge
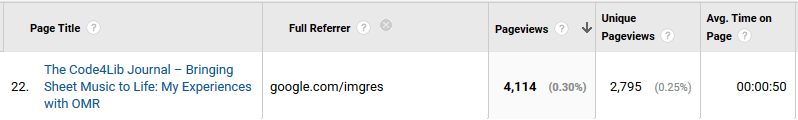
It is also interesting to note that many referrals for our #1 article, “Bringing Sheet Music to Life: My Experiences with OMR,” come from Google’s image search (google.com/imgres, which now is found at google.com/imghp).

Figure 7. Google Image Search referrer click to enlarge
A search for just “sheet music” doesn’t turn up a result from this article anywhere near the top, but try “digitized sheet music” on the other hand and it is the sixth result (for me, on this day). Since the caption for one image in the article includes “digitized sheet music,” I guess this speaks to the value of giving your images good descriptive captions. Since the average time is 50 seconds, it seems that some of the people who just came for a good picture of some digitized sheet music stayed to find out more about “the process of digitizing sheet music celebrating Pullman porters and rail travel from the 1870s-1920s.” Good for them.
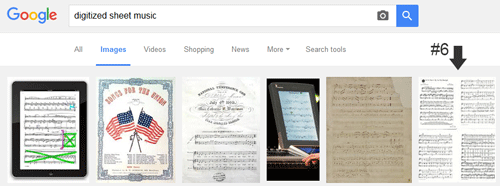
Figure 8. Google Image Search for “digitized sheet music” click to enlarge
Readers
As one might expect, the majority of our readers are accessing Journal articles from computers in the United States.
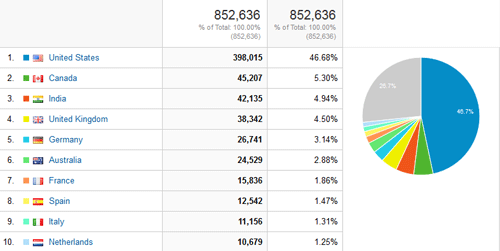
Figure 9. Geographic location click to enlarge
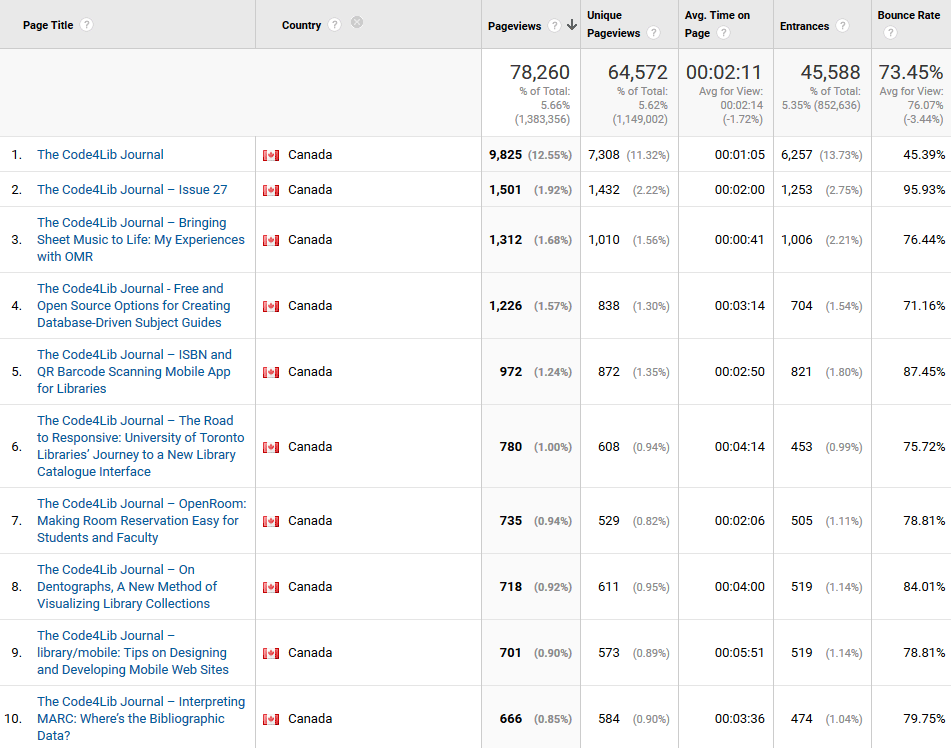
And the top article for Canadians? “Bringing Sheet Music to Life” once again, although they do express some national pride by reading “ISBN and QR Barcode Scanning Mobile App for Libraries” (from Ryerson University in Toronto), Lisa Gayhart et al’s “The Road to Responsive: University of Toronto Libraries’ Journey to a New Library Catalogue Interface” (Issue 23, http://journal.code4lib.org/articles/9195) and “On Dentographs, A New Method of Visualizing Library Collections” (Issue 16, http://journal.code4lib.org/articles/6300) from York University librarian William Denton.
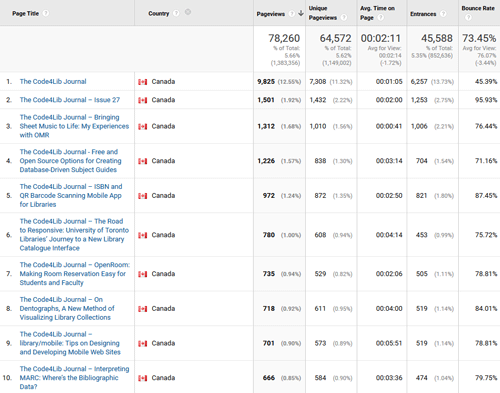
Figure 10. Top hits, Canada click to enlarge
The top articles for Indian readers is quite different. And if I may raise my foam finger once again, it appears they like that Google Calendar article so much it appears twice! (Remember what I said about a grain of salt?)
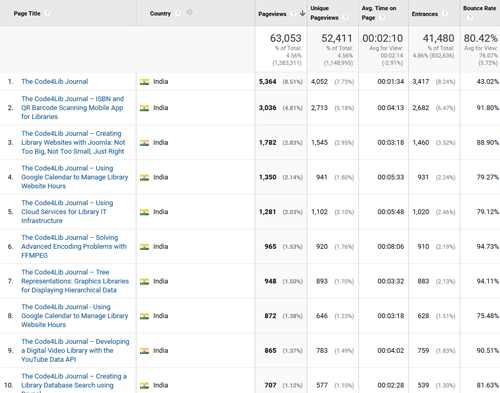
Figure 11. Top hits, India click to enlarge
Rounding out our top ten we have:
- United Kingdom — “Bringing Sheet Music to Life: My Experiences with OMR” see top 10
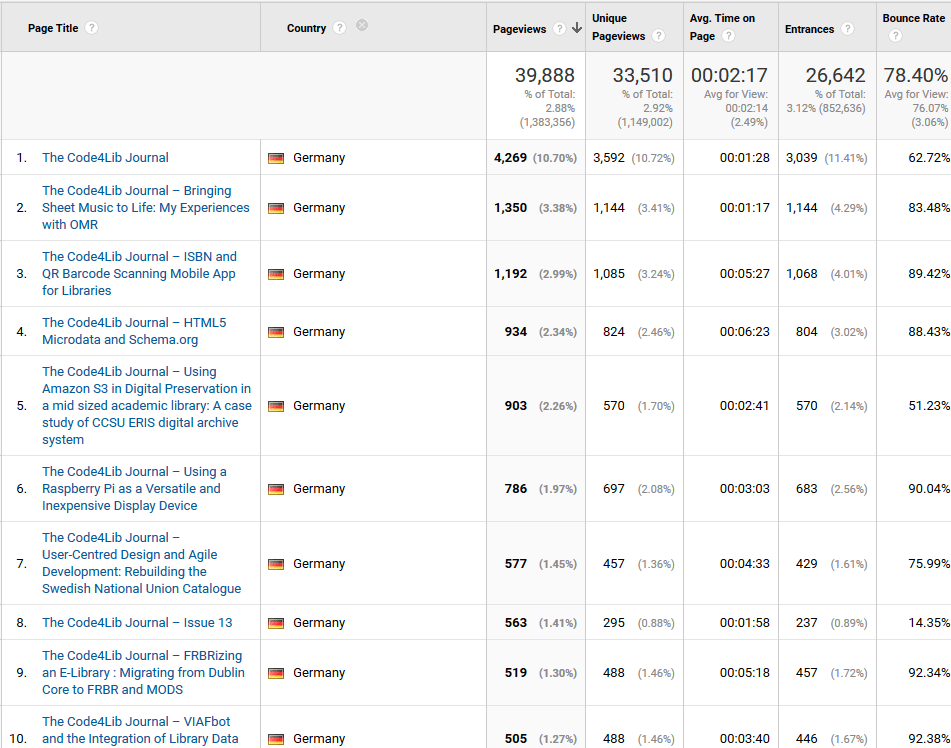
- Germany — “Bringing Sheet Music to Life: My Experiences with OMR” see top 10
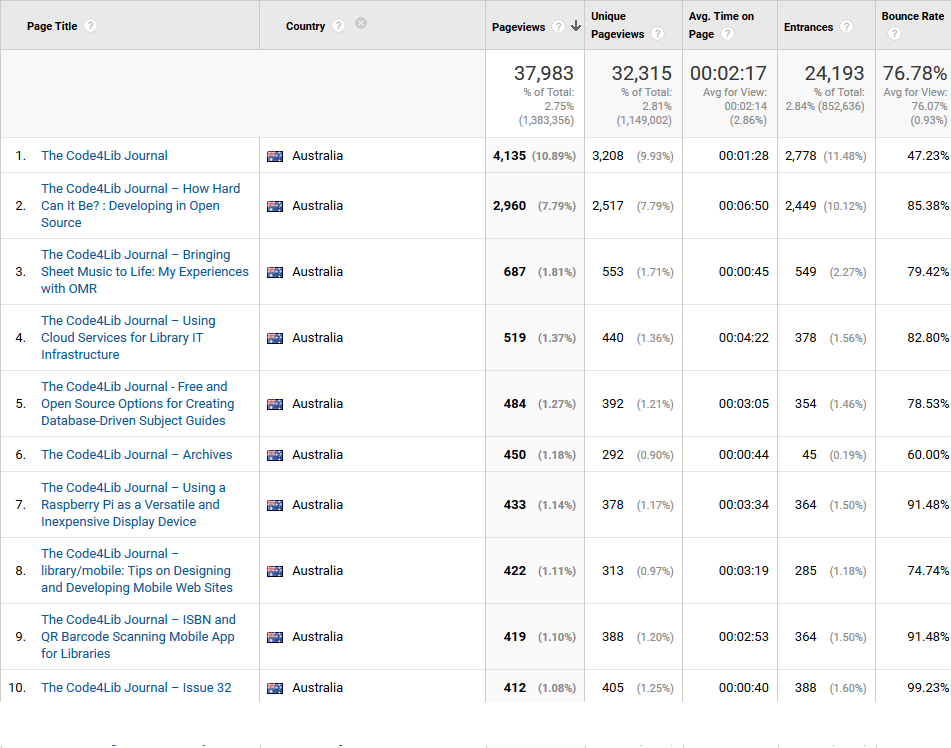
- Australia — “How Hard Can It Be? : Developing in Open Source” by Joanne Ransom et al (Issue 7, http://journal.code4lib.org/articles/1638) see top 10
- France — “HTML5 Microdata and Schema.org” by Jason Ronallo (Issue 16, http://journal.code4lib.org/articles/6400) see top 10
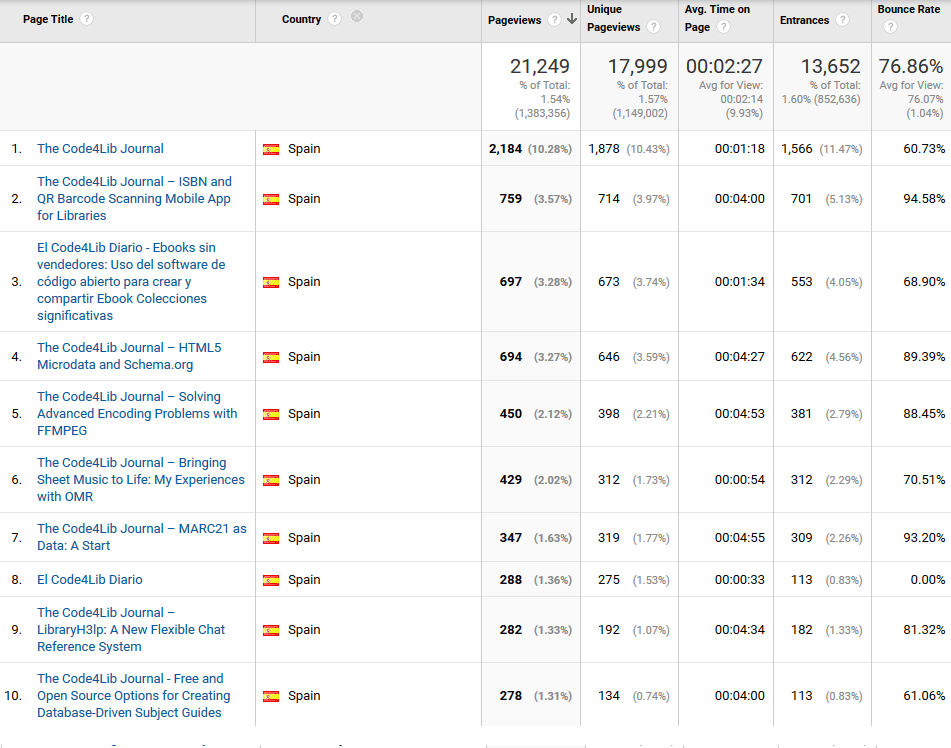
- Spain — “ISBN and QR Barcode Scanning Mobile App for Libraries” see top 10
- Italy — “Bringing Sheet Music to Life: My Experiences with OMR” see top 10
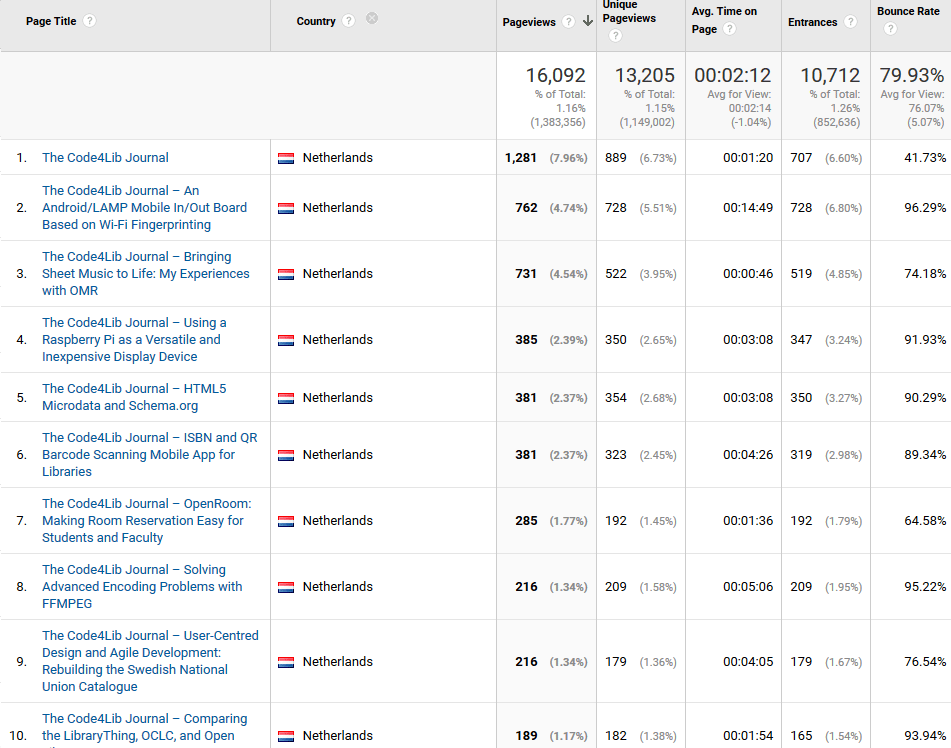
- Netherlands — “An Android/LAMP Mobile In/Out Board Based on Wi-Fi Fingerprinting” by Keith Kelly et al (Issue 15, http://journal.code4lib.org/articles/5859) see top 10
Finally, as a bonus, “Controlled Terms or Free Terms? A JavaScript Library to Utilize Subject Headings and Thesauri on the Web” by Shun Nagaya et al (Issue 15, http://journal.code4lib.org/articles/5994) is big in Japan.

Subscribe to comments: For this article | For all articles
Leave a Reply