by Casey Gibbs, Marcos Hernandez, Pongracz Sennyey
http://ir.stedwards.edu
At the Saint Edward’s University[1] library, we have implemented a simple, modular, inexpensive, and effective model for providing digital services in a resource constrained environment. Until about two years ago the library did not offer Institutional Repository or digital data management services, and given the lack of demand from the campus, we were skeptical about its need. In 2014, however, the new Dean of Natural Sciences approached the library to request support for making his atmospheric research data more easily managed and shared on the internet. To accommodate this request, the library assembled a set of digital data management tools connected via APIs that enable us to provide an expanding portfolio of services without locking ourselves into complex vertically integrated platforms. This model has arbitrary storage, presentation layers, data modelling and network connections. In this paper we will describe our implementation process and discuss our distributed model for data management services.
The evolution of the concept: Figshare implementation
At first we selected Figshare[2] as our foundational stack, and built the data management services around it. We selected Figshare for a set of appealing characteristics: it is a cloud product, thus lessening its demands on local resources; it has a powerful set of APIs, which appealed to our need to address multiple very different types of projects; it offers full functionality directly to end users without library staff intervention, and it purported to be simple to configure, simple to use, and flexible in terms of metadata, file formats, and storage quotas.
Once selected, the Figshare implementation team was great to work with and it did not take long to get the basic framework set up to our specifications. But Figshare offers very restricted options for branding the front-end and for user interface design. We needed a much more flexible UI with more embedded functionality and interactivity, but Figshare did not offer those features out of the box. Instead, it allowed us to design our own dedicated website connected to Figshare via APIs. Having done so we asked ourselves whether it would be possible to fold in other API connected services as well.
The Dean’s atmospheric data project was a good test case for our new model. His project consists of collecting data from an ongoing series of weather balloon launches. For each launch, a raw data file is produced, and from that data several static data visualization files are generated. His data archive was originally hosted in a complex, static website that he manually updated multiple times per year[3].

Fig 1: Original site. This page lists the launches and links to its datafiles and graphs.
The service request was for us to simply replicate the project’s original website. In the planning phase, however, we uncovered two manual processes we could automate by migrating his data into Figshare:
- data from each weather balloon launch had to be uploaded manually. With Figshare, we use API calls to automate uploads from the Dean’s computer to his Figshare account,
- for each launch, the website had to be edited manually. Figshare’s API makes it possible to dynamically render our front end by querying the Dean’s Figshare account, thus eliminating manual edits. See figure 2 for the Javascript queries we use to render the links and the menu structure in our interface:
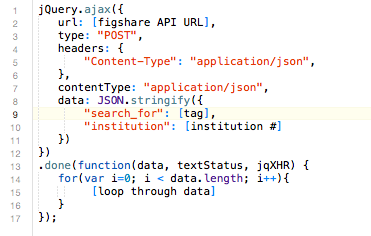
Fig 2. Javascript/jQuery call to Figshare API. A for loop is used to parse the returned data.
Next we were able to further extend the Dean’s original project by supplementing its static, file-based .pdf and .jpg visualizations with dynamic SVG plots generated and displayed upon page load. In order to do this for a given launch, first we use Javascript to parse the raw data file.

Fig 3: Raw data is parsed into Javascript objects to be rendered in D3.js.
The next step is to use the D3.js library (a JavaScript library for producing dynamic, interactive data visualizations in web browsers – see https://d3js.org) to generate visualizations.
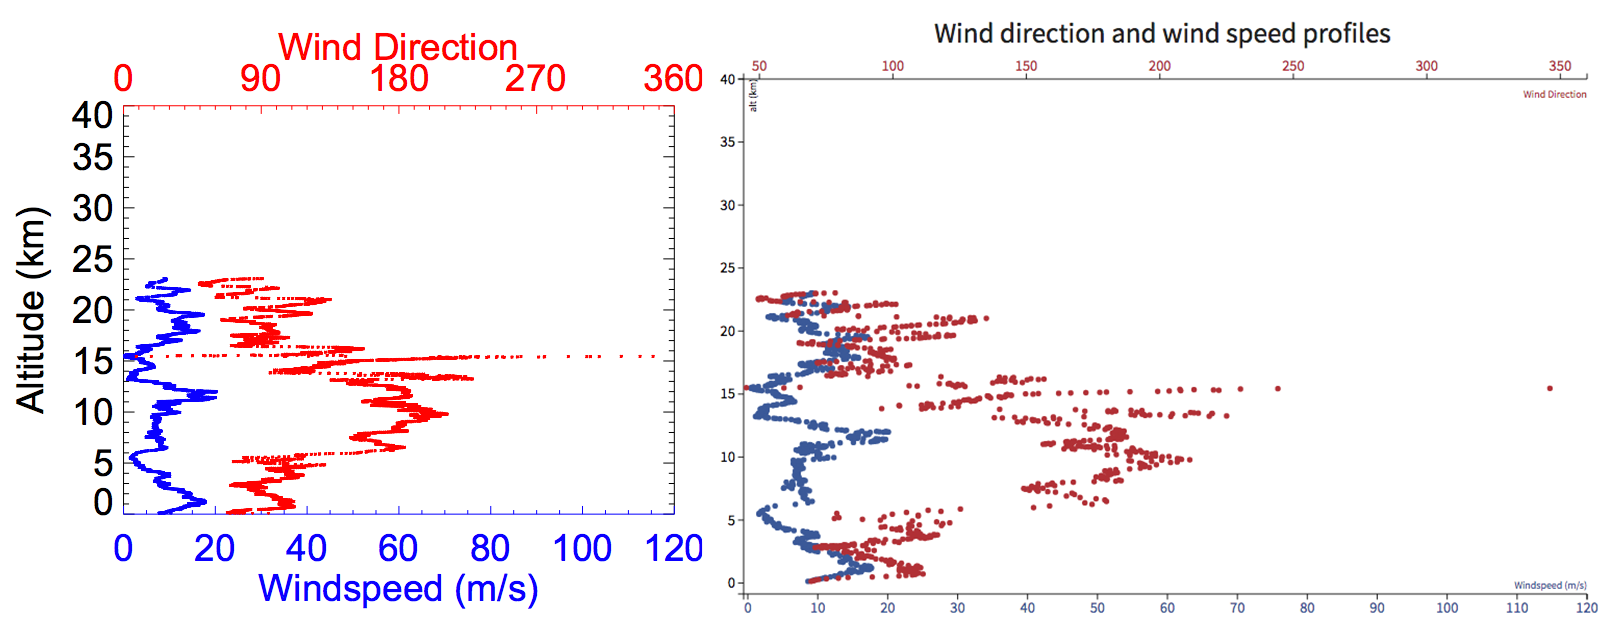
Figure 4: Left: Pdf of Wind direction data created by custom software. Right: The same data dynamically generated by D3 in the browser.
Similarly, we were able to use the original .kml file for each launch with a call to Google Maps’ API and dynamically generate an interactive map of each launch, rather than using a static image of a map.
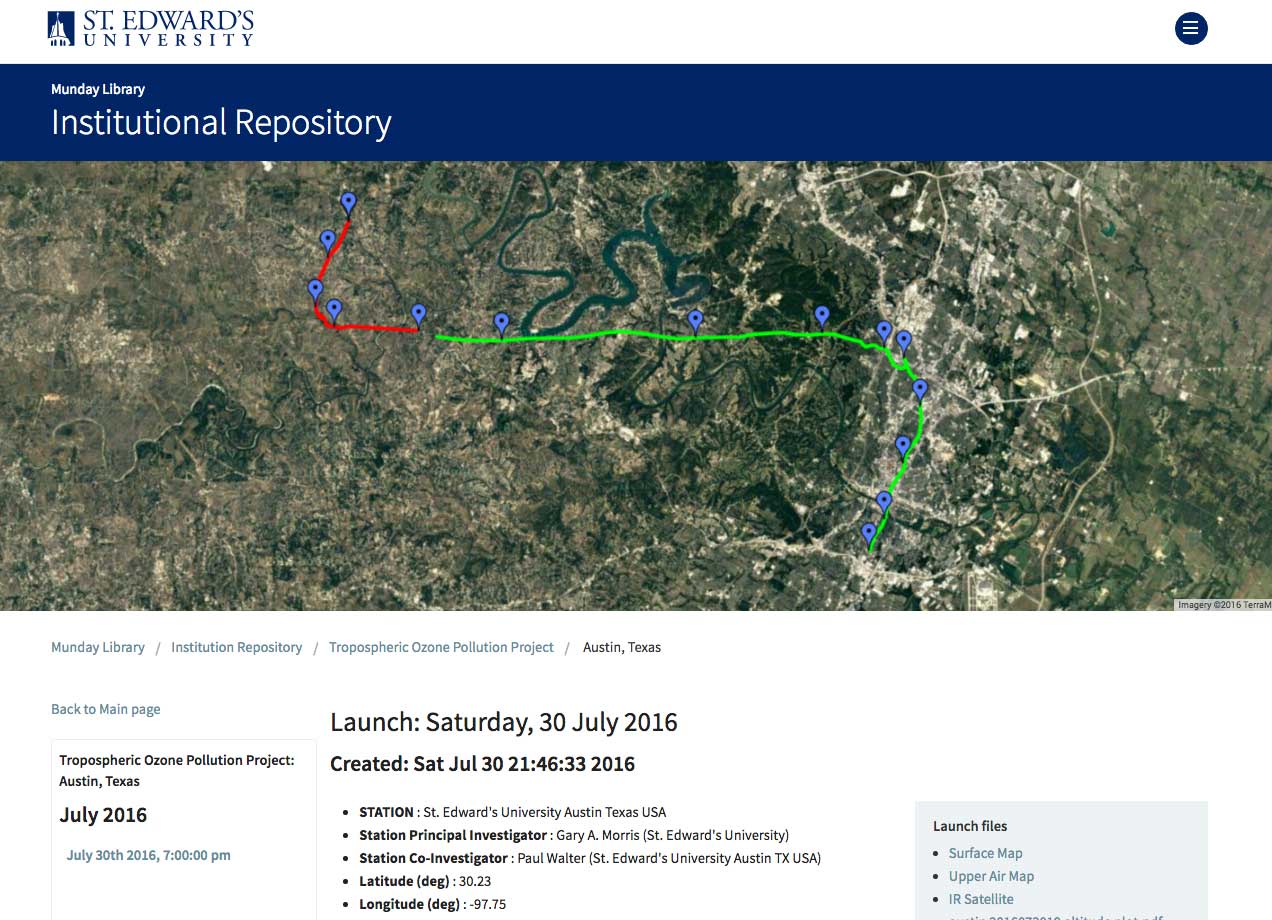
Fig 5. New site: displays Google map generated from the .kml
Though these dynamic renders marginally increase page load time, we accrued several substantial benefits over the previous model:
- Identical visualizations are now rendered for all launches.
- Edits to the visualizations can now be made without re-rendering previous launches.
- Our new visualizations now provide interactivity, such as the ability to mouse over individual data points to get their numeric values.
- We are now able to display visualizations that were not possible before, e.g., the same data points visualized across several launches.
Lessons Learned
Our API based system solved a number of problems and made for a simpler site for our users. But Figshare’s architecture is optimized for end users with stable content. As it happens the Dean’s project is actually not a perfect fit for Figshare’s contraints. Learning to use Figshare’s API made us aware that we could match future projects with other API enabled platforms as needed.
We have subsequently built projects on S3[4], WordPress[5], Flickr[6] and Omeka. We are able to take advantage of the strengths of these platforms while still consolidating access to their content in our custom front end[7]. The result is a series of projects built upon a platform agnostic architecture – a distributed model – that retains a clean branded interface. Our modular system allows the library to incorporate new technologies to meet our clients’ disparate needs.
The distributed model has proven to be:
- Lightweight and modular: our system consists of an interchangeable set of cloud-based SaaS platforms. Each performs one or more specific functions (such as storage, APIs, data visualization, metrics, etc.), resulting in an adaptable and modular architecture. These modules are made available through a simple, custom-built, HTML front-end. We are not restricted to any one product, we have no vendor lock-in, and we can easily replace one module with another by migrating our data and updating our API calls. For example we could easily replace Amazon S3 with Google’s Cloud Storage.
- Low maintenance: Our only upkeep involves monitoring current systems for API changes.
- Simple for the user: Although any number of systems may be in use at a given time, the end user’s only access point is our own website.
- Simple to develop: As systems evolve and innovative new products become available, bringing them into our architecture will be a matter of learning their APIs. For example, project-specific metadata functionality could be added anywhere in our stack (on our server, or on a cloud-based database engine) without the need to worry about extending current systems by, e.g., developing plugins. Custom code (such as visualizations, playback controls, and analytics) can be written for the server or the front-end.
- End-user access: Our use of Figshare makes it possible for end users to publish work and have it automatically appear on the website, with the library administering issues such as storage quotas and access privileges. This means that users can deposit materials with no intervention from the staff, and subsequently make versioned edits. While Figshare provides end user access very well, our modular architecture allows alternative solutions if deemed preferable.
- Easier to navigate: Having a front end that is automatically populated with our content means less editing and fewer errors. Maintaining our own entirely custom front-end also means we can use common interface conventions across our web properties.
We have found the distributed model to suit our needs well. These include class projects that involve faculty-student collaborations, Special Collections projects initiated from the library itself, and more traditional IR functions such as the storage of documents, e.g., yearbooks, campus publications and assorted manuscripts.
Challenges ahead:
The rollout and implementation of this service has raised a number of challenges which we have confronted along the way, and a few we see on the horizon. Among them the most important are:
Although we recognize that metadata is a critical aspect of data management services, we have not yet addressed it systematically. Instead we have created ad hoc solutions to each of our projects. For example in the atmospheric data project we are relying on file-level metadata as well as simple collection-level metadata functionality provided by Figshare. Conversely an on-going photo collection project (http://ir.stedwards.edu/natural-sciences/camera) relies on file-level metadata alone. Although we aim to implement, or develop, a metadata application, the challenge is that it should be compatible with our distributed, modular, architecture. We have not yet found an ideal solution.
Similarly to the challenge presented by metadata, we have not yet systematically addressed the issues related to trustworthy long-term preservation of digital content. However, we consider it an administrative challenge, that includes protocols for managing the life cycle of digital materials, dedicating staffing and materials resources etc., more than a technical one, for which our infrastructure is well equipped to accommodate evolving practices in this area.
Identity management has been a recurring bureaucratic challenge, inasmuch as it has required us to synchronize efforts with other units on campus (IT) that are operating on a different set of priorities and timeframes. Implementing identity management tools, however, is an often requested feature of collaborative projects. For example, the campus IT department already provides instances of managed web applications, such as WordPress, that are preconfigured with single sign on for campus accounts. Assisting our clients with instances on those platforms is simple, but developing instances of our own custom applications requires us to work with IT to use their single sign-on server. The problem is compounded by the fact that we must address this with every such application we develop. Since we do not run our own SSO server, this remains an unsolved bureaucratic challenge.
Conclusions:
In retrospect, it is striking how much our previous experience with integrated systems limited our thinking about the services we can provide. By adopting a platform agnostic architecture we are able to customize our toolset for each project. As a result, no one platform is a limiting factor, and we can prioritize the needs of our patrons. In effect, data services is not built on one platform, such as Figshare, but rather a series of platforms, which are transparent to the patron, but embedded in a common front end.
In our experience digital scholarship is evolving rapidly. Once data is digital and online, scholars develop new modes of inquiry, new questions and new methodologies. To keep pace with these innovations, service providers must be able to iterate and experiment nimbly. We have come to the conclusion that no one monolithic platform can satisfy the evolving requirements of the landscape of digital scholarship. The resulting complexity and cost of such a system would be prohibitive.
While there is much more to be done, and as the University community discovers its potential, demand is starting to increase. This new model solves a number of challenges that were previously beyond our reach, and has opened the way for the creation of a new library service that supports both research and pedagogical innovations at St. Edward’s University.
References
[1] Saint Edward’s is a Liberal Arts institution with about 5,500 students, located in Austin, Texas.
[2] Figshare’s homepage at https://figshare.com/, the Saint Edward’s instance can be found at https://stedwards.figshare.com/
[3] See http://physics.valpo.edu/ozone/
[4] http://ir.stedwards.edu/natural-sciences/camera
[5] http://sites.stedwards.edu/wereyouthere/
[6] https://www.flickr.com/photos/135420022@N04/sets/72157660077085270
[7] http://ir.stedwards.edu/
Authors:
Casey Gibbs: Library Digital Projects Manager at Saint Edwards University, Austin Texas. (rgibbs@stedwards.edu)
Marcos Hernandez: Library Front End Designer at Saint Edwards University, Austin Texas.(mherna14@stedwards.edu)
Pongracz Sennyey: Library Director at Saint Edwards University, Austin Texas. (pongracz@stedwards.edu)

Subscribe to comments: For this article | For all articles
Leave a Reply