by Eike T. Spielberg
The Problem
The increasing competition between universities and researchers with respect to funding has given rise to a huge demand to evaluate the output of scientists or groups of scientists. The scientific “productivity” of researchers is an especially important question and is usually measured by the scientific publications of a given author. The scientific field dealing with the statistical analysis of scientific publications, bibliometrics, offers a broad range of measures and metrics to quantify scientific output and to qualify the “impact” the publication has on the scientific community.[1]
The use of bibliometric indicators, such as the impact factor for journals, h-Index for authors, or just the number of received citations for a single paper are well established and widely used in the natural sciences, although several tripping wires exist.[2][3] Although the applicability can be questioned in many cases and several effects (like kilo-papers with several hundreds of authors) strongly distort the findings of the analyses, they are often used to gain some insights into the complex scientific landscape. As more and more tools arise which allow an easy and automated ad-hoc analysis (Scival, InCites), even with hardly any knowledge about bibliometrics, there is a great risk that the number is seen as the final result. However, bibliometric reports should not answer questions, but rather open up questions and discussions. To prevent their misuse, several libraries take the opportunity to establish consulting services about metrics and their limitations. Going even further, they can also offer to prepare bibliometric reports, paying attention to openly acknowledge the limitations and prevent over-interpretation of the data.
The elementary prerequisite is a database listing all the publications and linking them to the referenced publications. Such databases exist for specific subject fields (e.g., IEEE Xplore [4]) but for the general audience only two major databases exist: Web of Science [5] and Scopus [6]. In addition, Google scholar [7] offers the possibility to analyse the references and yields a similar functionality. However, as the coverage is not clearly defined, analyses from Google Scholar still suffers from some methodological uncertainties.[8]
Problems also arise when preparing analyses for scientists with the interdisciplinary databases . In principle two major problems must be faced:
- The coverage of citation and bibliographic databases
- The attribution of authors
Let us have a more detailed look at these two problems:
Coverage
Scopus and Web of Science cover mainly journal articles, reviews, and a growing number of conference proceedings and book chapters. However, their coverage is far from complete. While sometimes patents, books, and research data are also incorporated, there are a number of very subject-specific ways to communicate research, which are not included: presentations, video-uploads, blogs, etc. This affects not only the coverage of publications themselves, but also their citation in other media (e.g. html links). This problem has been recognized and a number of so-called altmetrics are trying to address these tasks.[9]
Especially in the case of partial coverage, bibliometric analyses give reasonable looking results, but can be strongly distorted. In such cases the reports need a strong warning from a specialist putting the report in context.
Attribution of publications
When evaluating a certain institute, faculty, university or other groups of scientists, publications are usually collected by the name of the scientists and their affiliation. The author’s affiliations in a publication can give rise to a number of errors. The author might have given an incorrect address, might have given only his institute, but not the university, there might be spelling errors, errors upon transmission of data from the publisher to the database provider and so on. Cleaning all these entries is tedious work and it can take quite a long time until corrections are incorporated into the citation database.
To circumvent these two problems, we followed another approach, namely to use the in-house University Bibliography [10] as a source and to only enrich the entries found in there with the necessary additional information such as citation counts.
Our approach to solve the problem
The university asks all scientists to register their publications in the University Bibliography. The University Library offers several services that make the reporting of publication easier. Publication lists can be sent to library staff who enter or import the entries into the system. Entries from the internal bibliography of the university hospital (EVALuna Biblio) are imported as well. Also, in order to reduce the efforts for the scientists, external sources such as the Scopus database [11] are used to import new publications. And finally, the Library maintains a web frontend so that every member of the university can submit their publications.
The entries are then checked by library staff before being published in the University Bibliography. Additional metadata such as an attribution of institute and faculty via a local identifier from the campus management system is added as well. Additionally, every scientist can check his entries and report inconsistencies. As all the data is present in the local system, errors can be quickly corrected. All entries are assigned to a section and single person via the connection to the internal identity management of the University. The use of the local identifiers and the curation within the Universtity Library is well established, as the identifier is the critical link to generate publication lists on the author’s institutional homepage via predefined html code.
The bibliography is based on the open-source MyCoRe-framework [12], a framework to build institutional repositories (MyCoRe is an acronym for My Content Repository). It is Java/XML based and offers many tools to generate, retrieve from external sources (via so-called resolvers), handle, and index XML-documents. The description of contents within the XML-documents is strictly based on the Metadata Object Description Scheme (MODS) [13] defined by The Library of Congress, offering a well-defined description.
At the University Duisburg-Essen two MyCoRe-installations exist: firstly, our open-access publication server DuEPublico (Duisburg-Essen Publications online) and secondly, the University Bibliography. One of our library department heads (Frank Lützenkirchen) is one of the founders and current developers of the framework. Changes, customizations, and enhancements can be included quite easily. If any scientist needs another type of publication within the University Bibliography, it can be included.
We solve the two problems mentioned in the previous section by including new publication formats, which increases the coverage (though not of the citation data, vide infra), and by adding institutional data and/or local personal identifiers, which helps to clarify author affiliations. We select the entries relevant for our task (for example the evaluation of a scientist) from the University Bibliography and enrich them – if possible – with citation information from the citation databases. Preferably, we make use of persistent identifiers, which are included in the entries as well. By following this approach, we avoid the extensive search for name-variants in the citation databases and time-consuming cleaning of the result list (which is, in fact, double work, as the University Bibliography entries need to be checked either way). The report is then generated in an automated fashion assuring transparent calculations.
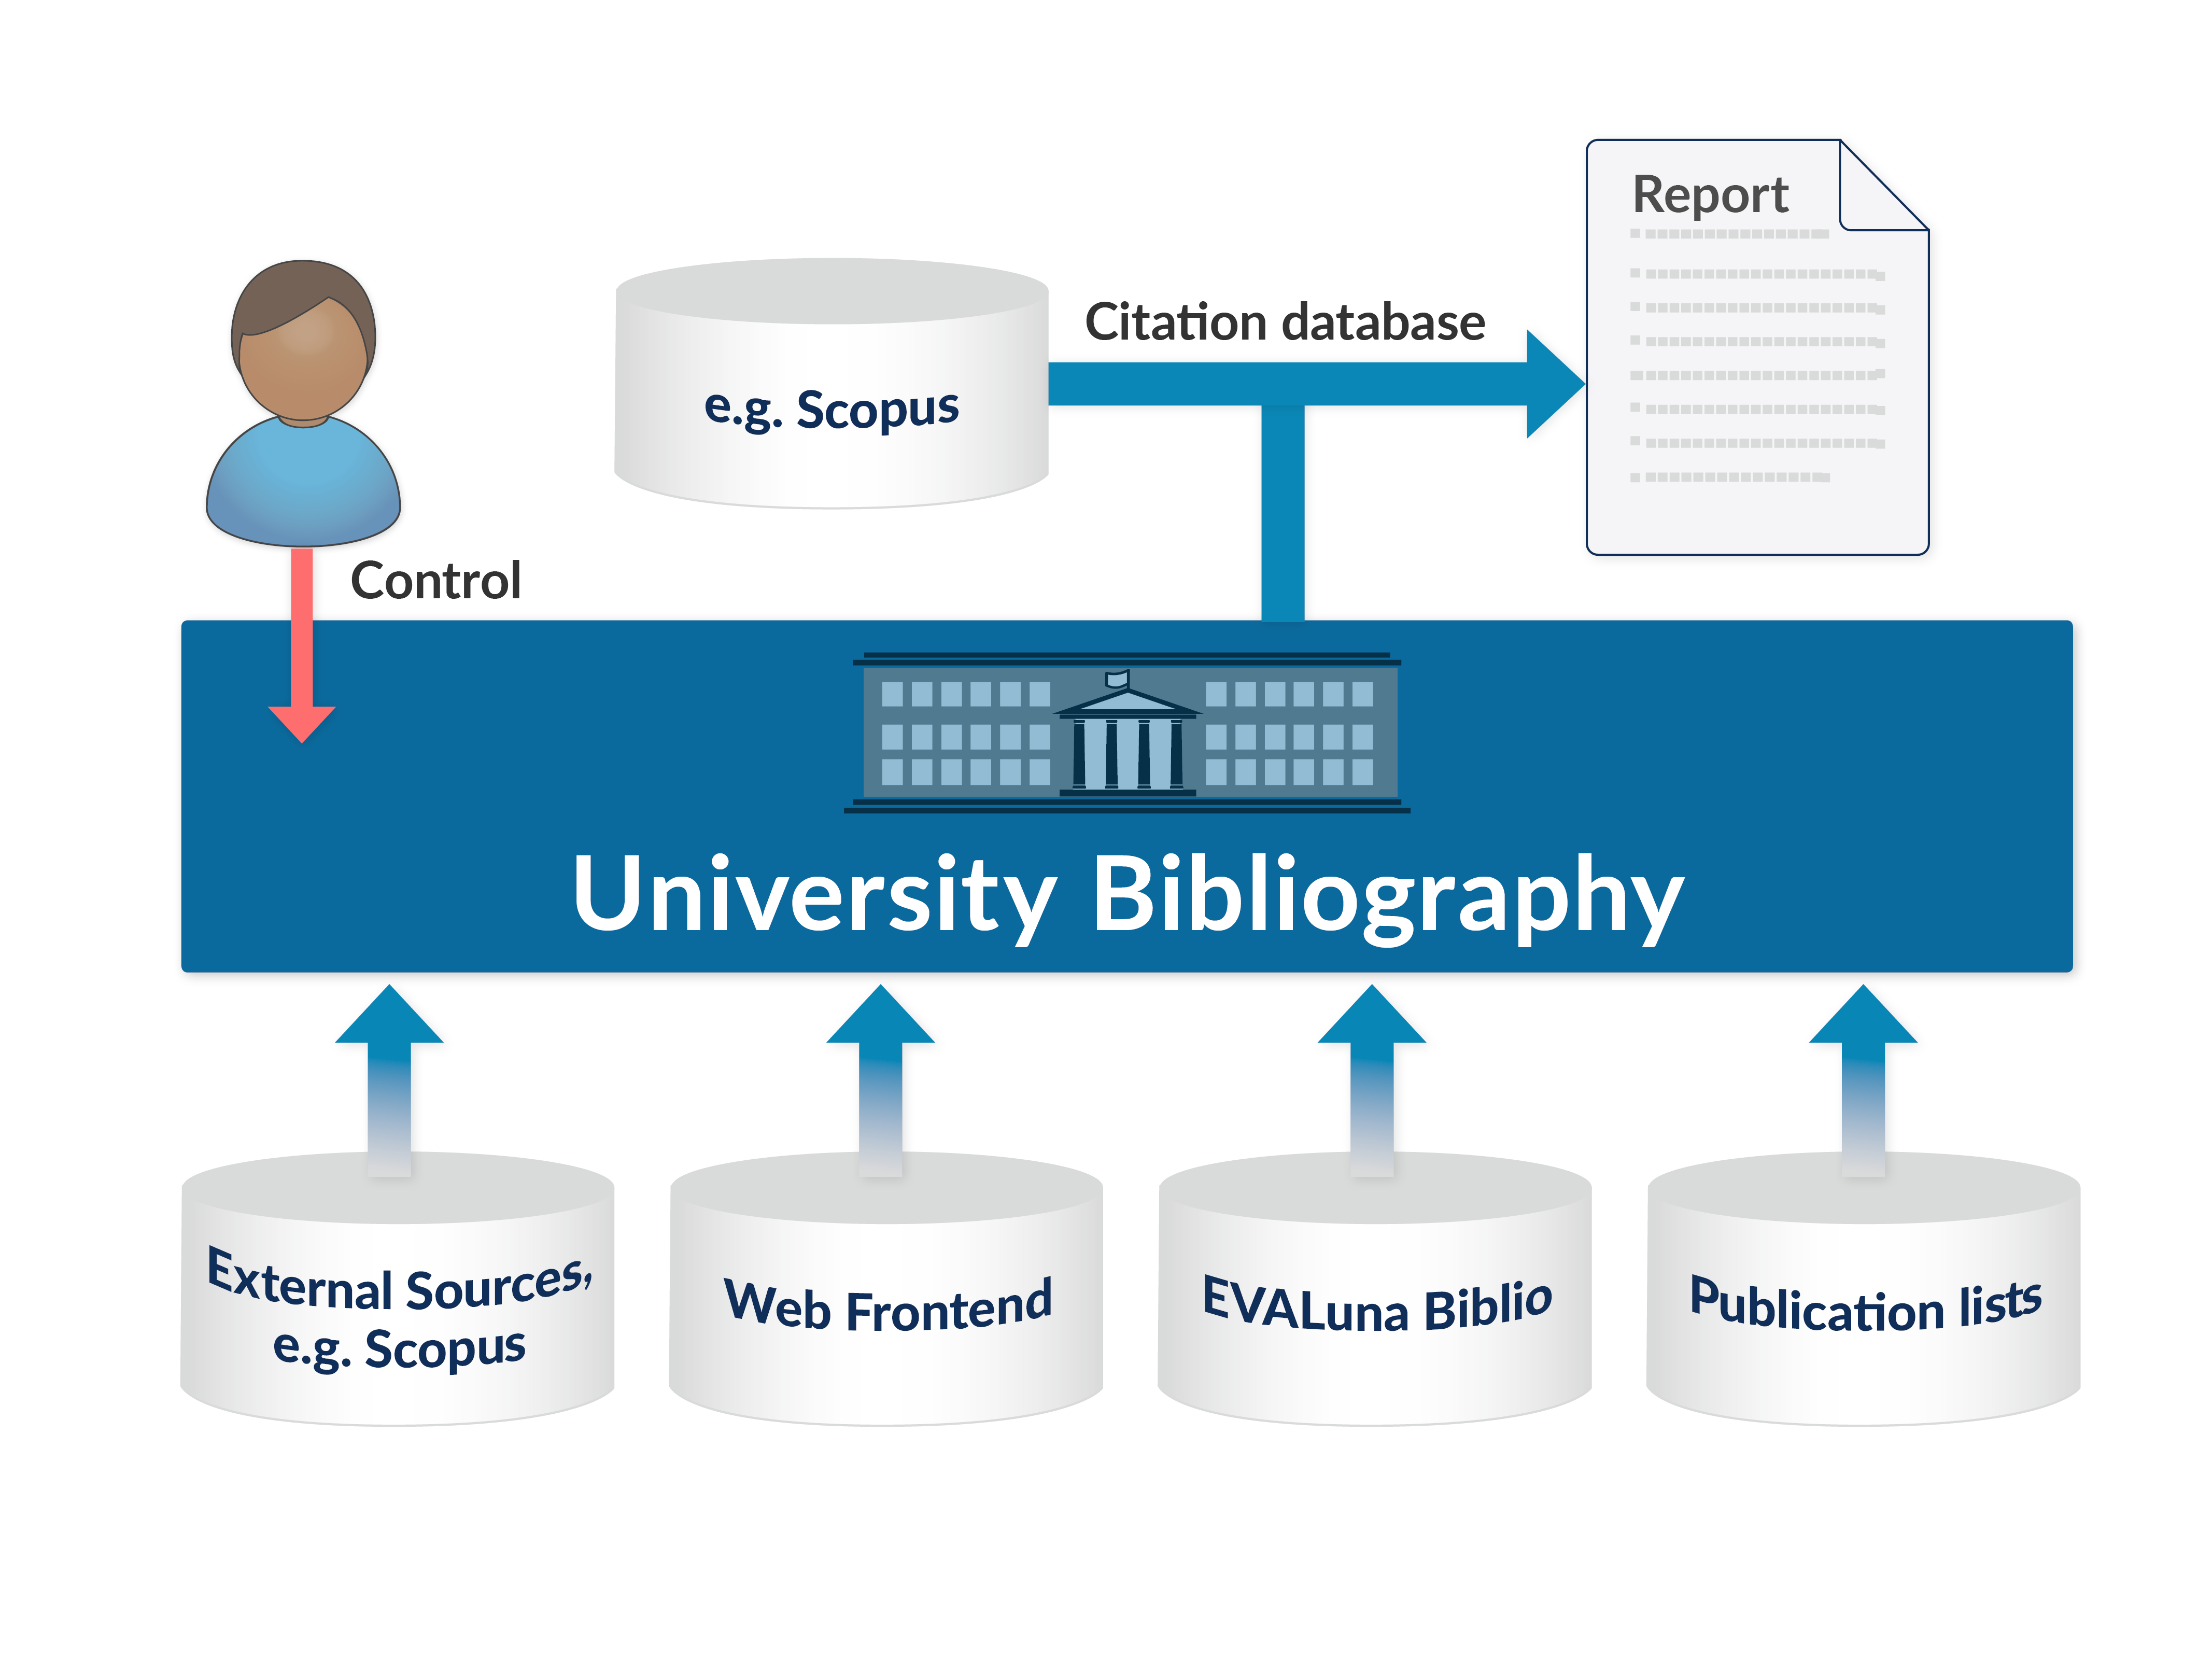
Figure 1. General Workflow for the generation of bibliometric reports from the University Bibliography. Entries can be imported from a number of sources and are controlled locally both by library staff and the scientists themselves. Upon report preparation additional citation information is added from a citation database.
Workflow steps
As depicted in Figure 2, DuEPublicA comprises a user-specific workflow. If the authenticated user belongs to the group “analyst”, a form field is displayed allowing the user to select whether to perform a citation analysis or just generate basic statistics. If the “analyst” wants to perform a citation analysis, they have to choose which citation source is to be used. Afterwards they enter a name or identifier, and run the analysis by clicking the button “Run” (see Screenshot 1). Upon submission of a name or identifier, the report is prepared as an XML document and displayed via XSL transformation as an HTML page. In addition, a button is displayed for saving the analysis and preparing the reports. The “analyst” can therefore perform the analysis and check the results. If everything is evaluated properly and all publications are found, they can finalize the report.
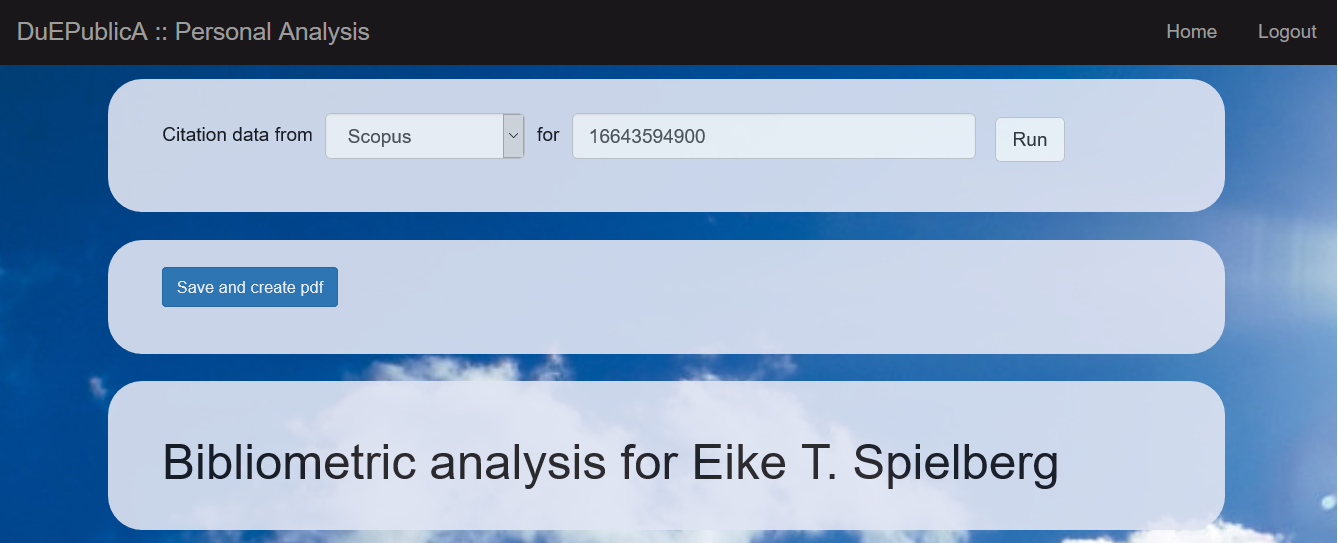
Screenshot 1. The input fields as seen by a user with the role “analyst”.
If the user is logged in with the role “guest”, they are only able to access a saved report as HTML in their web browser or to download a prepared pdf file. The submission button and the “Save and create pdf” button are not shown in the “guest” view.
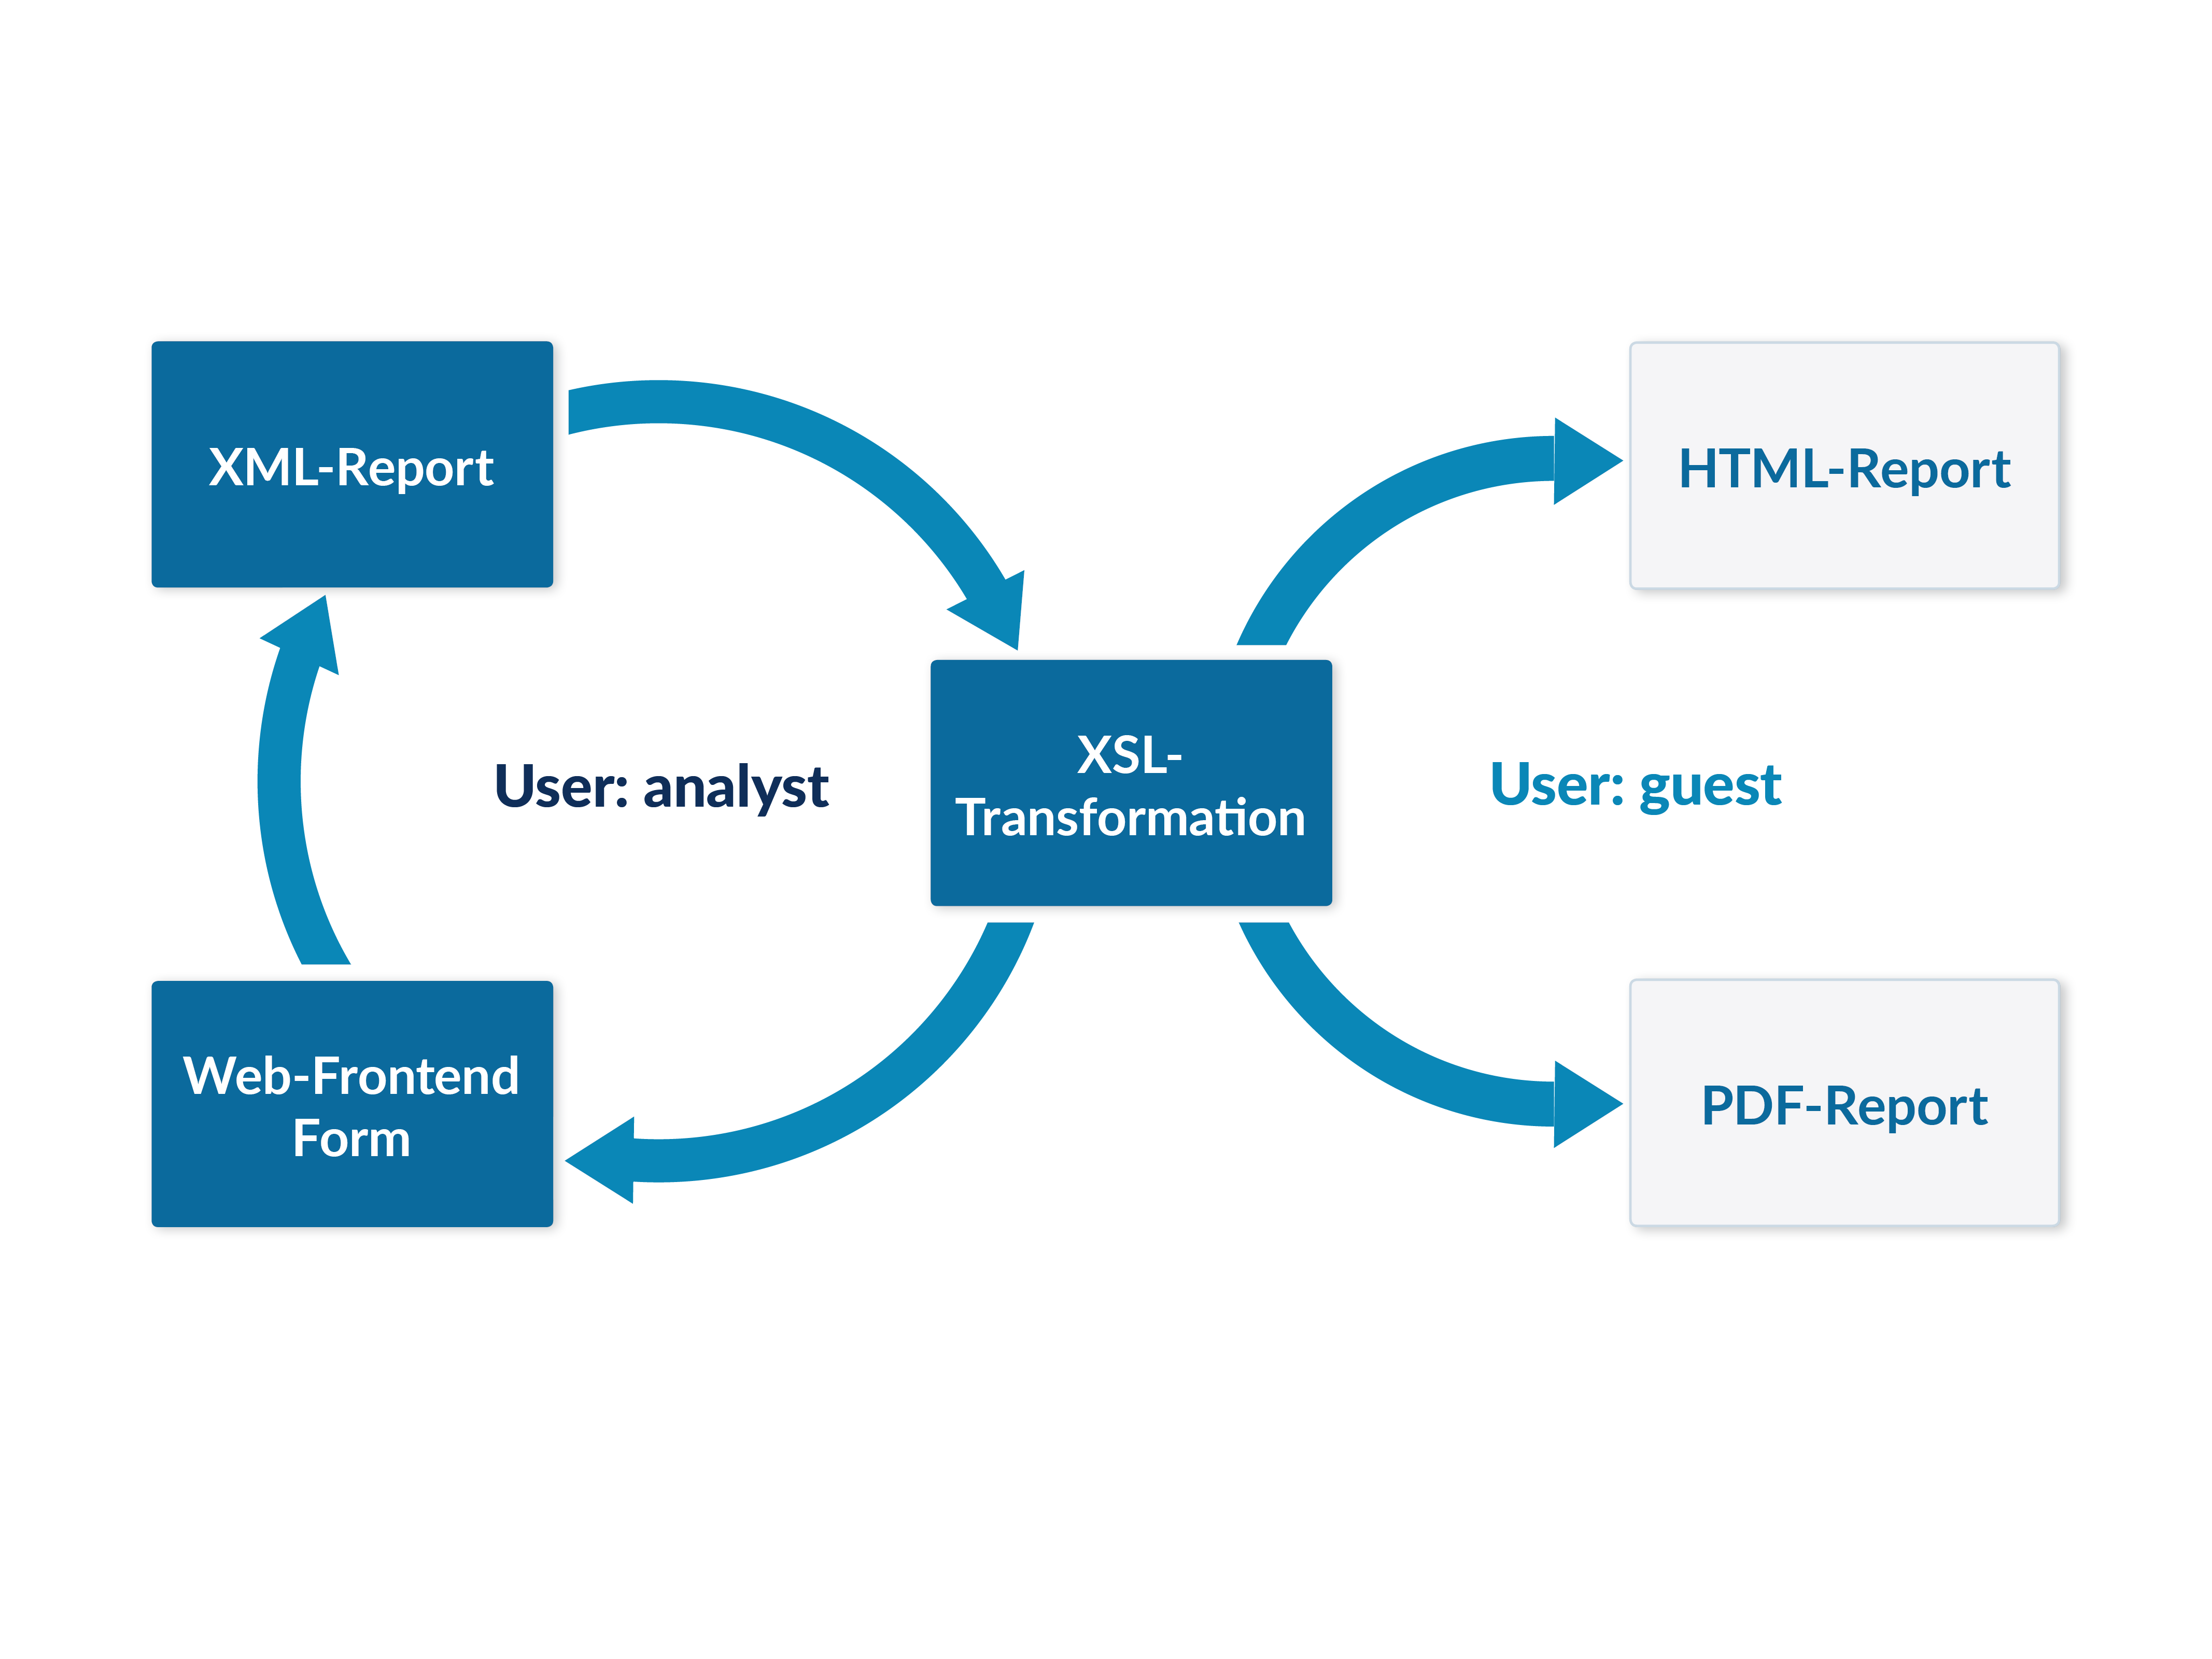
Figure 2. General workflow of DuEPublicA.
When an identifier (or name) is submitted through the input field of the Web frontend, the type of identifier is determined programmatically and the knowledgebase is queried for a corresponding entry. To determine the type of identifier, several consecutive steps are performed (see Figure 3): First of all, the program checks whether the provided input contains a “-” character. If this is the case, it can be either a name or an ORCID. Therefore, the program deletes all “-” characters and checks with regular expressions whether the remaining characters are all numbers. If yes, the input is identified as ORCID, otherwise as name.
If the provided input contained no “-“, the application checks whether all characters are numbers. Again, if this is not the case, the input is assumed to be a name. In contrast, if all characters are numbers, the input can be assumed to be an identifier. The type of identifier can be differentiated according to the length, as the local identifiers are rather short (up to five digits), the ORCID is exactly 16 digits and the Scopus Author ID is in between. If more identifiers are to be included, one would need to replace this rather simple scheme with a more sophisticated one or allow for a manual selection of the identifier type.
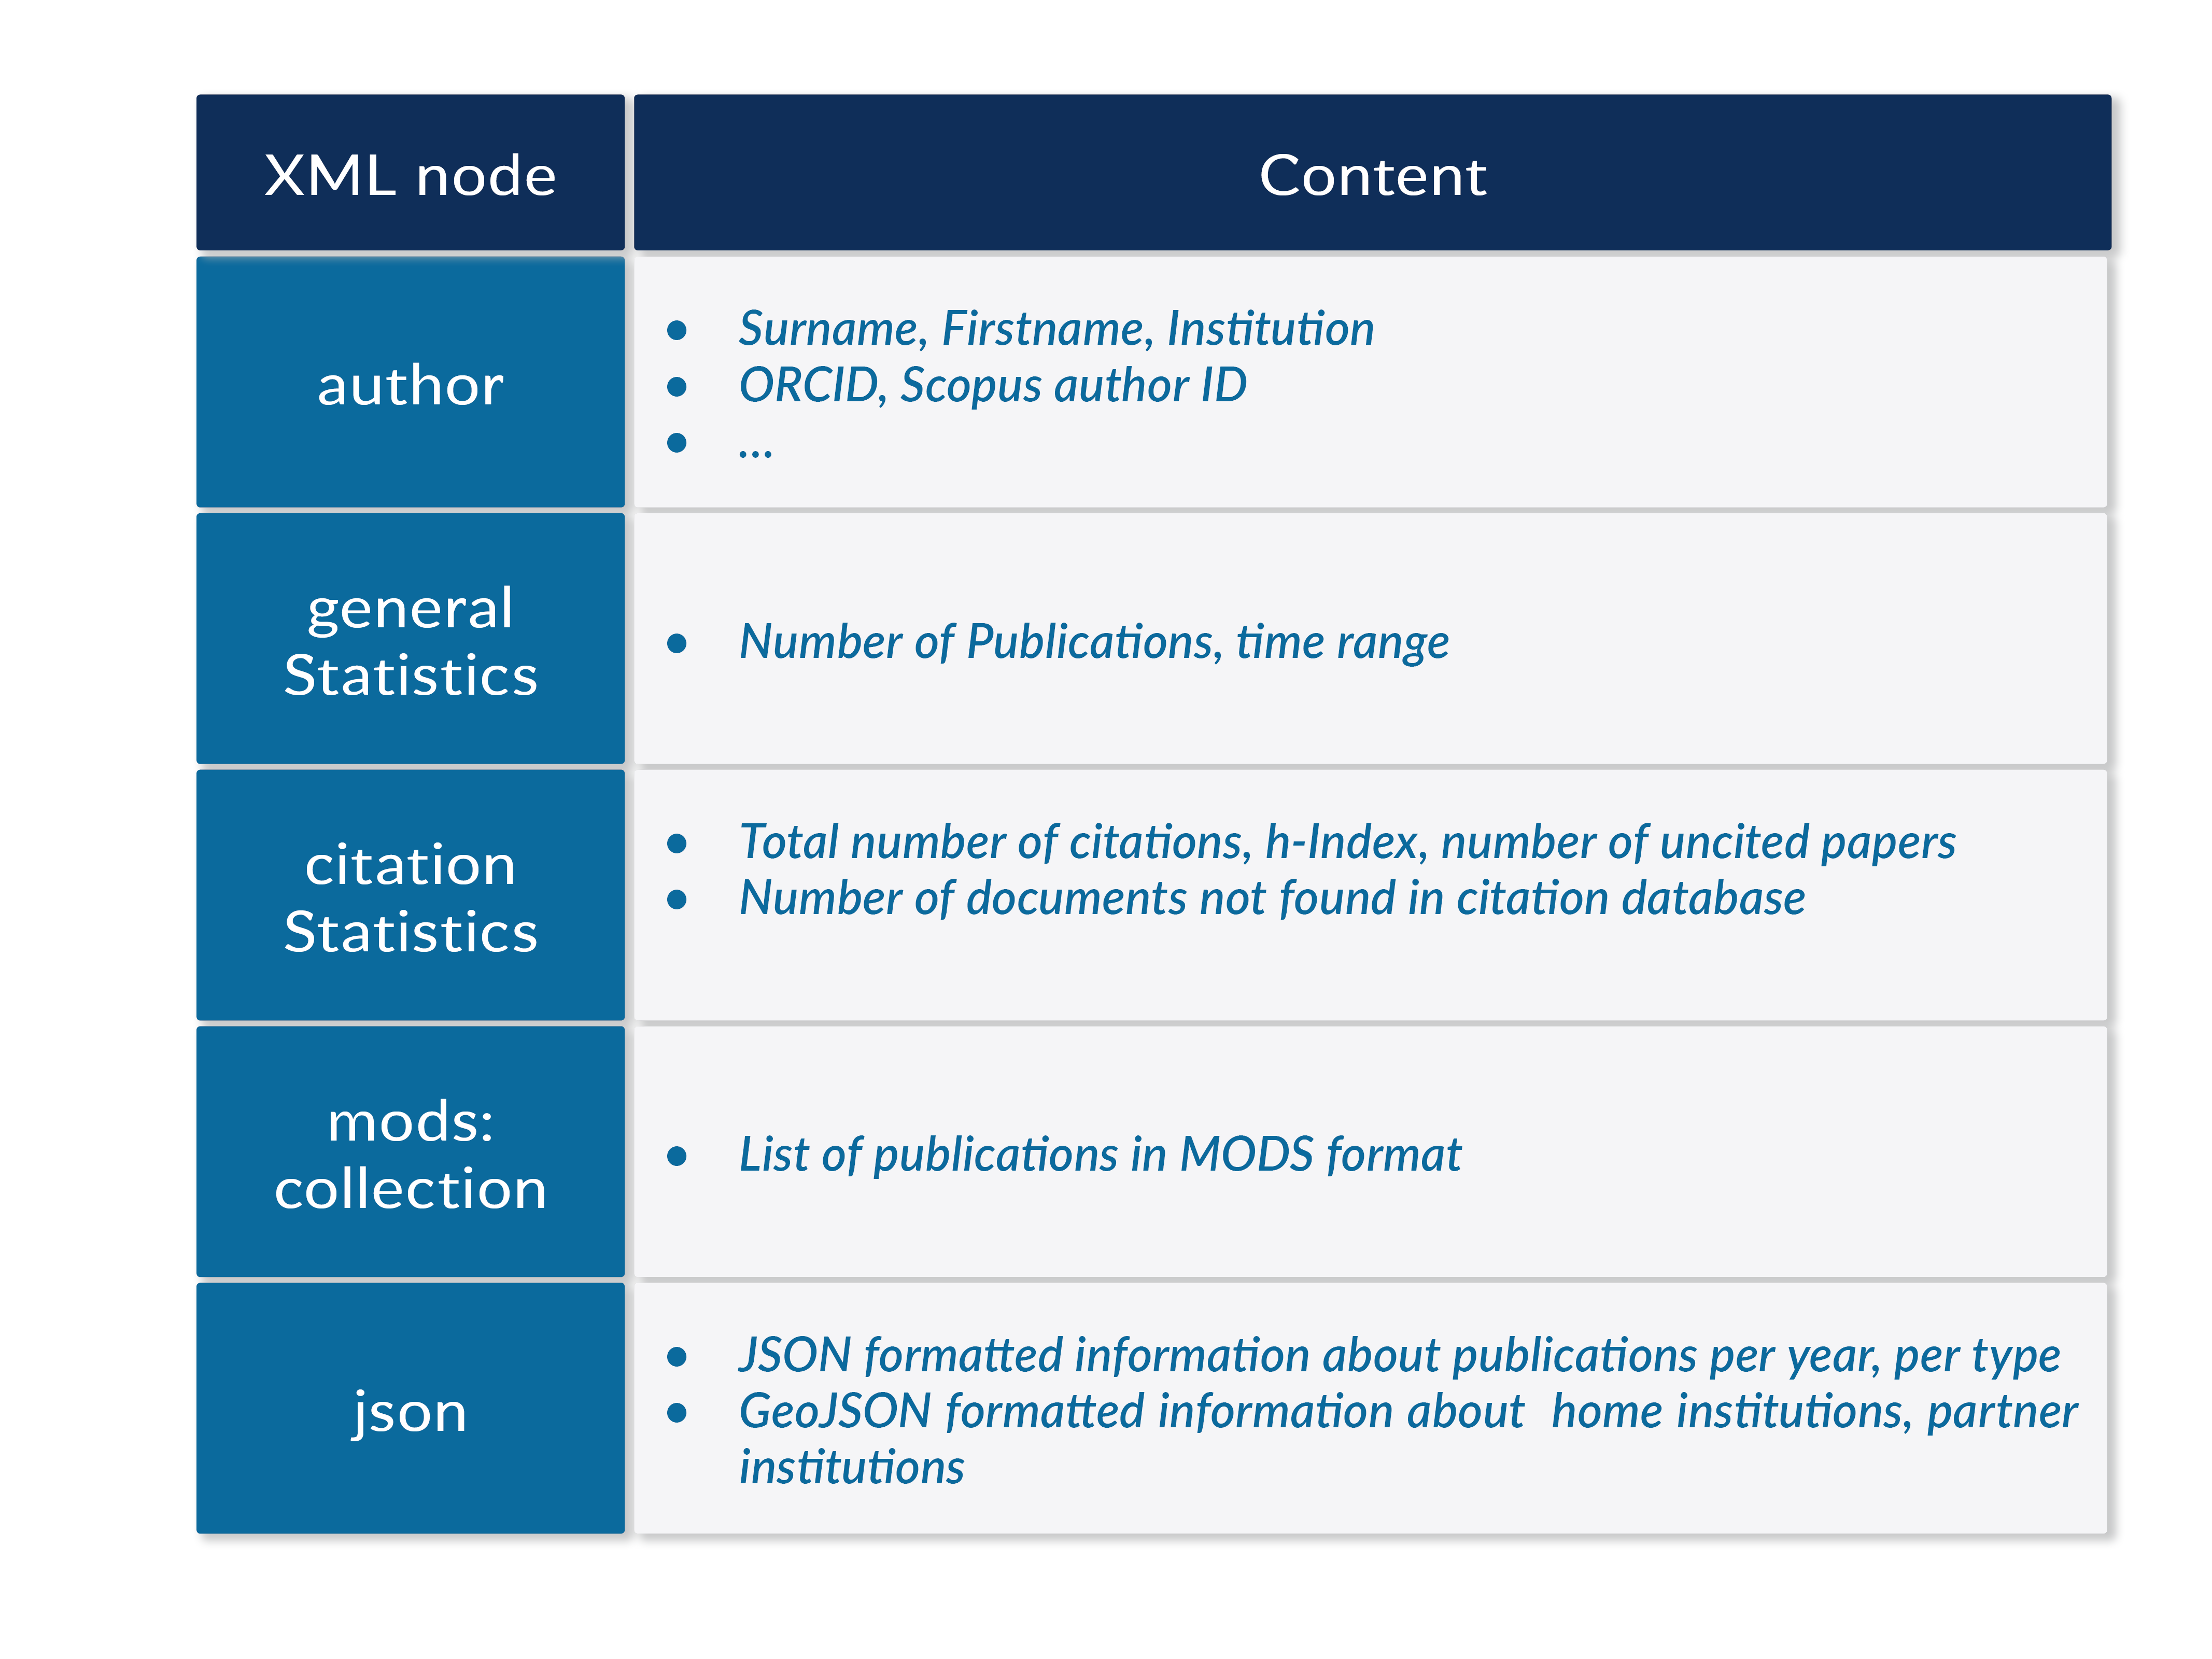
Figure 3. Workflow to distinguish between different identifiers used within the system.
With the obtained author the University Bibliography is queried for her or his publications. Some general statistical measures, and, if selected, citation and affiliation statistics are calculated on this set of publications.
Figure 4 shows the process flow for a bibliometric report performed by DuEPublicA. The blue boxes depict the individual internal modules responsible for the individual steps. The knowledge base holds information about the authors and their identifiers. The University Bibliography collects all the publications. The general statistics, the citation, and affiliation statistics modules are part of the web application. The last two modules collect additional information for each entry from an external source (depicted in dark blue) such as Scopus [14]. How these individual modules work is described in more detail in the next sections.
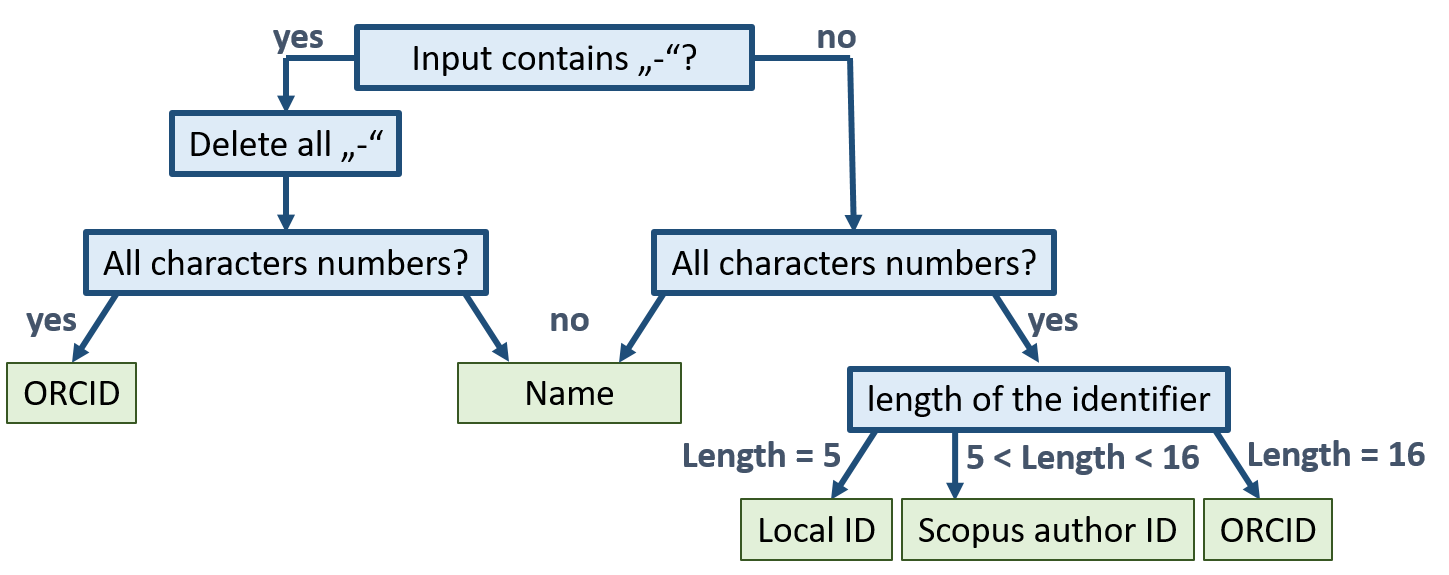
Figure 4. Process flow for a bibliometric report performed by DuEPublicA. The general steps are depicted as grey boxes, the internal data sources as blue boxes and the external as dark blue boxes.
Selection of Authors – the “Knowledgebase” for author data
In general, a lot of information is needed to characterize an author and to make sure that all publications are found. To prepare the analysis, a collection of data about the author is helpful. For this purpose, we designed a small database collecting information about the author(s), such as name, local and remote identifier, web pages, or address. We designed the knowledgebase as an independent RESTful application. A PostgreSQL database [15] is used, accessible via a RESTful web application. This is easily achievable by defining a Plain Old Java Object (POJO), holding just the individual fields (name, affiliation, etc.). The JpaRepository interface within the Spring Boot framework [16] builds a layer above the PostgreSQL database that provides options to retrieve, search, save, modify and delete entries via HTTP operations. Very good guides on how to set up such repositories and use the Spring Boot framework can be found at https://spring.io/guides. A small web frontend comprised of form fields to enter the data offers an easy way to submit author details (see Screenshot 2). The pre-definition of authors in the knowledgebase is optional. If no entries are found in the run of an analysis, a new author is created.
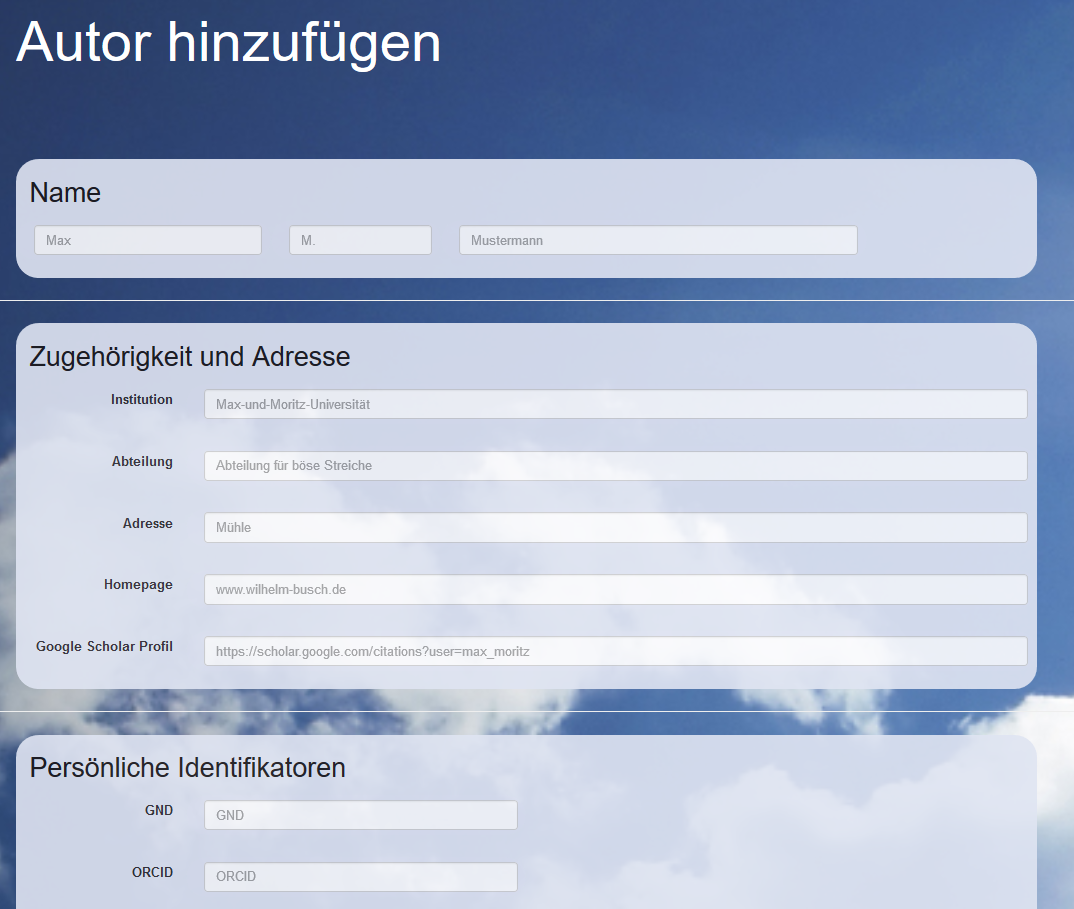
Screenshot 2. Part of the web frontend to enter author details for the knowledgbase.
The analysis tool itself, DuEPublicA, offers a search field where the name, the local identifier, the Scopus author ID or the ORCID can be entered (see Screenshot 3). Upon submission, the application determines the type of ID entered and the knowledge base is queried. If the author is found, the corresponding object is retrieved. As stated above, if the author is not present in the database, a new object is generated and filled with information from available sources. For example, if a Scopus author ID is entered, the Scopus API is used to fill the fields like author name, ORCID (if present) [17] and so on. Subsequently, the University Bibliography is queried with this information. Use of the local identifier as the query parameter offers the opportunity to easily collect the data for a specific author from already curated data (vide supra).
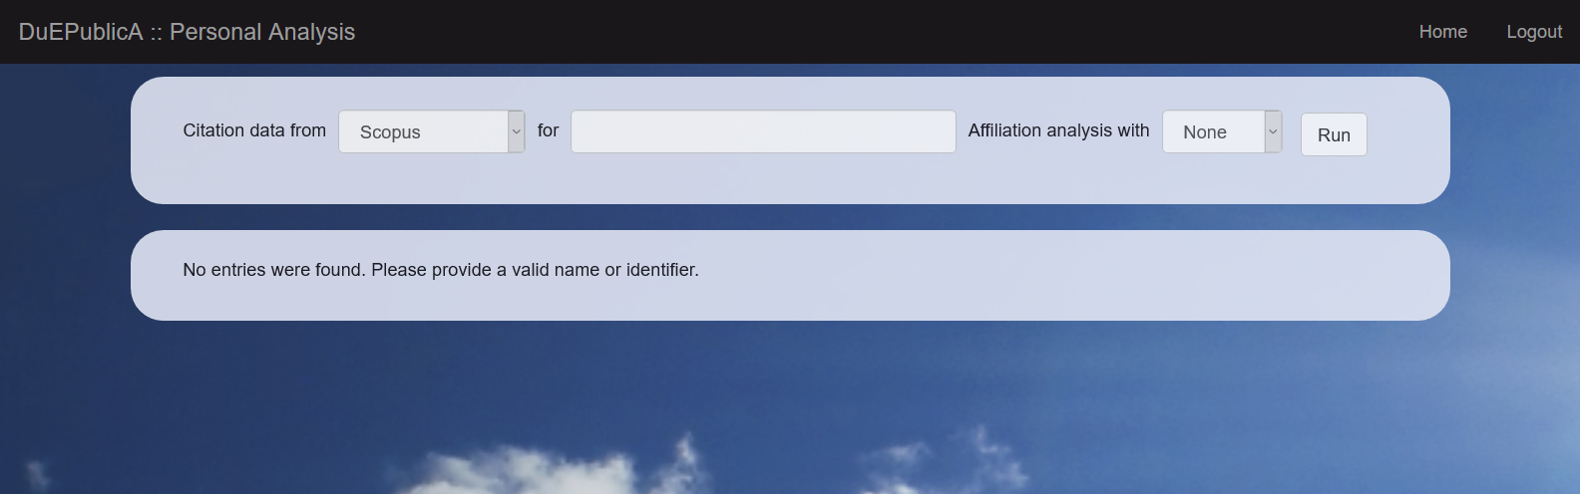
Screenshot 3. Form fields to enter either a name or a personal identifier.
Collection of Documents – the University Bibliography
As mentioned above, the internal format used within the MyCoRe community is the Metadata Object Description Scheme (MODS), therefore the obtained articles are in well-formed XML and several fields can be addressed easily. The University Bibliography itself is based on XML files indexed by an Apache Solr core.[18] The MyCoRe-API allows you to query the Solr-API in a controlled way. Upon querying the MyCoRe-API for a set of entries, a so-called MODS collection is returned in XML-format, holding the individual MODS-entries.
From the point of DuEPublicA, all connections to external sources are handled by connectors. In the source code, two Java-interfaces have been defined: the “Connector”-interface and the “CitationGetter”-Interface. The first one describes methods to retrieve entries from bibliographic sources (the original publications, written by the people under evaluation), while the second one describes methods to retrieve data about the citation of these entries (the number of other publications, which cite the original publications). The purpose of these two connectors is quite different: while the first one gives a list of publications with bibliographic information (title, author etc.), the second one gives the number of citing articles (citation count) for each publication.
The MyCoRe-Connector implements the “Connector”-interface and is used to retrieve the publication entries for a given author from the MyCoRe-based University Bibliography. By implementing the “Connector” interface with different connectors (for example a connector to a local current research information system – CRIS) and mapping the response to the corresponding MODS-fields, other sources of bibliographic data can easily be implemented.
Connectors like the Scopus-Connector implement the “CitationGetter”-interface and are used to retrieve citation data. By writing other connectors, which implement the “CitationGetter” interface, other sources for citation data (Web of Science, IEEE Xplore) can also be used to prepare bibliometric reports. One of the MODS fields contains identifiers related to this publication. The field “identifier” holds persistent identifiers such as the DOI or the ISBN, but also database specific identifiers, as the Scopus ID or the UT-code for Web of Science.[19] This might look like this:
<mods:mods ID="ubo_mods_00073321">
    …
    <mods:identifier type="doi">10.1016/j.jallcom.2016.09.165</mods:identifier>
    <mods:identifier type="scopus">84989905431</mods:identifier>
    …
</mods:mods>
Wherever possible these IDs are added to the entries within the University Bibliography, either directly when importing the entry (for example from the Scopus database), subsequently by automated routines, or manually when preparing an analysis. Using these IDs, additional data can easily be retrieved from external sources.
By means of this mechanism, we incorporate the cleaning of data necessary to select the publications from the citation database (or the export from the database) to the local University Bibliography. For example, a study for a specific institute has to be performed. However, the authors do not always name the institute in the affiliation data within the publication. Maybe they only mention the university, their own group, a common abbreviation, or something similar. If you want to search for the publications within a citation database, you would probably use the individual author names together with the some general affiliation data like city, university name, etc. Also identifiers like the Scopus author ID show similar problems, especially if the author’s name is quite common. When authors have a very common name, you get a lot of publications with this approach that do not belong to the institute. So if you perform analyses, you have to spend a lot of time cleaning the information collected from the citation databases.
All of these problems with name variants, institutional affiliations and identifiers can be directly and immediately tackled within our library. As the University Bibliography acts as a kind of showcase for the publications of the University Duisburg-Essen, and also allows the incorporation of personalized publication lists on the personal homepages (vide supra), efforts have already been spent to curate the corresponding entries since the beginning. The attribution to an institute is already within the identity management of the university, the local identifiers are also incorporated (to allow features like the personal publication list). We can thus select the set of publications for an institute easily within the University Bibliography. We get the local IDs for an institute and collect the publications for these IDs.
So we have a good and clean list of publications, we just need to link them to the entries within the citation database and collect additional information such as citation counts directly during the analysis. We therefore do not need to set up new procedures and routines to clean data for bibliographic analyses, instead we have to extend the established procedures a little bit to include other kinds of identifiers like the link to the scopus database. This is particularly easy for those entries which have been imported from the citation database, as the identifiers are already included.
So we have a clean set of publications and we have the links to the entries of the citation database. Now we enrich the publications from the list with additional information such as citation counts and perform three types of analyses.
General statistics
The first step is the calculation of some basic statistics. This includes data such as the total number of publications, the distribution along the years and the types of publications. This analysis can also be performed if no external sources are used. The corresponding Java-class GeneralStatistics holds all the information and offers methods to get well formed JSON-objects, which can be displayed directly.
Such a class can be instantiated by supplying a collection of MODS entries. Internally they are handled as a list of JDOM2-Elements. Due to the well-defined structure of these entries, information such as publication year or type of publication can easily be accessed using XPath expressions.[20] By analysing the node contents of “<originInfo><datedateIssued>” and “<genre>” with the help of String manipulations and regular expressions, values can be extracted in the desired format, counted, and saved as fields in a GeneralStatistics object. The methods “getPublicationsPerYearAsJSON” and “getPublicationsPerTypeAsJSON” produce these values directly as JSON-Objects, which can be directly displayed by the JavaScript-Framework Highcharts.[21])
Citation statistics
A basic citation analysis is performed with the citation data obtained from the citation database. Parameters like the average number of citations per publication, the fraction of uncited papers and the h-Index are calculated and stored within the Java-class CitationStatistics. Again, this class is instantiated by supplying the list of MODS entries. Upon creation of the object, the parameters are calculated.
A very important parameter is the coverage of the citation database. This value is calculated by dividing the number of entries in the citation database by the total number of entries in the University Bibliography. It is expressed as percentage and used to display warnings or alerts if the analysis becomes unreliable due to an insufficient coverage of the entries within the citation database. As mentioned before, a common critique that we hear is: “My publications are not in this citation database, your analysis does not make any sense.” Taking this point seriously, we try to establish trust in our analysis by incorporating corresponding warnings within our reports and openly acknowledging the limited applicability in certain cases.
Affiliation statistics
Where available, information from the external sources is used to generate a map of institutions the author has been affiliated with as the author of a publication as well as of institutions where co-authors were affiliated. Again the list of MODS entries is used to instantiate an AffiliationStatistics object, which performs the analysis upon creation.
For Example, the Scopus database contains information about the affiliation of authors. Information about city and country are extracted from the Scopus response and then the latitude and longitude are retrieved from the Google Maps Geocoding API. The combined information are used to generate three GeoJSON-Objects: one that depicts the actual affiliation, one that holds all home affiliations of the investigated author and a third one that holds all affiliations of his co-authors. The use of the GeoJSON format allows the data to be displayed by a number of programs and frameworks (see Screenshot 4).
Output – generating the report in multiple formats
All analyses are prepared as XML-documents (represented as JDOM-Elements within the Java code). Each analysis object (GeneralStatistics, CitationStatistics, and AffiliationStatistics) adds another node to the output (see Figure 5). The parameters calculated within these analysis objects are then inserted as sub-nodes. Also the author object, obtained either by querying the knowledgebase or newly generated, produces a node and sub-nodes for the name, identifiers and so on:
<bibliometricReport>
    <author>
      <surname>…</surname>
      <orcid>…</orcid>
      …
    </author>
    <citationStatistics>
      <hIndex>…</hindex>
      …
    </ citationStatistics >
    …
</mods:mods>
The JSON-data [22], produced by the AffiliationStatistics and GeneralStatistics objects and used for the charts and maps, are not stored within the corresponding node, but are rather incorporated in a separate node. Including the JSON-formatted information within the XML-document might look a little bit surprising at first glance. However, it offers some advantages with respect to the html rendering by XSL transformation (vide infra). By providing the data in the JSON format, no transformation is necessary and the data can be ingested directly by the JavaScript frameworks that produce the maps and figures. The collection of the data within one single node makes it easier to attach just one block of JavaScript code during the XSL transformations.
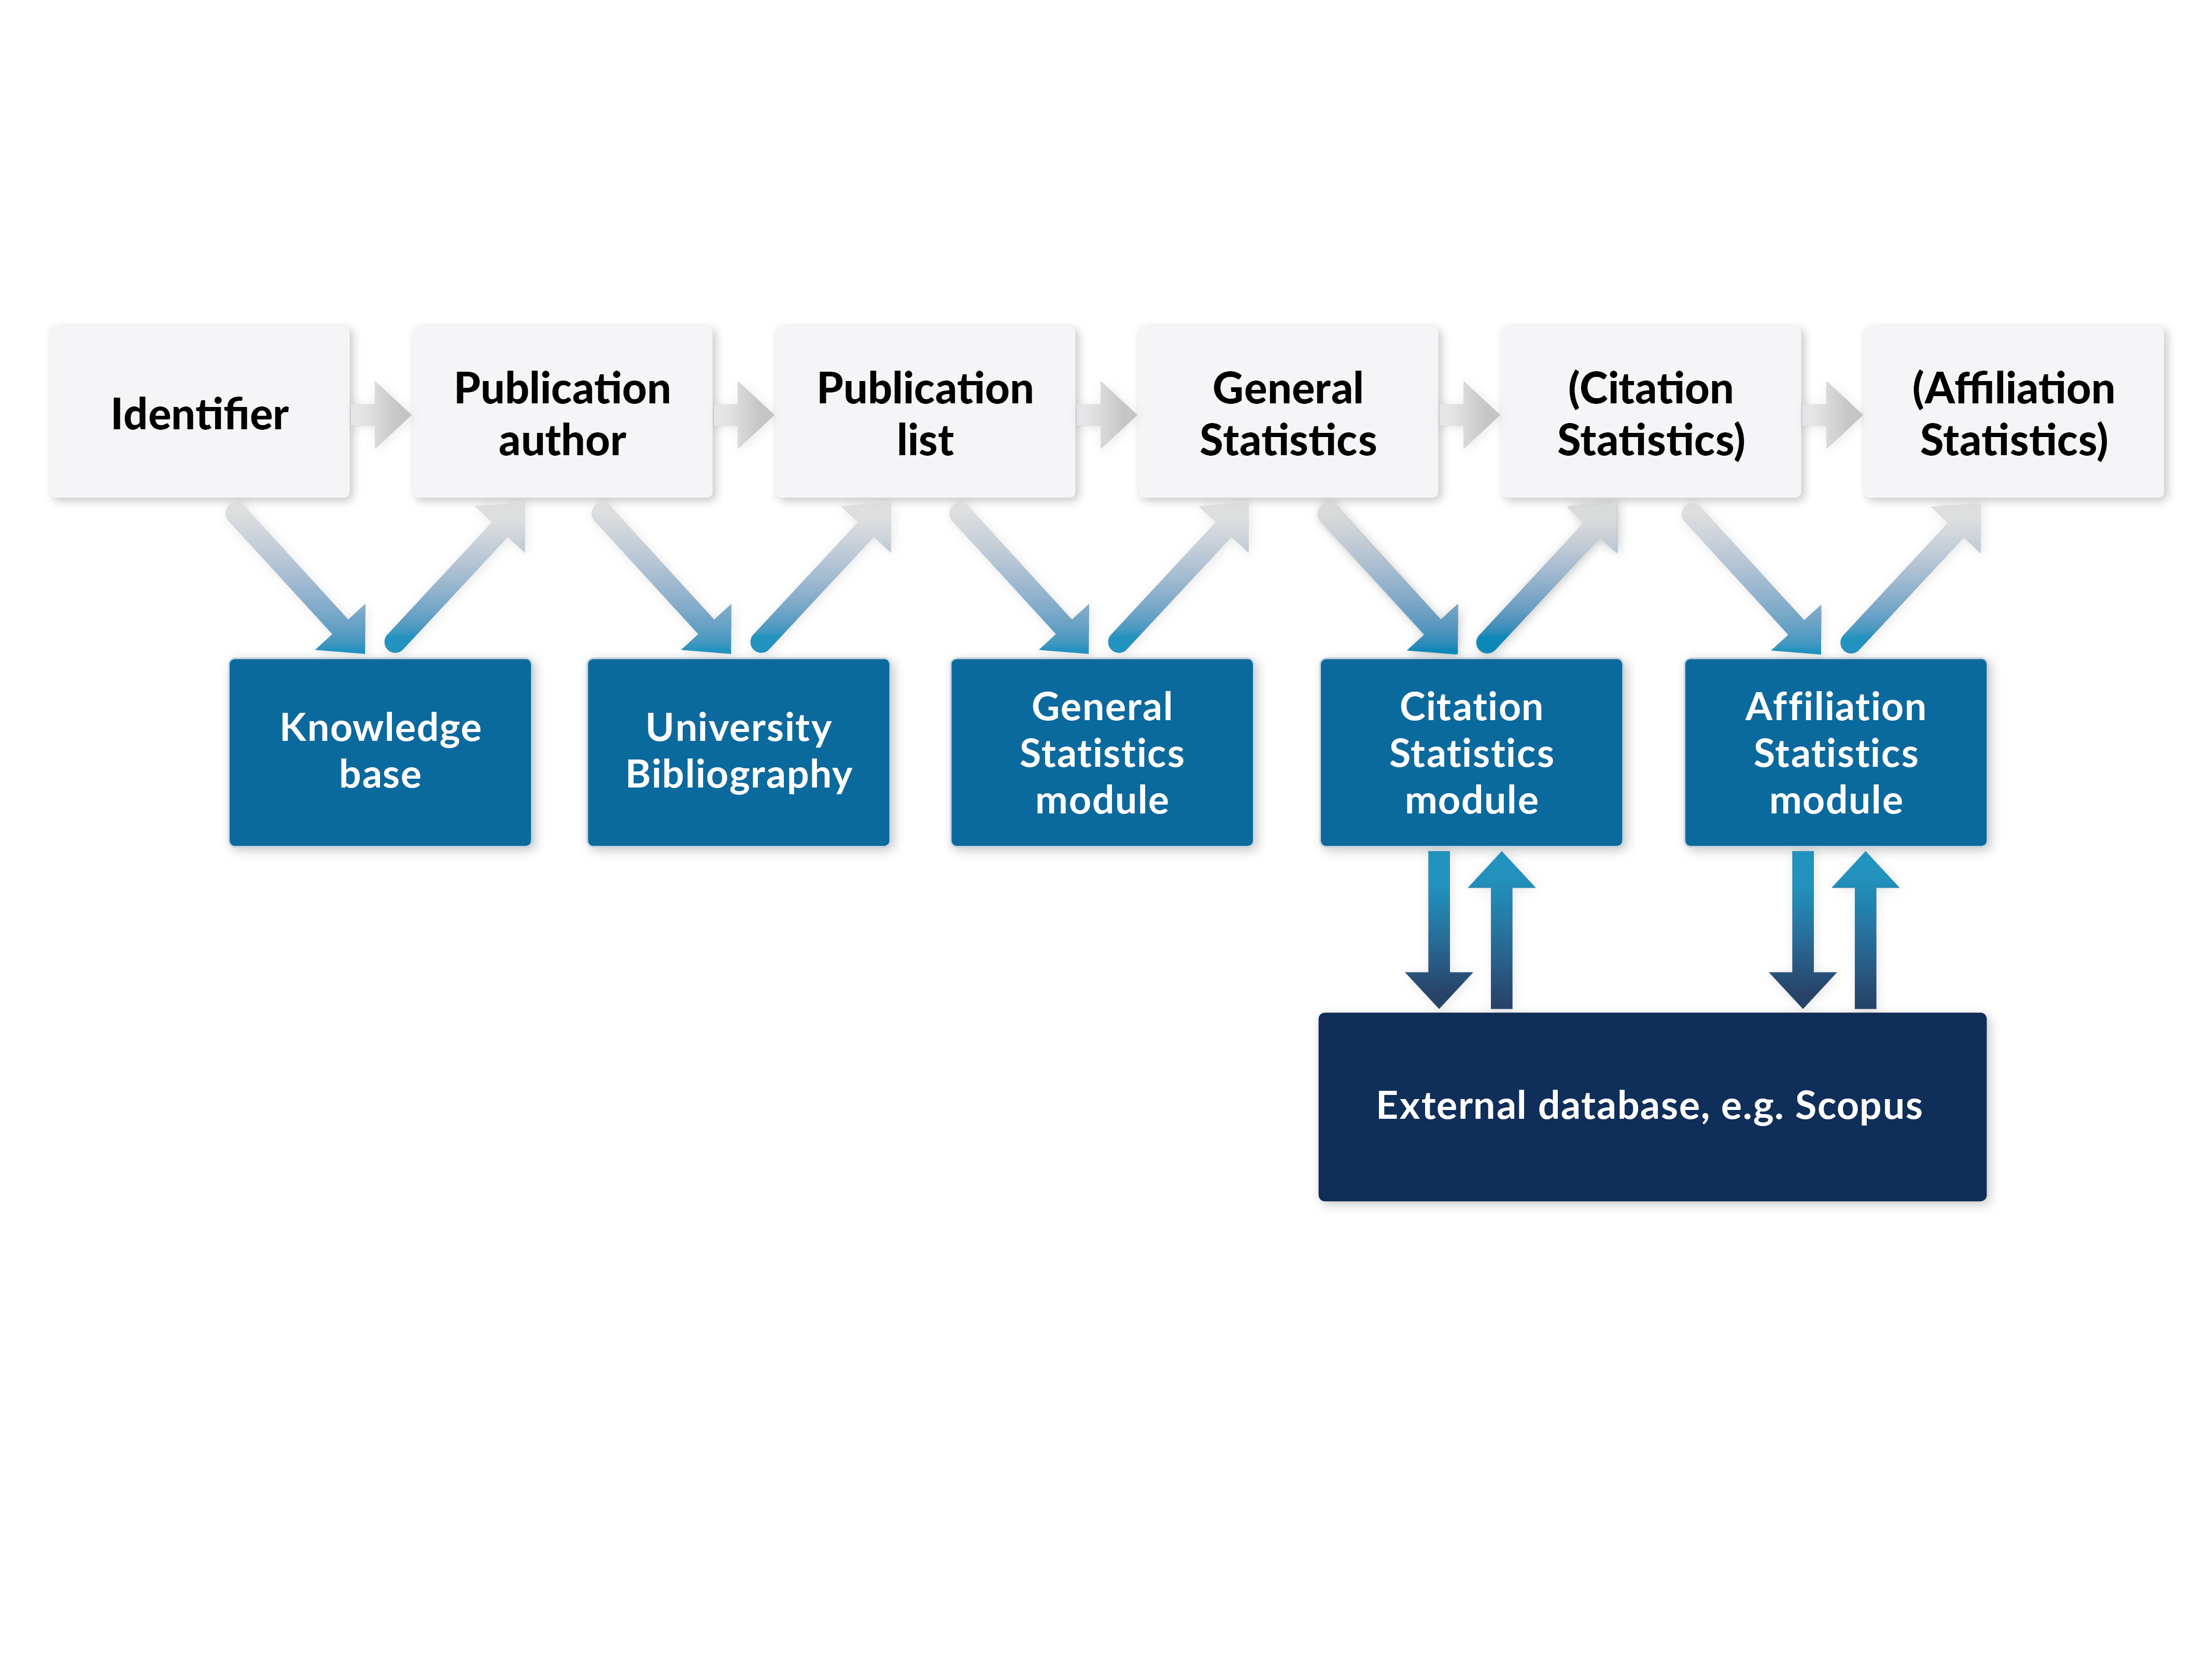
Figure 5. XML nodes and the corresponding content.
If the generated report is accepted by the “analyst” by pressing the “save and prepare pdf” button, the XML file is saved on the server. A new guest user and a corresponding folder are generated, the figures are prepared and the pdf is produced. Two links are generated and sent to the analyst in a short email, which can be forwarded to the recipient: one to view the report in guest mode (that is without the control buttons and form) and one to download the pdf-file.
Html
After saving, the generated report can be retrieved as an HTML document by a web servlet (BibliometricReportDisplayServlet). This servlet loads the saved XML-file, renders a HTML page via XSL-transformations, and displays the report in the browser. Using the generated link, the user is automatically authenticated with the role “guest”. The XSL-file responsible for the preparation of the HTML-page is the same as used before during the preparation of the report. However, depending on the role of the authenticated user, the form fields and the “save and create pdf” buttons are displayed (role: “analyst”) or not (role: “guest”). A “guest” user only sees the report, without the possibility to perform analysis himself.
The HTML-report has a responsive design (based on Bootstrap [23]) and is organised in a block-wise fashion (see Screenshots 4-8). Some of these blocks are omitted if the corresponding analysis has not been performed. For example, if no affiliationStatistics-node has been created, the complete block with the map would not be displayed.
The report starts with the affiliation analysis (if performed) as an interactive map (see Screenshot 4). It is followed by a general disclaimer (not depicted), and the overview of the types of publications (see Screenshot 5 upper box). If a citation analysis was performed and if the coverage of publications in the citation database is below a threshold, a warning (coverage less than 80 %) or an alert box (coverage less than 60 %) is displayed (see Screenshot 5, lower box).
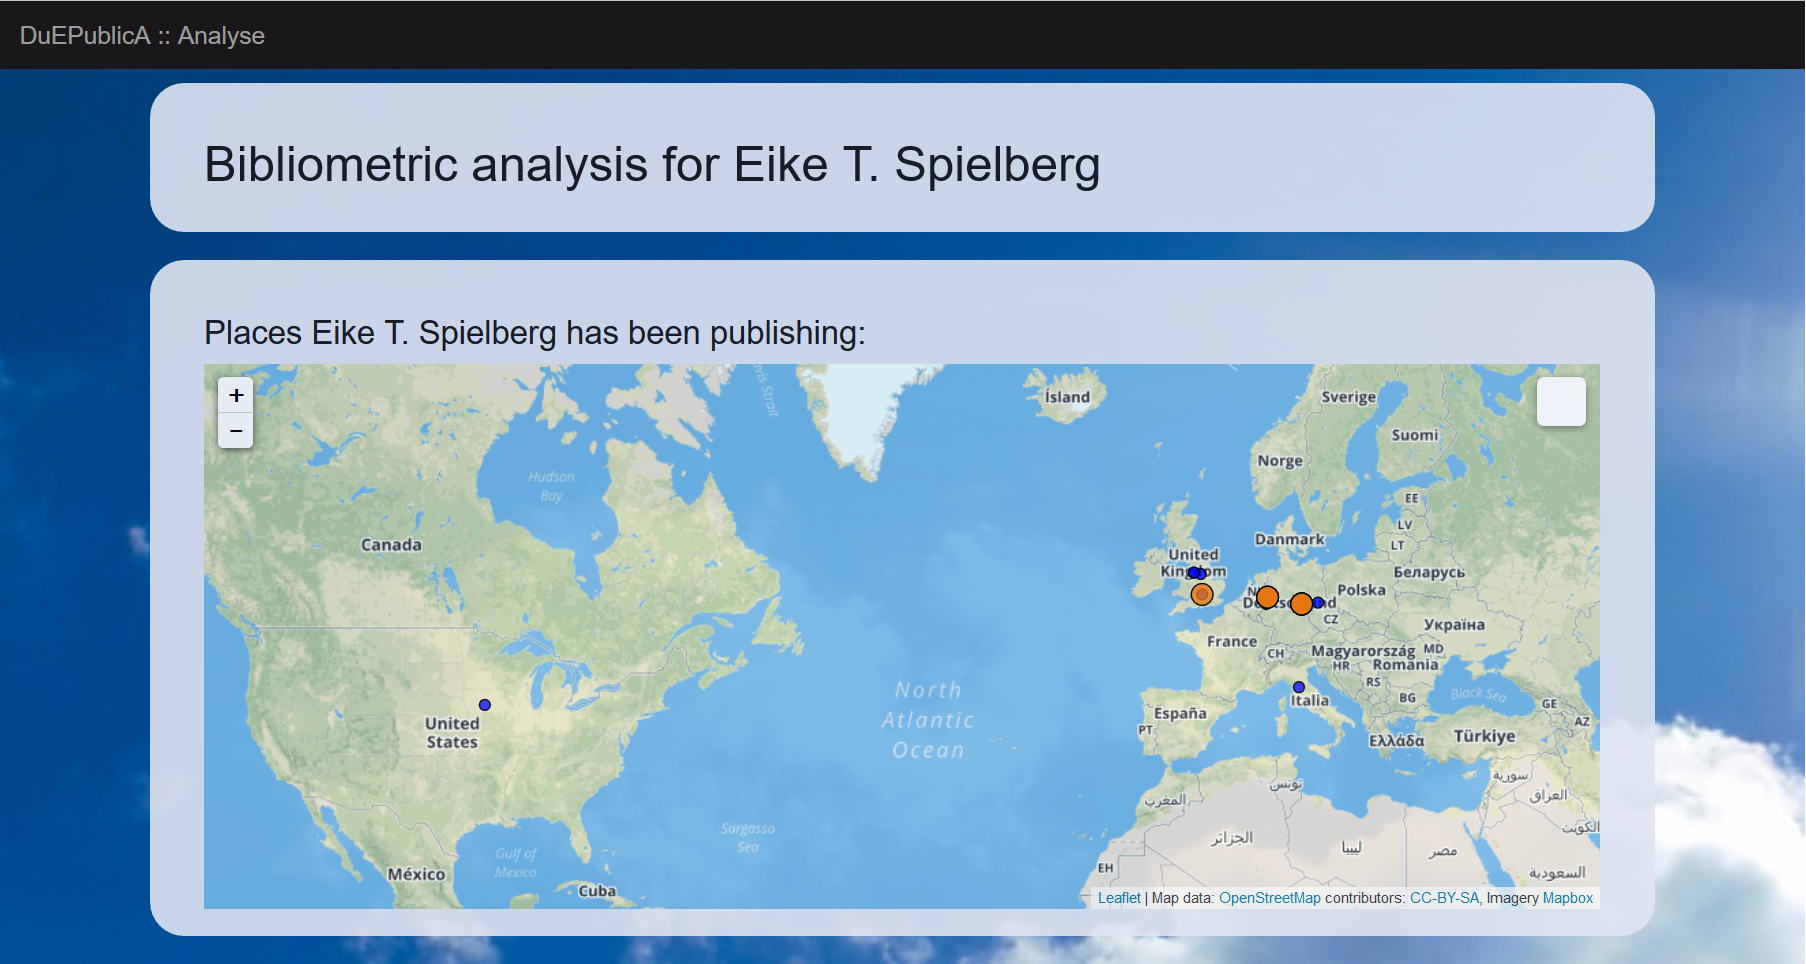
Screenshot 4. Affiliation statistics presented as an interactive map.
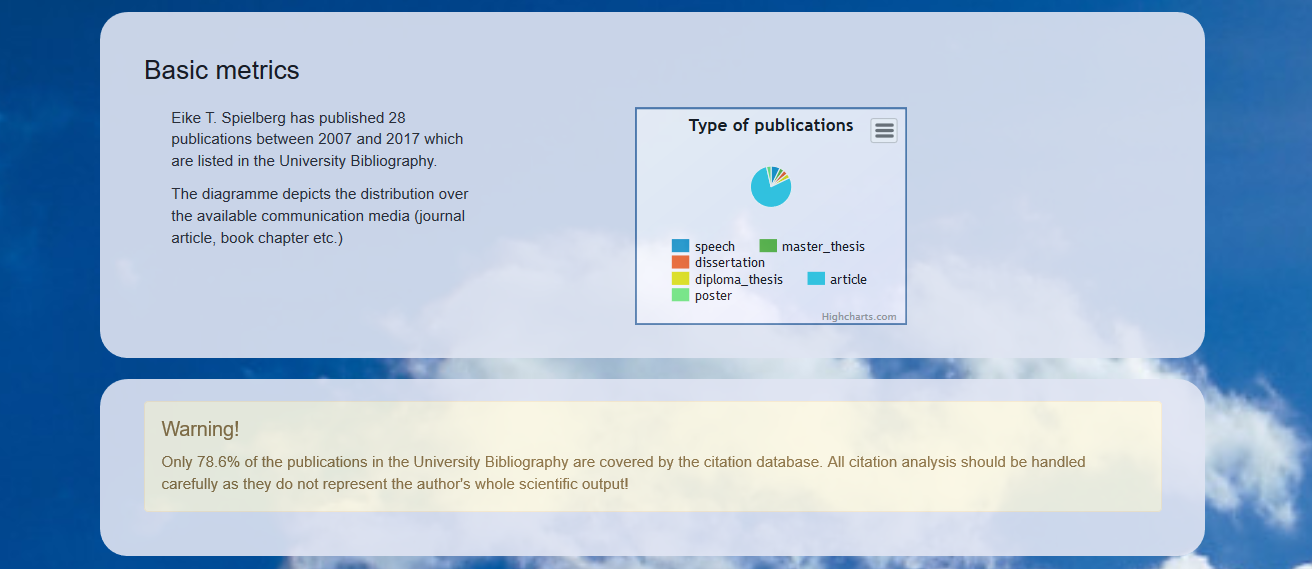
Screenshot 5. Type of publications and warning box.
If a citation analysis was performed, a general overview of basic metrics – e.g. number of publications in citation database, total number of citations, average citations per publication, percent of non-cited publications and h-index – is shown, first as a table block, followed by a detailed description of the basic metrics (see Screenshot 6).
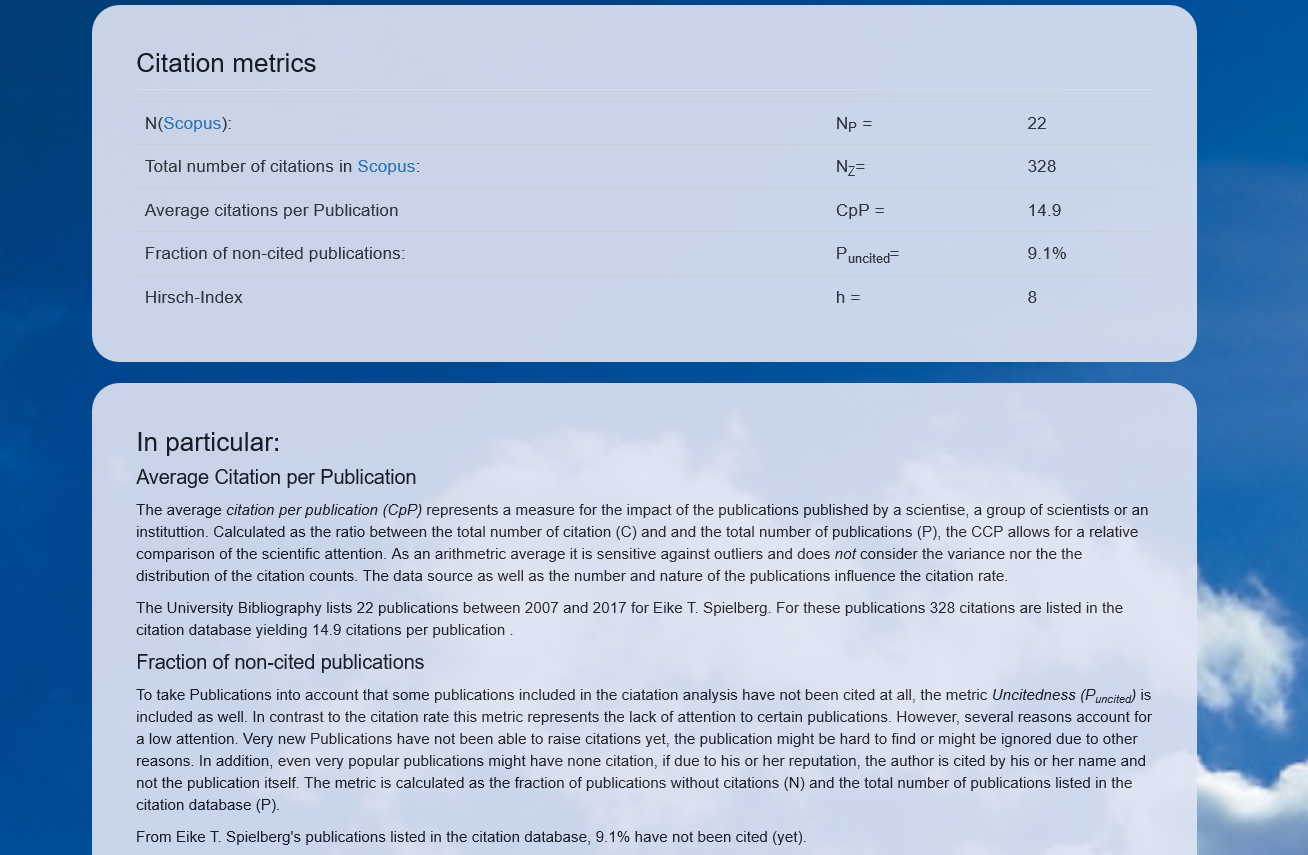
Screenshot 6. Citation metrics and detailed description.
Finally, the distribution of publications per year is shown as an interactive chart (see Screenshot 7) and the list of publications as a sortable, paginated table (see Screenshot 8). In the case of journal articles, the title links to the corresponding publication, the name of the journal links to the availability information of our University Library, and the number of citations links to the overview page in the citation database (for example Scopus).
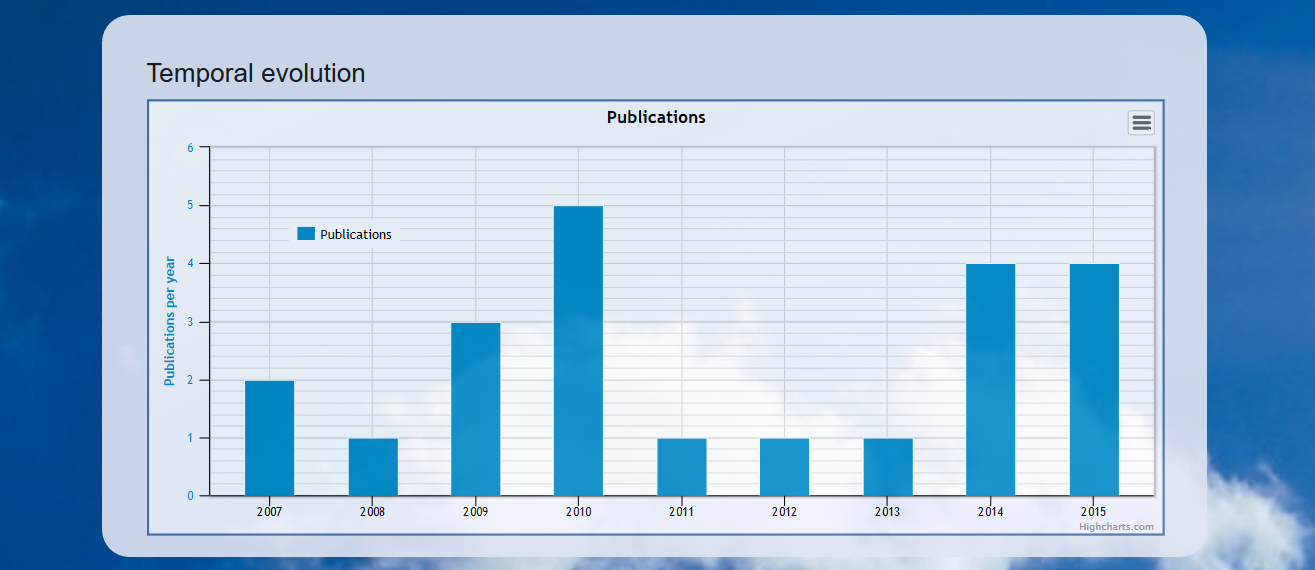
Screenshot 7. Temporal evolution of publication activity.
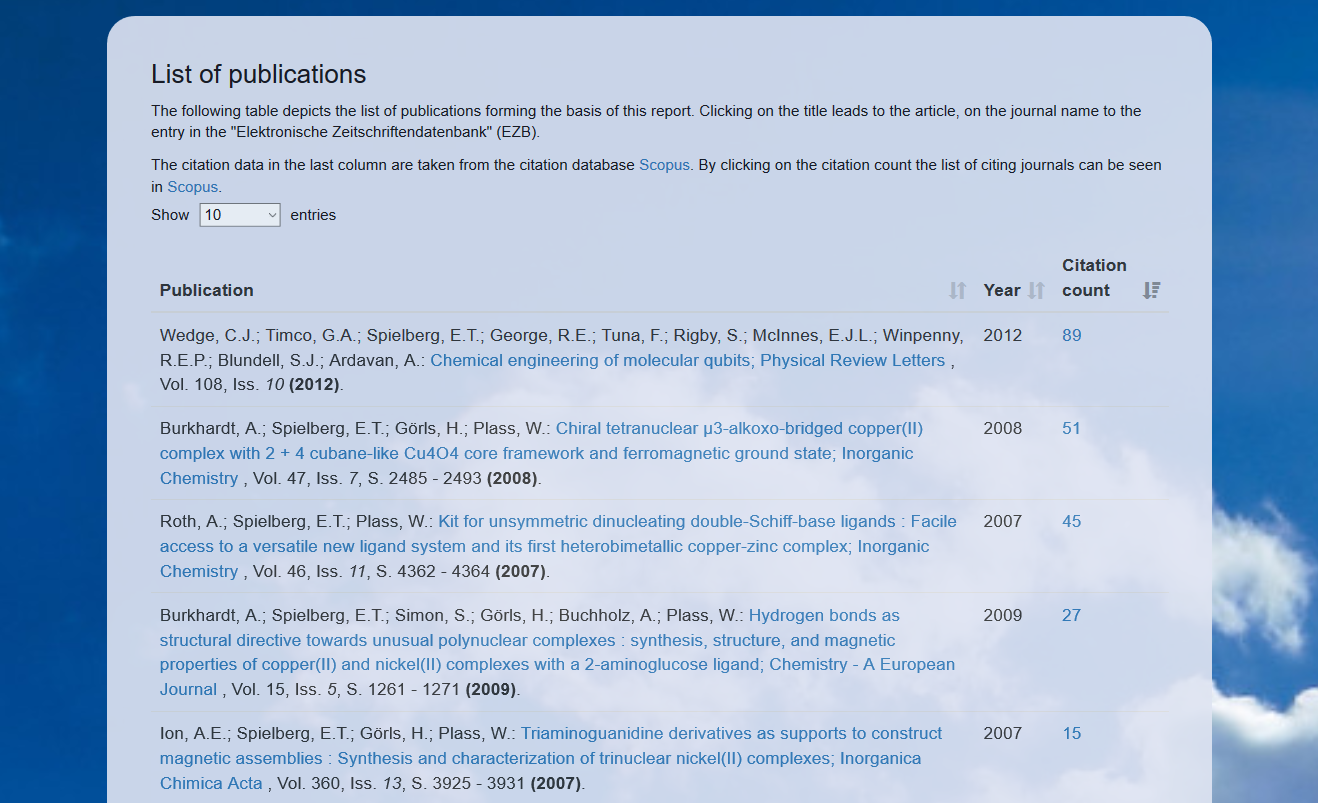
Screenshot 8. List of Publications.
The representation as an HTML web page allows an interactive experience. Charts and maps can be zoomed in, details analysed by sorting the table, and hover-over highlighting make it easy to read the data from tables. However, for several purposes a printed, more formal, type of report might be necessary. To this end, the XML file is also transformed into a pdf file.
To generate well-formatted reports as pdfs, the final XML-document is transformed into LaTeX source code.[24] The relevant responsible part of the source code is depicted in Listing 1. The “generateFile” method uses XSL 2.0 transformations (“bibliometricReport2latex.xsl”) to generate the plain text input file. The overall layout is based on the KOMAScript package [25] and is included together with the text in the transformation file. Up to now, only German output is produced. A localization to other languages could be achieved by adjusting the corresponding XSL file. Similar to how the HTML is rendered, individual sections are generated. If analyses have not been performed, the corresponding sections are omitted. By using the package hyperref [26], a fully linked table of contents and several hyperlinks to external sources (such as Scopus) can be included as well.
To include the graphical representations within the pdf file, they need to be exported into some graphical format, preferably png. For the Highcharts graphs a command line tool exists [27], which uses a node.js server [28] to produce svg or png files. In our case we choose png files as they can be included easily into the LaTeX-document using the graphics package. To this end, the input-JSON files are generated from the analysis XML by XSL 2.0 transformations as well (“pubsPerYear2JSON.xsl” and “pubsPerType2JSON.xsl”). Then the command line tool is called, producing the desired graph files. Only the map cannot be exported (yet). After the graphs have been exported, the LaTeX compiler (pdflatex) is called from the export servlet with the “nonstopmode” option generating the final pdf-file (see Screenshot 9). As common with LaTeX calls, two runs are required, the first one generating the references to figures and hyperlinks and the second including them into the output pdf.
generateFile(reportXML.clone(),"xsl/bibliometricReport2latex.xsl",latexFile);
generateFile(reportXML.clone(),"xsl/pubsPerYear2JSON.xsl",pubsPerYearFile);
generateFile(reportXML.clone(),"xsl/pubsPerType2JSON.xsl",pubsPerTypeFile);

// build the pdf by pdflatex
ProcessBuilder pbPubsPerYear =
       new ProcessBuilder("cmd","/C","{PathToExportServer}highcharts-export-
           server","-infile","pubsPerYear.json","-outfile","pubsPerYear.png");
   pbPubsPerYear.directory(reportFolder);
pbPubsPerYear.start().waitFor();

// build the pdf by pdflatex
ProcessBuilder pbPubsPerType =
       new ProcessBuilder("cmd","/C","{PathToExportServer}highcharts-export-server",
           "-infile","pubsPerType.json","-outfile","pubsPerType.png");
pbPubsPerType.directory(reportFolder);
pbPubsPerType.start().waitFor();

// build the pdf by pdflatex
ProcessBuilder pbLatex = new ProcessBuilder("pdflatex","-interaction=nonstopmode",
           "report.tex");
pbLatex.directory(reportFolder);
pbLatex.redirectOutput(new File(reportFolder, "shell.log"));
pbLatex.start().waitFor();
pbLatex.start().waitFor();
Listing 1. Programmatic generation of figures and call of LaTeX compiler.
The pdf is stored together with the source files and the XML-file and can be accessed by the generated download link. This link can be shared or forwarded, offering a nice way to deliver the report to the client.
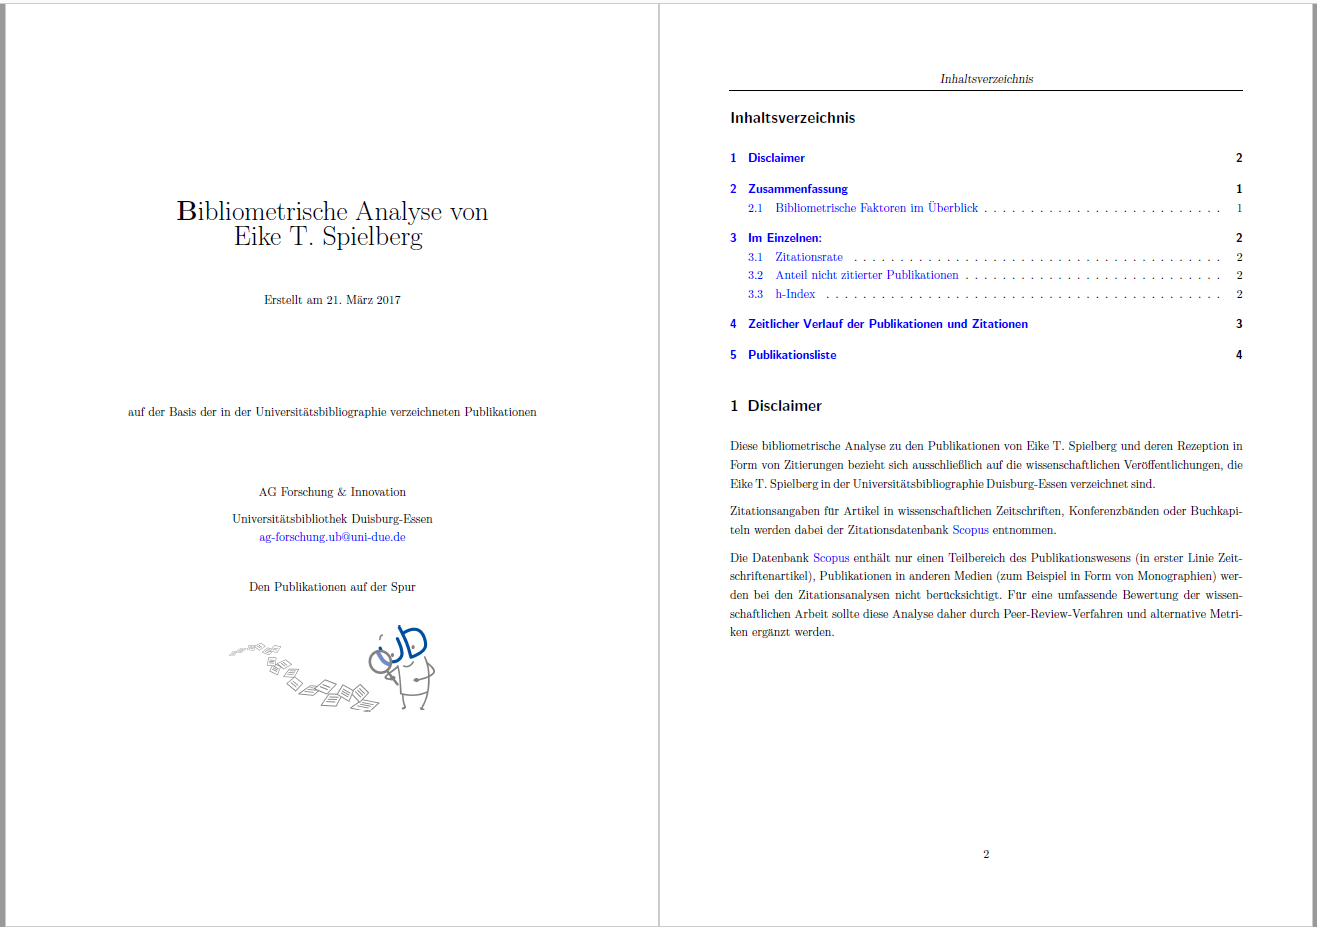
Screenshot 9. First two pages of the bibliometric report (in German) as LaTeX generated pdf file.
Next steps – inclusion of other sources and modularity
Although limited in the actual components, the web application has been designed to be highly flexible. Up to now, only MyCoRe based repositories and Scopus as a citation source have been included as external sources. However, the structure of the program allows for extension to several other systems. We have decided to use the MODS metadata scheme within the program, but transformation of other input via XSL transformations should be rather straight forward. The general functionality of the document loading has been defined as an interface, which can be implemented by a variety of connectors. In addition, an interface for a citation getter has been defined as well, defining the basic functions needed. Other connectors can be written to implement this interface, giving access to a number of different sources for citation data.
The three types of analyses (general analysis, citation analysis and affiliation analysis) are implemented by corresponding classes, which hold the results and offer methods to calculate the parameters and metrics. Incorporating other metrics is possible by expanding these classes.
Our future development will focus on the inclusion of additional sources, both for the bibliographic information and for the citation data. The use of current research information systems (CRIS) as a bibliographic source would greatly enhance the applicability of our tool. The inclusion of other citation sources such as Web of Science [29], IEEE Xplore [30] or other subject specific databases might greatly enhance the acceptance of such reports within the investigated community. And last but not least, we would like to re-organise the code in order to provide a RESTful API, which can be used to include the generated data in other reports and/or systems.
Conclusions
When preparing bibliometric analyses one faces two major problems: firstly, the coverage of the author’s output in the citation database and secondly, the collection of all relevant publications. We tackle these two problems by developing a web application to generate reports based on the University Bibliography and the Scopus citation database. Provided with an author’s name or identifier (e.g. ORCID, Scopus author ID) the tool collects the author’s publications from the University Bibliography, enriches them with additional information gathered from the Scopus database and applies up to three kinds of analyses: a general analysis (number and type of publications, publications per year etc.), a citation analysis (average citations per publication, h-index, uncitedness) and an affiliation analysis (home and partner institutions). Especially the use of a local identifier, which is already curated within the University Library, circumvents an extensive cleaning of data.
The final report is available both as an HTML-version as well as in pdf-format. The general structure and workflow of this tool is designed to include many publication types. Due to its modular structure, additional metrics or data sources can easily be included.
Technical details
The web application is JAVA/XML based. The MyCoRe [31] framework was used to design the main servlet handling the requests. To allow user role specific views and options, authentication and authorization was performed using the Apache Shiro framework.[32] For the knowledgebase (see below) the Spring Boot framework [33] was used to generate the database backend and the web frontend. The general design of the web pages is Bootstrap [34]) based, the charts are generated by the HighCharts-package [35]) and the map is build using the lightweight Leaflet package [36], based on OpenStreetMap [37] together with the MapBox tiles [38]. The source code is available at GitHub: https://github.com/ETspielberg/bibliometrics, https://github.com/ETspielberg/knowledgebase-backend, and https://github.com/ETspielberg/knowledgebase-frontend.
Acknowledgement
Special thanks goes to Frank Lützenkirchen for his support with the MyCoRe-specific parts and to Felix Schmidt for helpful discussions. I would also like to thank Beate Baurmann for helping with some of the figures.
References
[1] Todeschini R, Baccini A. 2016. Handbook of bibliometric indicators: Quantitative tools for studying and evaluating research. 1. Auflage. Weinheim: Wiley-VCH Verlag GmbH & Co.KGaA. 483 p. ISBN: 3527681957. eng.
[2] Bornmann L, Mutz R, Neuhaus C, Daniel HD. 2008. Citation counts for research evaluation: Standards of good practice for analyzing bibliometric data and presenting and interpreting results. ESEP. 8:93–102. doi:10.3354/esep00084.
[3] Joshi MA, Patil SG. 2014. Bibliometric Indicators for Evaluating the Quality of Scientific Publications. TJCDP. 15:258–262. doi:10.5005/jp-journals-10024-1525.
[4][30] IEEE. [accessed 2017 May 11]. IEEE Xplore Digital Library. http://ieeexplore.ieee.org/Xplore/home.jsp.
[5][19][29] Clarivate Analytics. [accessed 2017 Jan 28]. Web of Science. http://wokinfo.com/.
[6][11][14] Elsevier. [accessed 2017 Jan 28]. Scopus: Welcome to Scopus. https://www.scopus.com/.
[7] Google Inc. [accessed 2017 May 19]. Google Scholar. https://scholar.google.de/.
[8] Aguillo IF. 2012. Is Google Scholar useful for bibliometrics?: A webometric analysis. Scientometrics. 91(2):343–351. doi:10.1007/s11192-011-0582-8.
[9] Priem J, Taraborelli D, Groth P, Neylon C. 2010. Altmetrics: A manifesto. [accessed 2017 May 19]. http://altmetrics.org/manifesto.
[10] Universität Duisburg-Essen. [accessed 2017 May 11]. Welcome to Bibliography of UDE. [place unknown]: [publisher unknown]. https://bibliographie.ub.uni-due.de/lang=en.
[12][31] MyCoRe-Community. [accessed 2017 Jan 19]. MyCoRe: Das Framework zur Präsentation und Verwaltung digitaler Inhalte. de. http://mycore.de/.
[13] The Library of Congress. [accessed 2017 May 11]. Metadata Object Description Schema. http://www.loc.gov/standards/mods/.
[15] The PostgreSQL Global Development Group. [accessed 2017 May 11]. PostgreSQL: The world’s most advanced open source database. https://www.postgresql.org/.
[16][33] Pivotal Software. [accessed 2017 May 11]. Spring Boot. https://projects.spring.io/spring-boot/.
[17] ORCID I. [accessed 2017 May 11]. ORCID: Connectiong Research and Researchers. https://orcid.org/.
[18] The Apache Software Foundation. [accessed 2017 Jun 2]. Apache Solr. http://lucene.apache.org/solr/.
[20] W3C. [accessed 2017 Jun 2]. XML Path Language (XPath). [place unknown]: [publisher unknown]. https://www.w3.org/TR/xpath/.
[21][35] Highcharts. [accessed 2017 Jan 28]. Interactive JavaScript charts for your webpage. http://www.highcharts.com/.
[22] Kotamraju J. 2013. Java API for JSON Processing: An Introduction to JSON: The Java API for JSON Processing provides portable APIs to parse, generate, transform, and query JSON. [accessed 2017 Jan 19]. en. http://www.oracle.com/technetwork/articles/java/json-1973242.html.
[23][34] @mdo, @fat. [accessed 2017 Jan 28]. Bootstrap: The world’s most popular mobile-first and responsive front-end framework. http://getbootstrap.com/.
[24] the LaTeX Project. [accessed 2017 May 11]. LaTeX: A document preparation system. https://www.latex-project.org/.
[25] CTAN Comprehensive TeX Archive Network. [accessed 2017 Jun 2]. Paket koma-script: A bundle of versatile classes and packages. https://www.ctan.org/pkg/koma-scriptlang=de.
[26] CTAN Comprehensive TeX Archive Network. [accessed 2017 Jun 2]. Paket hyperref: Extensive support for hypertext in LaTeX. https://www.ctan.org/pkg/hyperref.
[27] Highcharts. [accessed 2017 Jun 2]. Command Line Rendering. https://www.highcharts.com/docs/export-module/render-charts-serverside.
[28] Node.js Foundation. [accessed 2017 Jun 2]. Node.js. https://nodejs.org/en/.
[32] The Apache Software Foundation. [accessed 2017 Jan 19]. Apache Shiro: Simple. Java. Security. https://shiro.apache.org/.
[36] Vladimir Agafonkin. [accessed 2017 May 11]. Leaflet – a JavaScript library for interactive maps. [place unknown]: [publisher unknown]. http://leafletjs.com/.
[37] OpenStreetMap contributors. [accessed 2017 May 11]. OpenStreetMap. http://www.openstreetmap.org/.
[38] Mapbox. [accessed 2017 May 11]. Mapbox: The location platform for developers and designers. https://www.mapbox.com/.
About the Author
Eike T. Spielberg (ORCID: 0000-0002-3333-5814) studied Chemistry at the Friedrich-Schiller-Unviersity in Jena and now works as subject librarian and scientific co-worker at the University Library Duisburg-Essen in Germany since 2015. He develops tools for automation of library workflows and for new services within the context of bibliometrics. His email address is eike.spielberg@uni-due.de.

Subscribe to comments: For this article | For all articles
Leave a Reply