by Craig Boman and Ray Voelker
Conducting a Library-wide Inventory with Google Apps
In the summer of 2015, the University of Dayton Roesch Library needed to scan, reshelve, reorder, or restore item statuses for all of the books in our circulating library collection. The previous library-wide inventory was conducted the summer of 2008 or “that summer when the library air conditioning went out.” At that time, our predecessors used a portable Percon barcode scanner and barcode data was imported through the ILS inventory module (then III’s Millennium, now Sierra). Even when the shelves were scanned in the right order and the Percon battery did not die, finding a computer with a serial port to get the data off of it was not easy. Although there are certainly better upgrades available to older Percon scanners, in 2015 the library did not have the budget to buy lots of devices for an inventory. In our department (Information Systems and Digital Access), we did, however, have spare USB barcode scanners, some spare laptops, and a handful of student workers we could hire.
To be entirely honest, we started our 2015 inventory with the question, “What if we use Google Sheets for our library inventory?” Discussions of why and how you should do a physical library inventory (Sung, Whisler, & Sung, 2009) and how you should avoid doing a physical library inventory (Loesch, 2011) all served as evidence which encouraged us to further explore alternatives (like Sheets) for our new inventory.
We made a decision to explore a Google Sheets-based inventory based on the flexibility it would provide to create better inventory data than most vendor-supplied inventory products; products which we, and many other libraries, cannot afford. This article will not be a ROI study but more of a case study of the tools and methods we used to conduct our own physical book inventory. It also should be clear that we are not advocating this as the best way to conduct a library inventory; this is simply a method that we chose to use at the time, and one that worked reasonably well for our defined goals.
Identifying Project Needs and Requirements
When we began thinking about doing a library-wide inventory of the University of Dayton Libraries’ public collections we naturally started examining the tools that were available to us in the Integrated Library System (ILS) in use at our institution. At the time of writing this article, that system was Sierra ILS. Thanks to the 2008 inventory, we had some documentation from that process to work with. As we examined the documentation, we were quickly able to identify several problem areas with the methods and tools used for that process. While we were both with the library during the previous inventory, we were in different roles at the time and therefore not involved with the inventory planning process, so we were excited to take an ownership role in this 2015 inventory. We wanted to get started with the process of streamlining the inventory to make it more efficient right away.
The first thing that we noted from our previous inventory was that the method was slow, laborious, and prone to scanning errors and data loss. The Percon barcode scanners used had to be of a very specific type, and were, for all intents and purposes, pretty dumb devices. First, they had no way of telling the user the last series of barcodes scanned. If the person scanning got distracted and lost their place scanning, they had no way of knowing where to pick back up with scanning on the shelf.
Another downside was the small amount of memory built in for storing the scanned barcodes. This meant that the data had to be “off-loaded” from the device frequently, often while scanning the middle of a range or some other inopportune time. The task of moving the inventory data from the device to the ILS system had to be done by a staff member—one with full permissions to edit and update records—and had to be done at a workstation that had the ILS system client installed. This meant that capable staff had to be available at the time any scanning was taking place to perform these importing and updating functions. Student workers had to sit idly by and wait for these tasks to be completed before they could get back to their inventory scanning work.
On top of these severe limitations, the scanners were unreliable; on several occasions—either through some user error or malfunction of the scanner itself—entire scanning sessions had to be repeated, wasting time and effort. We wanted something better, and we were determined to develop the tools and methods to make it so.
After examining the previous methods used for conducting an inventory, we concluded that our needs could be broken down into the following three categories :
- Accuracy/Reliability: If what is on the shelf at the time of scanning is not accurately and consistently captured and recorded, then what was the point of even doing an inventory? We also wanted to minimize any chances of data loss and corruption. Additionally, we wanted to be able to quickly identify any problems with the scanning process—in real time—if at all possible.
- Speed: Time is a precious commodity, and we wanted to perform this inventory as quickly as we possibly could. Since this was an academic institution, carrying out our work over the course of a summer and finishing up before the start of the fall term was ideal.
- Ease of use: We wanted to un-complicate the process as much as we possibly could for everyone involved. For the individuals doing the scanning, it should be easy to do the scanning, see what was scanned, and know what still needs to be scanned. Also, the individuals doing the scanning should be able to do so with almost zero training. From the perspective of the library employees managing the inventory, it should be easy to assign work, examine the accuracy of that work, and then finally act upon that inventory data.
In order to successfully capture, examine, and act upon the inventory data, we felt that we needed to answer two very important questions: first, how could we connect to the Sierra ILS to get synchronous data out during our scanning process, and secondly, what was to be captured from the ILS for each scanned barcode?
The How
In answering the first question, how, we knew that the Sierra ILS conveniently provides a method of connecting to the back-end database by way of a feature called, “Sierra Direct SQL Access”. This feature provides read-only access to the database tables by way of database table “views”, which expose the live catalog data running on Sierra’s PostgreSQL database. While this data is read-only, it still provides us with a great way to extract what we need from bibliographic and item record data associated with a barcode in real-time. The real-time aspect is important if we are to consider the inventory process to be a “snapshot” of the state of the shelf at the moment in time that we examined or inventoried it.
Since the database server runs the popular PostgreSQL object-relational database management system, many different software libraries for connecting to this type of database exist for different programming languages. This gave us a great deal of flexibility in selecting a programming language to script and process the queries we needed to perform on the database. We picked the PHP language as we had a great deal of background with the language, having done other development projects it.
The second step after getting the data out of the database, is getting the data into the spreadsheet. As mentioned previously, Google Sheets can be augmented with Google Apps Scripts. This makes it possible to create “triggered” events that can call additional custom functions to make external API calls; our custom PHP RESTful API is one such API that, when called, queries the database and returns formatted results that can be processed by Google Apps Scripts. We will discuss more specifics on these two scripts and how they work together a little bit further into the article.
The What
As for the second question, what, we determined that the following data about the item would be essential and should be recorded when each item was scanned:
- Item Barcode
- Normalized Call Number
- Item Location Code
- Item Status Code
- Check Out Status (date due)
With that data, we are able to identify and address several problems rather quickly.
First, by checking Item Location Code we were able to identify books that did not belong in the section, or did belong but had incorrect information in the catalog. Some of the item record data was fixed as a result of this discovery. With the Status Code we were able to flag items that have any status code other than “-”, which in Sierra indicates that there is some other status other than Available. Items on the shelf should all have an available status.
After a short period of testing, we later determined that some of the books on the shelves were still checked out; checking the Check out status proved to be essential as part of this process as well. With Normalized Call Number, we are able to sort the sheet either ascending or descending to determine the correct shelf order of the items scanned and to pull items that did not belong in the range.
It is worth mentioning that using unformatted (or non-normalized) Library of Congress (LC) Call numbers in a spreadsheet is problematic because they do not follow normal lexicographical sorting methods used in spreadsheet applications like Google Sheets. In order to make LC call numbers alphabetically sortable, the call numbers must be normalized. Normally, Sierra performs such a normalization—storing the value in the database for easy retrieval—but there are certain circumstances where this may not be the case—when retrieving call numbers directly from MARC fields for example. A possible solution to this problem is to incorporate a function that filters the call number data, normalizes it, and then returns the normalized form to our application. Our normalization function is available for those in need of such a feature.
The following additional data about items were also identified as being helpful to the inventory process:
- Volume Number
- Item Record Number
- Title
- Shelf Position
- Date Scanned
- Sheet Name (or Range Number)
Volume, Item Record Number, and Title come from the database. Shelf Position, Date Scanned, and Sheet Name are produced by the spreadsheet itself. The entire query we developed to return all this data can be found here: https://github.com/rayvoelker/2015RoeschLibraryInventory/blob/master/sql/inventory_barcode_query.sql
Implementation and Scripts
Server Considerations
We decided to write the script to fetch the data from the database using PHP and that the script should act as a RESTful API endpoint. This decision made it much easier to write the Google Apps Script as it has simple functions built-in for interacting with RESTful API endpoints. And since this API is RESTful, that meant that we needed a web server to host and execute the PHP. For that purpose, we chose Linux (Ubuntu Server), the Apache HTTP server, and of course PHP, installed as an Apache Server Module. (if you have a domain certificate in place, ports 80, or 443 will need to be open to the Internet so that Google services can interact with the endpoint. Google has more information on this requirement.)
RESTful API Endpoint
We picked a RESTful architecture for our method of developing the script for a number of reasons. First, the architecture makes it easy to test and use the script. Secondly, this is ultimately a web application, and as such, certain components of the application (Google Apps Scripts for example), are designed to easily interact with RESTful endpoints. As a quick example to demonstrate how this RESTful API functions, and especially for those not familiar with the method: if we were to scan the barcode of an item on the shelf, we would send the following HTTP GET request to the API. Since the request is a standard GET request with no authentication, it is easy to test this in a web browser.
http://127.0.0.1:8080/?barcode=35054031024744
Figure 1. An example of a RESTful API HTTP GET request
The output of this GET request is in the JSON format, and would look similar to Figure 2.
{
    "barcode":"35054031024744",
    "item_record_num":"i9233953a",
    "item_record_id": 450976172208,
    "call_number_norm": "PZ    7 G1273 GR 2008",
    "call_number_050": "PZ 7 G1273 GR 2008",
    "volume": null,
    "location_code": "mdju",
    "item_status_code": "-",
    "best_title": "The graveyard book",
    "due_gmt": null,
    "inventory_gmt": null
}
Figure 2. An example of the JSON response produced from the PHP-based RESTful API HTTP GET request
A few things to note that are important about that script before we move on: first, we want to “sanitize” the barcode input to be searched based on the type of barcode that is used at the institution. This is as simple as limiting the length of input as well as the type of characters accepted as the “barcode” argument in the HTTP GET request. If implementing this for another institution, we advise modifying the code to accept barcodes that fit the description of those in use. The practice of input sanitization is much more important when making updates—making modifications to a database or inserting new items for example—but is still a good habit to maintain. Additionally, you may want to change the query for the non-normalized call number (call_number_050 in the SQL query, and JSON results) to reflect local cataloging practices or to get the non-indexed call number. Some Sierra ILS sites have reported that the call number may not appear in the “call_number_norm” field; a support call to the ILS vendor may be required to remedy that.
Google Apps
The majority of the inventory was centered around Google Sheets and conveniently, our institution had recently transitioned to using G Suite for Education (formerly called Google Apps for Education), which included this easy-to-use spreadsheet tool. Using Google Sheets offered several benefits, including access for every student, faculty and staff member from their University account and easy sharing options. This made assigning spreadsheets to student workers a quick and easy task for the inventory coordinator. Lastly—and perhaps most importantly—Google Apps Scripts effectively allowed us to construct our inventory application almost entirely from within the Google Sheets tool—pretty powerful stuff!
As an added bonus, Google Sheets works well in “offline” mode. This is important, since taking a laptop and USB scanner into the stacks and then losing wifi access still means that you will be able to complete the task of scanning barcodes into the Google Sheet. Data placed into the spreadsheet are automatically synced to the cloud when network access is restored. Unfortunately, this requires an additional manual step of having to run a command from the Google Sheet that fetches the additional information from the ILS after re-establishing a network connection. Luckily, that task is a relatively simple one, especially when compared to the re-scanning that the previous inventory method often required. The “cloud-based” nature of Google Sheets is also a positive as it helps to reduce the possibility of data loss as well as data corruption.
Google Apps Script
Google Apps Script, with its various custom functions, is the method that “triggers” the import of bibliographic and item data on each barcode scanned into Google Sheets. Below we have crafted a simplified example of the “onEdit()” trigger method that is assigned to a Google Sheet to demonstrate how we handle importing data.
function onEdit(e) {
  try {
    var value = e.range.getValue();
    var url = 'http://domain.edu/inventory_api/v1.0/barcode.php?barcode='
      + value;
    // populate column B with the API call
    e.range.offset(0,1).setValue('=\"' + url + '\"');

    // make the API call, and then parse the results into a JSON object
    var result = UrlFetchApp.fetch(url);
    var json_data = JSON.parse(result.getContentText());

    // populate column C with the title (replace double-quotes with escaped versions)
    e.range.offset(0,2).setValue('=\"' +
      json_data.best_title.replace(/"/g, '""') + '\"');
  } // end try

  catch(e) {
    // TODO:
    // something more to catch errors
  } // end catch
}
Figure 3. Google Apps Script for the Google Sheets onEdit trigger
In this simplified example, the Google Apps script reads the value from the cell when data is placed there, forms the URL string (appending that cell value as the argument), then passes it to the built-in Apps Script service UrlFetchApp. This service then interfaces with our PHP RESTful API operating on our web server which produces the JSON response. The data is then parsed into the “json_data” variable where part of it (“json_data.best_title”) is then finally output back to the spreadsheet.
When scanning a single barcode (R008818288 in the example) into the sheet (with the above trigger enabled for the sheet), we would see the two cells (under column B and column C) populated with data as demonstrated in Figure 4.
 Figure 4. An example of data output to a row in Google Sheets
Figure 5. Example of scanning process 2015 Roesch Library Inventory : Scanning
In addition to the OnEdit method discussed above, we also used the Google Apps script to perform a handful of other important inventory functions as well. These functions included a method of “fixing” missing column data (for when the application was operating in “offline mode” and not collecting additional bibliographic and item data from the external API). This method was often used by the staff member after the student submitted the finished sheet of scanned barcodes, by selecting this function from a special inventory menu from within the sheet itself, as illustrated in Figure 6.
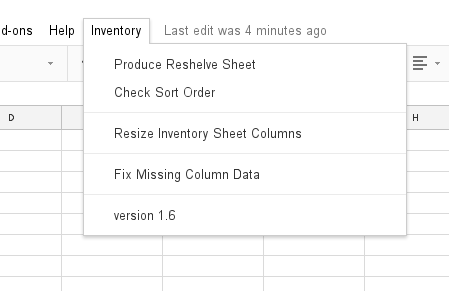
Figure 6. An example of the menu produced by the custom Google Apps Script
A second custom function, called “Produce Reshelve Sheet” (seen as a menu option in Figure 6) would produce an additional sheet in this spreadsheet based on two sets of data contained in separate sheets: the inventory “snapshot” and the inventory “shelflist”. The “snapshot” consists of our scanned item information, and the “shelflist” consists of a list of items we expect to be on the shelf. That is to say, given the Item Location Code and the start and end Normalized Call Numbers we produce an SQL query (https://github.com/rayvoelker/2015RoeschLibraryInventory/blob/master/sql/create_shelflist.sql), importing the results into the spreadsheet.
Once that data is imported into the sheet and scanning on the main inventory sheet is completed, running the “Produce Reshelve Sheet” function would take these two sets of data and perform something similar to an SQL join, matching the items from “shelflist” (left) with the items from the “snapshot” (right). This will tell us what items we found in our shelflist or items we expect to be on the shelf, as well as which items we did not find on our scanned shelf. Figure 7 should help to further illustrate the concept. The overlap in orange in the second image represents the items appearing in both lists and therefore “found”.

Figure 7. An example of the left join performed by the script to help users determine what items should and should not be on the shelf
Figure 8. Creating and sorting the reshelf sheet
Lastly, there is an additional custom function that can be run from Google Sheets called “Check Sort Order”. The intended use of this function is to create visual indications on the “reshelve” sheet when items are on the shelf in incorrect shelf order based upon the item’s assigned call number (a demonstration of this can be found in the same video in Figure 8, starting at the 30 second mark.
The full Google App Script that we used in this project is included at the end of this article. For more information on using Google Apps Script and setting up triggers please see the Google Apps Script documentation.
Extending Google Sheets and Getting Started
With the web server set up, the types of data to pull identified, and the Google Apps script ready, we were on our way to getting this inventory started. Soon there would be large amounts of inventory data (this is sort of the point though, is it not?). Again, Google Sheets shines in its ability to organize; we were able to maximize features available to us through Google Sheets to help us extend the use of the application to organize all of our scanned inventory data.
Google Sheets has seemingly endless methods of transporting inventory spreadsheet data between different sheets. Every Google Sheet has a sheet ID in the URL string, evident in Figure 9 between the final set of forward slashes:
https://docs.google.com/spreadsheets/d/1nJdQ06ZFV0jaZ5bjwyLZumRRA44W4IldnqP6ORLPLm8/
Figure 9. An example of the Google Sheet ID, and the method of linking to it
Using this sheet ID, we built a Google spreadsheet-based inventory data dashboard which aggregates metadata from all of the Google Sheet ranges currently being scanned into one spreadsheet, creating a simple user interface in the process. In our Inventory Dashboard, we were able to assign ranges to students in one column, and note when the range scanning started and ended in another column. Additionally, using sheet IDs, we could view the total number of books we anticipated in a range (based on books between the start and end call number range pulled from our ILS), and compare that against the actual number of scanned books on the range. While the ranges were scanned, we also counted item statuses that were anything other than available (“-” in our case). The moment the range had been completely scanned, we had a count or report of exactly how many books needed attention, and the specific types of statuses encountered in that range.
Early versions of our Inventory Dashboard were simple. Through various iterations, our dashboard developed into what it is today: a comprehensive and practical at-a-glance workflow, management, and reporting tool (Figure 10).
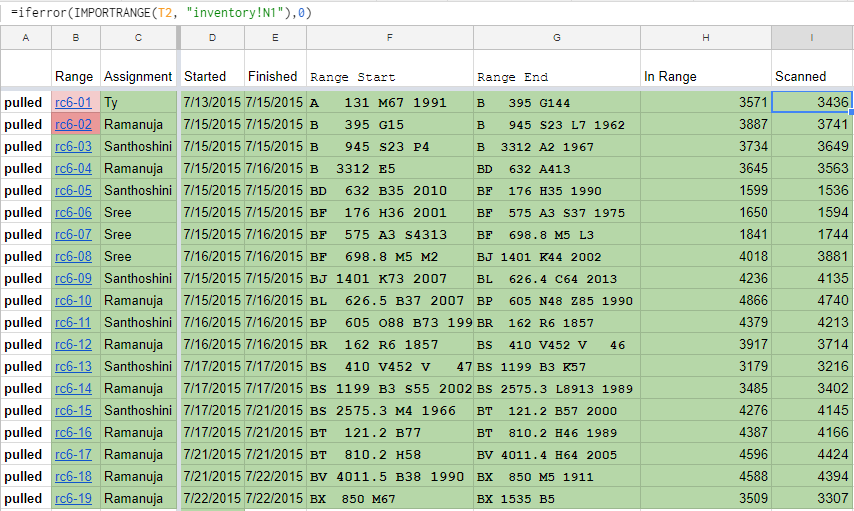
Figure 10. Google Sheets-based dashboard for location “rc6”
In Figure 10, you can see one of the formulas which is using the sheet ID stored in cell T2 to count the total rows of data in column N from the sheet named “inventory”. At a glance, we can see that the total number of scanned books in range rc6-01 has 3436 books, but we were expecting 3571 books. In some cases you may end up with more books in the range than you expected, for various reasons.
Continuing into the spreadsheet (Figure 11), we can see more specific information about the range rc6-01 starting in column J:
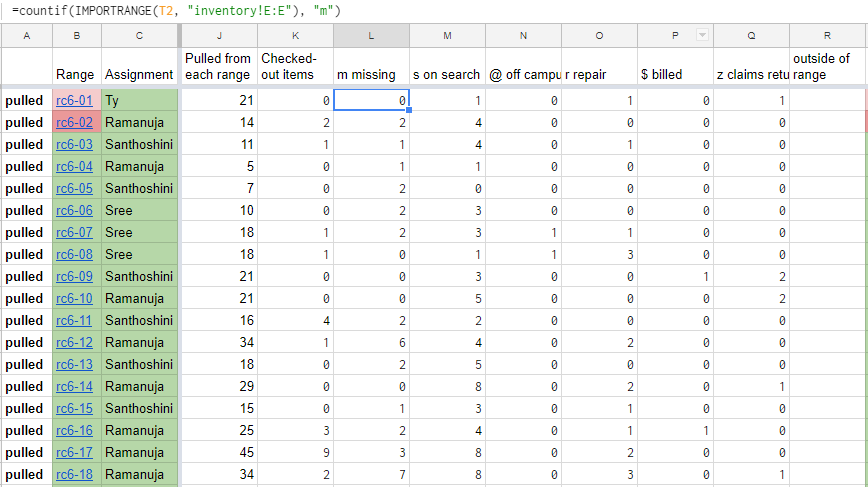
Figure 11. Google Sheets-based Inventory Dashboard for location “rc6”; additional columns shown
In Figure 11, we can see from column L and the formula displayed at the top of the image we are again using our sheet IDs stored in column T in the dashboard to count the total number of books with a status of missing or “m” in column E of the sheet called “inventory”. Similarly, all columns on this dashboard between J-Q are using some combination of a spreadsheet function, countif(importrange()), to create reports about our inventory data while we are scanning, without delay or manual intervention. We can then use these data to justify to our stakeholders the value of our inventory by showing that we pulled a specific number of books from each range for various reasons including: items had bad status codes, were not in correct locations, etc.
Google Sheets Limitations
Using our Inventory Dashboard to manage inventory workflows and create post-inventory reports is not without some limitations. To allow one Google spreadsheet to import data, or in any way access data from another Google spreadsheet, Google requires spreadsheet users to grant permission to access data stored in another Google spreadsheet. There may be a way to script this permission-granting using Google app scripting, but at the time of our inventory we were manually interacting with a row which contains an importrange() formula to permit it to access another spreadsheet’s data. For other cynical thoughts about Google’s use of this permission feature, see also: any Google spreadsheet support forum.
Additionally, when we conducted our inventory, we manually created every Google spreadsheet for the project. We had 150 ranges (3000–5000 books each) for which we needed to create a spreadsheet for each range, and put that sheet ID into our dashboard to pull in data from those inventory spreadsheets. In our case, with a brief bit of instruction, our fantastic student employees were quickly trained to make a copy of a previous range’s spreadsheet they had just finished and use it to continue scanning the next range. A solution to consider for next time would be to create a Google Apps script that would create a new spreadsheet and set it up automatically.
Getting Student Workers Involved
In the course of a library inventory, it may be important to augment the actions of library staff with help from library student employees. When training library students it is important to anticipate the minimum level of knowledge necessary to successfully scan and reshelve books. Below are some recommendations for training students, in case it is helpful:
- Basic call number training–without this training, books may be pulled and reshelved again in similarly incorrect locations, making a follow-up inventory necessary. In our case, we had the advantage of being able to use circulation students already familiar with re-shelving
- Shelf orientation introduction– even after training students, within the first hour we observed a student scanning books in the wrong shelf-order into the spreadsheet. Quickly, we were able to take corrective action, which potentially saved us large amounts of additional work.
Inventory Progress
Running a library wide inventory is a major project. At our peak, we managed four student employees over three months working thirty-five hours each on average, or 140 total hours per week. Coordinators of inventories should not underestimate the amount of work that will go into an inventory or the variability of student worker progress speeds. The transparency of Google Sheets may help mitigate this variability by encouraging slower students to emulate the pace of their peers as spreadsheets are populated.
Post-Inventory
Resolving Bad Statuses
Just because your library is done scanning books in a range, does not mean you are done with your library inventory. After a range of books has been scanned, some information in our ILS had to be updated starting with the incorrect item record statuses.
Any item found to have a bad status—one without a status of “-”—was routed to the correct staff in the library who was best suited to resolve the issue. In some cases, no record was found in our ILS because we had deleted the bibliographic or item record many years prior, requiring additional cataloging. Other status issues included incorrectly shelved consortium books and books requiring reshelving in the correct order.
Getting Data Back into the Sierra ILS
Another large part of our post-inventory processes included importing the scanned barcodes into our ILS and applying an inventory note. This inventory note–applied as a global update–included where the item was scanned last (which was also the range’s Google spreadsheet title). We also globally updated the inventory date on our item records, so we know when the book was last inventoried. An added benefit of the inventory note field is that if, for whatever reason, the book was not pulled from the shelf during our inventory, all library staff had an idea of where the book was last inventoried and could reference the Google Sheet to find the location in the range where the book was scanned.
As an Innovative Sierra library, getting our inventory data into Sierra was as simple as importing a list of item record numbers as a Review File. We created a PHP-based web tool to convert our list of scanned barcodes, range by range, into item record numbers. This web application can be found in our git repository.
The web tool queries Sierra ILS and returns the list of item record numbers. In future iterations, we will pull in item record numbers and corresponding bibliographic record numbers for each book scanned in a spreadsheet. There has been some discussion of Sierra allowing for the importing of barcodes directly as a review file in future release updates, but this is not possible in Sierra v3.1, which is the latest version of the software at the time this article was published.
Communication Concerns
Similar to the conclusions reached by Kohl, Bénaud, and Bordeianu (2017), communication will always be an issue in library inventory projects. In our case, we did notice that although we were communicating well with staff in other areas, the impact of the inventory was not always communicated well to student employees who were responsible for shelving books. More information could have been communicated by the inventory coordinator to student employees directly, informing them that their reshelving work would increase dramatically during the inventory.
Additionally, a primary goal of our inventory was to communicate our progress and our findings to stakeholders before, during, and after the inventory. Even though this should be obvious, we needed to collaborate closely with our library technical services and access services (circulation) to process changes to our books. Overall, communicating our progress to our library community helped the overall project go more smoothly, and avoided stepping on any metaphorical toes.
Conclusions
Although our method worked reasonably well for our staff and the needs of the University of Dayton libraries, the needs of other libraries may be different. Having said that, we have presented a method which should be easily transported between libraries. We hope to encourage other libraries, regardless of ILS vendor, to consider the benefits described when using Google Sheets for a library inventory. As libraries continue to share methods like these, we can all benefit from local solutions moving into collaborative, open source projects. If you would like to collaborate on improving our processes, please reach out to us.
As promised, the scripts used in this project, as well as a short presentation that was prepared for OH-IUG in 2015 can be found in the following GitHub repository.
Videos demonstrating this process can also be found in the Internet Archive.
Thanks and Acknowledgements
We would like to thank the University of Dayton Roesch Library and our supervisor at the time of this inventory, Fran Rice, for allowing us the opportunity to develop this method, and carry it out. Ray Voelker would like to thank everyone at Roesch Library who had to put up with him during the development of this project. Also we would like to thank all of the student workers whose patience with us helped make this project possible; they did all the heavy lifting too.
About the Authors
Craig Boman (bomanca@miamioh.edu) is an Assistant Librarian and Discovery Services Librarian at Miami University libraries. Previously he was at the University of Dayton Libraries for 7 years, most recently as the Application Support Specialist. Additionally he is a Ph.D student in higher education leadership at the University of Dayton. Read more at his website: https://craigboman.github.io/
Ray Voelker (ray.voelker@gmail.com) is currently the ILS Developer and System Administrator for the Public Library of Cincinnati and Hamilton County. He was previously with the University of Dayton Roesch Library for nearly 17 years, where he more recently served a role as Application Developer. https://github.com/rayvoelker
References
Kohl, L., Bénaud, C., & Bordeianu, S. (2017). Finding Shelf Space in an Academic Library: A Multifaceted Approach. Technical Services Quarterly, 34(3), 268-282. doi:10.1080/07317131.2017.1321378
Loesch, M. F. (2011). Inventory Redux: A Twenty-First Century Adaptation. Technical Services Quarterly, 28(3), 301-311. doi:10.1080/07317131.2011.571636
Sung, J. S., Whisler, J. A., & Sung, N. (2009). A Cost-Benefit Analysis of a Collections Inventory Project: A Statistical Analysis of Inventory Data from a Medium-sized Academic Library. The Journal of Academic Librarianship, 35(4), 314–323. https://doi.org/10.1016/j.acalib.2009.04.002

Subscribe to comments: For this article | For all articles
Leave a Reply