By Lukas Klic, Matt Miller, Jonathan K. Nelson, Cristina Pattuelli, and Alexandra Provo
Introduction & Data Source
First published in 1903, The Drawings of the Florentine Painters represents Berenson’s most important contribution to art history. Though the first edition was published over a century ago, it is still regularly cited and used as an authority, together with two revised and expanded editions of the catalog, in 1938 and, in Italian, in 1961. The entries from the 1961 edition describe a total of 4,051 object resources, i.e. drawings by painters active in Florence during the Renaissance. Organized in alphabetical order by artist, the records for each drawing document key elements including city, collection, title, material, dimensions and, for some drawings, bibliography and critical commentary. Between editions, some of these elements were modified (e.g., artist attribution or location) or additional information was added; the later editions included more drawings and expanded on Berenson’s commentary. Although standardized cataloging practices for works of art were not in place at the time Bereson was compiling the works, the records in The Drawings of the Florentine Painters are generally consistent in their structure and metadata within each edition. Given concerns about space on the printed page, numerous abbreviations are used in the 1938 and 1961 editions. Figure 1 shows various examples, some barely comprehensible today, such as “Sp.” for the drawing technique “silverpoint”.
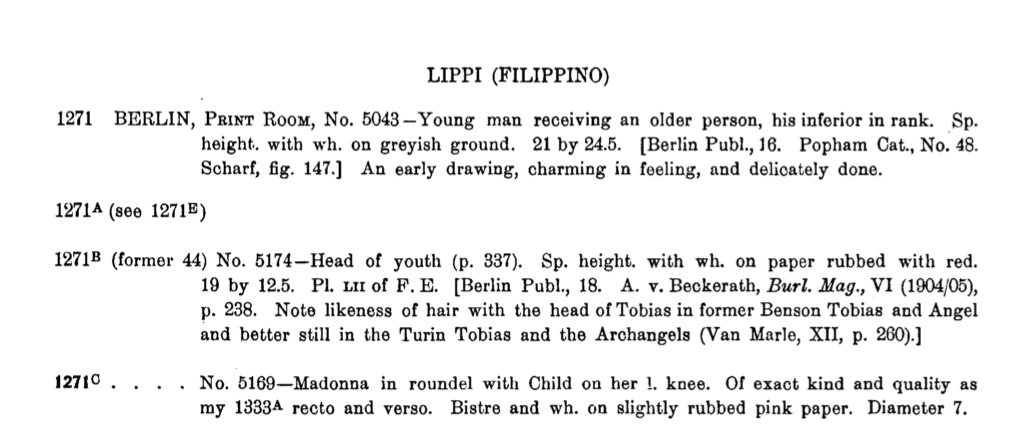 Figure 1: Records of drawings by Filippino Lippi from Berenson’s catalog, 1938 edition.
Catalog records, the information source for our project, were of course first made available on the printed page. The original readers could detect and (usually) understand the abbreviations, as well as various discrepancies, inconsistencies, or omissions. For example, one drawing in the 1961 edition lacks a catalog number; it became “0000000-Berenson” in our dataset (Figure 2).
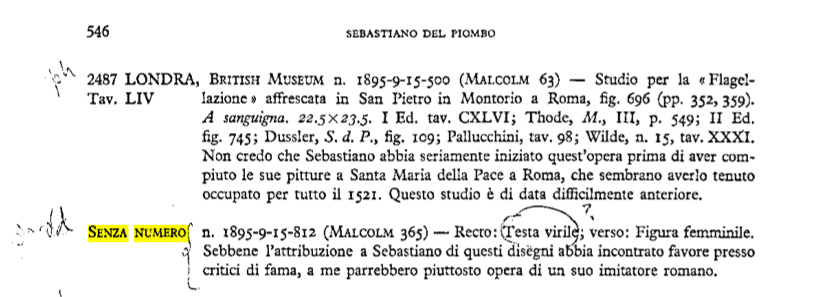 Figure 2: Unnumbered record from Berenson’s catalog, 1961 edition
Deviation from the common structure of a drawing entry is also found when multiple drawings are grouped together under a single entry. Generally, Berenson assigned a drawing entry only to individual drawings, but drawings from a sketchbook or mounted together on the same support received different treatment (Figure 3).
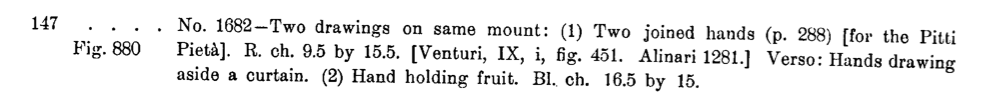 Figure 3: Two drawings on a single mount.
Additionally, Berenson was inconsistent about assigning catalog numbers when drawings appeared on both sides of the same sheet: the recto and verso might (or might not) receive their own entries. While these exceptions rarely reduced the overall quality of the data or the readability of the original format, they did pose significant problems for the migration and conversion of the data into a machine-readable or structured format.
Data Preparation
As a first step, Berenson’s records were transcribed by catalogers to tabular data, including the following elements:
- Artist name
- Berenson-assigned catalogue number
- Location (city, country, and collection)
- Collection inventory number
- Title
- Material (only the mark-making material)
- Commentary
Not included were metadata about dimensions, material support, and bibliography, as these were outside the scope for the project. Data was transcribed in the summer of 2015 in two successive phases. First, transcribers created a separate Excel spreadsheet for each artist cataloged. About 61% of the total number of records were transcribed in this phase. In the second phase, transcribers were given one Google sheet each in which to work. New columns were added, and transcribers were asked to use a slash [/] between multiple data points in the same cell to facilitate data processing.
Data Processing
A considerable amount of cleaning and normalization was needed to get the source data ready for LOD conversion. Indeed, data cleaning constituted one of the most labor-intensive components of the entire project. Not just a mechanical activity intended to address messiness, the notion of data cleaning has deep connotations and significant implications for the scalability of a project. As Rawson and Muñoz (2016) argue, what is perceived as a mess, should be instead considered as “diversity [that] has seeped or broken into what were designed to be smoothly scaling systems.” Data cleaning requires careful consideration of the delicate balance between the need for data normalization that enables project interoperability and the benefit of retaining elements that carry complex meaning and bring diversity of perspectives. This was a tradeoff we faced in a few instances when transposing Berenson’s unique catalog data into a standardized form. It provided an occasion for extended discussion between various team members: art historians, data specialists, librarians, technologists, developers, and catalogers. Whenever possible, we preserved the uniqueness and richness of Berenson’s data. For example, we retained Berenson’s spellings of artists’ names rather than replace them with labels from external vocabularies (while allowing one to search for either spelling). However, there were instances in which the normalization of terms through controlled vocabularies was also an opportunity for data enrichment. This was the case with descriptions of techniques; term normalization, through the use of external vocabularies (Getty’s AAT) helped reconcile the many variants Berenson had employed in his entries. The semantic richness of his description of techniques and materials, however, was maintained for those terms that would not find a suitable correspondent in the controlled vocabulary. In a few instances, however, Berenson’s terms were contributed to AAT, as discussed below.
Because the data was transcribed in various stages following different guidelines, a new iteration was needed to combine and consolidate the spreadsheets. More specifically, the individual artist spreadsheets from phase one were combined into one spreadsheet, and the two spreadsheets created in phase two were combined into one. In each of these master spreadsheets, columns were split and merged and problem characters were removed from cells. The spreadsheets were saved as separate documents with successive version numbers to ensure that the data could be recovered easily if a transformation failed, needed to be modified, or produced unexpected results. AbleBits Power Tools for Google Sheets was used to manipulate the data. The following list details the transformation tasks performed in both master spreadsheets:
- Split recto and verso data in the technique, title, and Berenson comment columns into separate columns
- Removed “recto” and “verso” indicators from the cells
- Split artist attribution qualifiers (such as “School of”) in the artist columns into a separate column
- Removed square brackets
- Split techniques into separate columns
- Combined Berenson numbers and letters columns (for example, Berenson catalogue numbers like 180 A had been split into two columns)
- Split sub-collection into a separate column
Results were manually spot-checked and corrected. The two master spreadsheets were combined into one, and each individual drawing was given a unique identifier. The identifier was created based on the Berenson catalogue number from the 1961 edition. The suffix (Berenson) and padding zeros were added automatically via a Python script (for example, 000567A-Berenson). An Index Match function
=INDEX(Sheet3!B:B,match(B3614,Sheet3!A:A,0))
was then used in Google sheets to place the identifier in the correct row. The resulting column of identifiers was copied and the values were pasted in order to replace the function with the resulting values. Not all the elements processed in the original spreadsheets were included in the master combined spreadsheet. In the case of the page numbers and plate numbers from the 1903 edition, the VLOOKUP function was used to align them with URLs for JPEG scans of the 1903 edition, since multiple entries were recorded on each page.
Data Enrichment
With the identifiers in place, the data was enriched by reconciling various fields against external vocabularies. These vocabularies provide persistent identifiers and address issues of disambiguation, homographs, spelling variants, etc. Links were created to LOD controlled vocabularies including Geonames, ULAN and AAT to assign controlled values to locations (cities and countries), names of artists and artistic techniques. Table 1 outlines the elements targeted for enrichment and the methods used:
Table 1
| Data element | Vocabulary used | Enrichment method |
| City | GeoNames | Python script to call GeoNames API and compare with source data. The English spelling was used. |
| Country | GeoNames | Python script to call GeoNames API and compare with source data. The English spelling was used. |
| Collection | VIAF | OpenRefine facet feature to normalize spelling and combine terms. OpenRefine reconcile feature with VIAF reconciliation service. The spelling used in the main heading from the VIAF record was used. |
| Artist | ULAN | Python script to call Getty Union List of Artist Names API and compare with source data. Only the URI was taken from ULAN. |
| Technique | AAT | OpenRefine facet feature to normalize spelling and combine terms, but not to fetch URIs. A subject expert was consulted about terminology; one result was the use of the term metalpoint instead of silverpoint. List of Getty Art & Architecture Thesaurus URIs hand-compiled and inserted into the master combined spreadsheet using an Index Match function. |
Reconciliation work is a complex process that often requires fine tuning of a query to obtain an optimal balance of precision and recall. Although these specific methods were employed for the enrichment process, one could enrich source data with external vocabularies in many different ways. For example, one could construct a SPARQL query to run against ULAN in OpenRefine. The WikiData plugin for OpenRefine could also be used to retrieve the WikiData URI, which can subsequently be used to retrieve the ULAN or Geonames URI.
Reconciliation was completed on a separate spreadsheet, and results were then incorporated into the combined master spreadsheet by matching on the unique drawing identifier using an Index Match function. Unmatched names (e.g., due to misspelling or ambiguity) had to be matched manually. Where URIs were not available from the source vocabularies, project-specific URIs were created (e.g., for collection and artist names). In a few instances, terms were contributed to a source vocabulary (the Getty AAT), including the terms pastel (material) and metalpoint (technique).
Significantly, name reconciliation occasionally conflicted with the need to convey the historical attribution as recorded in Berenson’s catalog. For example, Berenson treated Raffaellino del Garbo and Raffaellino di Carli as two separate artists in all three editions of his catalog, but historians have since determined that the two painters should be considered the same person. Thus, ULAN contains one entry for “Raffaellino del Garbo” with “Raffaellino dei Carli” listed as an alternate name. To preserve the two identities’ distinctness and convey the philological value of the metadata, we opted for assigning two different URIs in our dataset. It was not possible to use the term ID URI that ULAN provides for the term label (i.e., the non-preferred name Raffaellino dei Carli) as it would conflict with the range of the property used to represent the relationship between the production of a resource object and the creator (CIDOC CRM property carried out by with range entity crm:Person versus Getty term ID corresponding to entity xl:Label).
Interlinking
Interlinking is the mechanism of connecting resources to external datasets. A key tenet of LOD principles, and a condition to fully meet the requirements of the 5-star rating systems introduced by Tim Berners-Lee (2006), is integrating a dataset with links to external resources; this enables the discovery of related data. In addition to the enrichment described above, we associated our project records with those owned by the British Museum. This was achieved by querying the British Museum SPARQL endpoint through OpenRefine, matching the museum inventory number from both datasets.
We began with a SPARQL query on one specific inventory number:
SELECT ?objectId
WHERE
{ ?id rdfs:label "1895,0915.454".
 ?objectId ecrm:P1_is_identified_by ?id
}
After running this query, we found that many of the inventory numbers (created in the late 19th and early 20th centuries) had multiple objects assigned to them. We were able to further refine our query by adding a qualifier of object type:drawing
SELECT  ?objectId ?objectType
{ ?id rdfs:label "1952,0405.7".
 ?objectId ecrm:P1_is_identified_by ?id.
 ?objectId bmo:PX_object_type ?objectType.
 ?objectType skos:prefLabel "drawing"
}
That query can be represented with a URL that can be retrieved from the SPARQL endpoint. Adding an option to output a JSON file, as well as replacing the inventory number with the OpenRefine “value” variable (escaped), will pass the value (inventory number) from our data to the SPARQL query. We ended up with the following query to input into OpenRefine:
'http://collection.britishmuseum.org/sparql.json?query=PREFIX+rdfs%3A+%3Chttp%3A%2F%2Fwww.w3.org%2F2000%2F01%2Frdf-schema%23%3E%0D%0APREFIX+ecrm%3A+%3Chttp%3A%2F%2Ferlangen-crm.org%2Fcurrent%2F%3E%0D%0APREFIX+bmo%3A+%3Chttp%3A%2F%2Fcollection.britishmuseum.org%2Fid%2Fontology%2F%3E%0D%0APREFIX+skos%3A+%3Chttp%3A%2F%2Fwww.w3.org%2F2004%2F02%2Fskos%2Fcore%23%3E%0D%0ASELECT++%3FobjectId%0D%0A%7B+%3Fid+rdfs%3Alabel+%22' + escape(value, 'url') + '%22.%0D%0A+%3FobjectId+ecrm%3AP1_is_identified_by+%3Fid.%0D%0A+%3FobjectId+bmo%3APX_object_type+%3FobjectType.%0D%0A+%3FobjectType+skos%3AprefLabel+%22drawing%22%0D%0A%7D&_implicit=false&implicit=true&_equivalent=false&_form=%2Fsparql'
We then used the “Edit Column” ? “add column based on Object URI” command in OpenRefine to retrieve the results in JSON format, and parsed the value using “Edit Column” ? “Add column based on this column” with the following GREL expression:
value.parseJson().results.bindings[2].objectId.value
The result is a URI from the British Museum that is the exact same object as the one from our catalog. The interlinking in our database was then obtained through owl:sameAs statements, the most frequent practice to support linked data integration across identified resources and multiple datasets.
Obtaining the object URI provided another significant advantage: we were able to programmatically retrieve all of the images. After the programmatic interlinking of our catalog to that of the British Museum, a cataloger manually enriched the remaining records in our catalog with both URLs of the drawing, and images from other museum collection websites. These resources were linked using the predicate rdfs:seeAlso. Had these other collections been made available in LOD with SPARQL endpoints, all of this work could have been performed programmatically—a testament to the value of making data queryable and open.
Data Transformation
The process of data transformation is a long process that involves many issues related to ontology selection and modeling. For the purpose of this article, we limit our description to the technical details of the data transformation phase, which was performed using 3M (Mapping Memory Manager). 3M is a web-based application developed by the Institute of Computer Science at FORTH (Foundation for Research and Technology – Hellas) that allows the user to map a source XML file to RDF using ontologies (in our case, primarily the CIDOC-CRM). ResearchSpace, a Mellon-funded project based at the British Museum, uses 3M to produce the British Museum’s linked open data and conducts workshops on how to use the software. Members of our team attended workshops in order to understand how to use the software and learn more about the CIDOC-CRM. To begin the transformation, the CSV file created during the preparation phase was converted to XML format, with column headings becoming XML elements. The resulting XML file was loaded into four separate 3M “projects” — one for each of Berenson’s editions, and one for what we deemed “project data.” Other projects were created for elements that were transformed at a later time, such as the number of the plate, i.e., a page with only one or two images, the image, and the page number data. In each of these projects, XML elements were mapped to corresponding CIDOC CRM entities and properties. Although there are a few pieces of software that have similar functionality to 3M, such as Karma, 3M was built to specifically support data transformation using the CIDOC-CRM ontology.
Complex mappings can be defined in 3M, enabling the user to include intermediate nodes and add types to entities. This feature enabled us to specify additional elements, such as a production event, which was not previously defined as a part of our dataset (Figure 4)
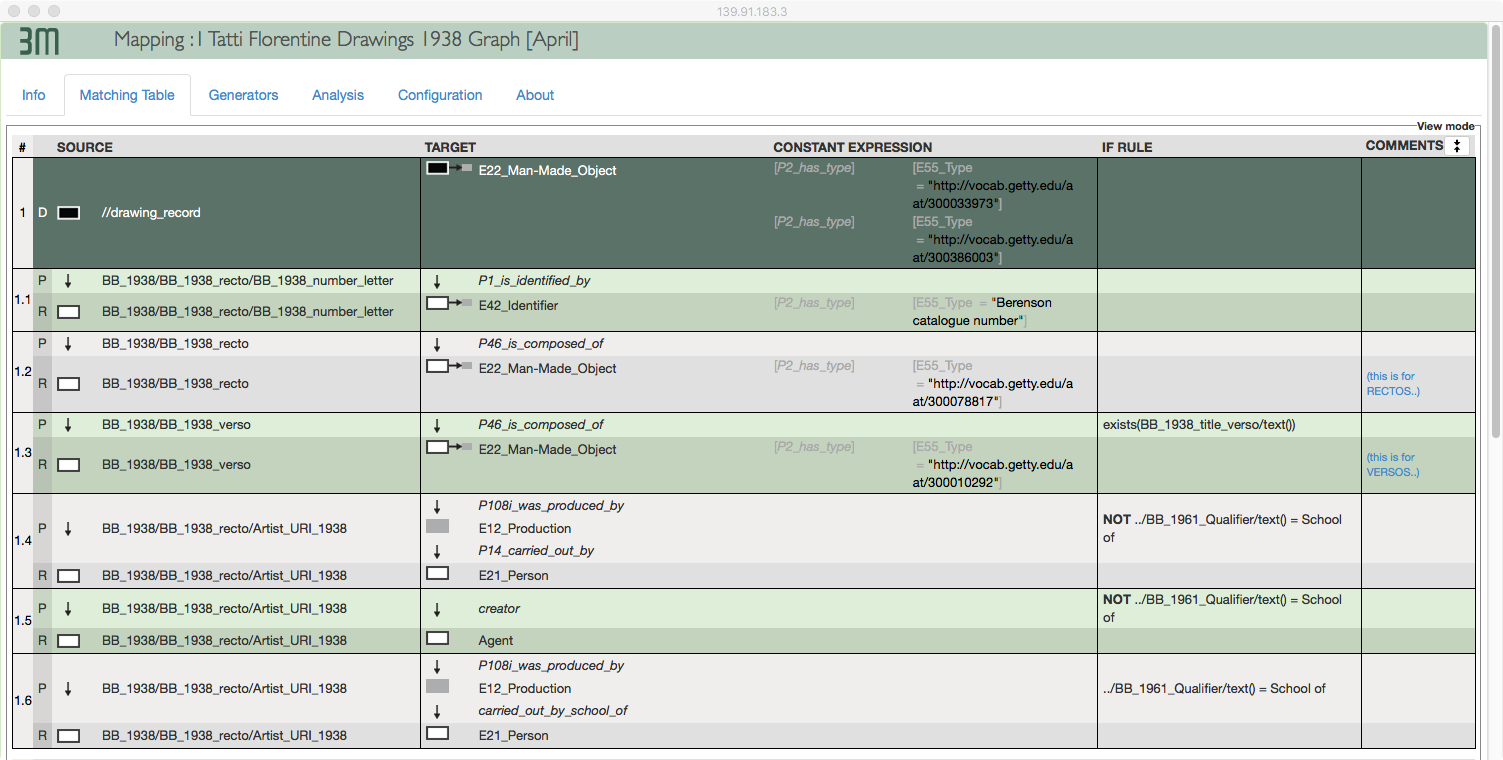 Figure 4: 3M mapping showing a production event.
3M generates URIs if they are not present in the source XML file. While URIs existed in our dataset for elements which had been enriched (e.g., location and artist names), they had to be generated for components (e.g., recto and verso, i.e., the front and back of the sheet), data elements (e.g., title, inventory number, Berenson’s catalogue number), as well as for intermediate nodes like production and identifier assignment nodes.
An XML file defining URI generation patterns was created so that the 3M application could create these URIs according to consistent and semantically meaningful patterns. Within the mappings, each entity had to be assigned a URI generation pattern from the pattern XML file. During this process, RDFS labels could also be generated using patterns from the XML file (Figure 5).
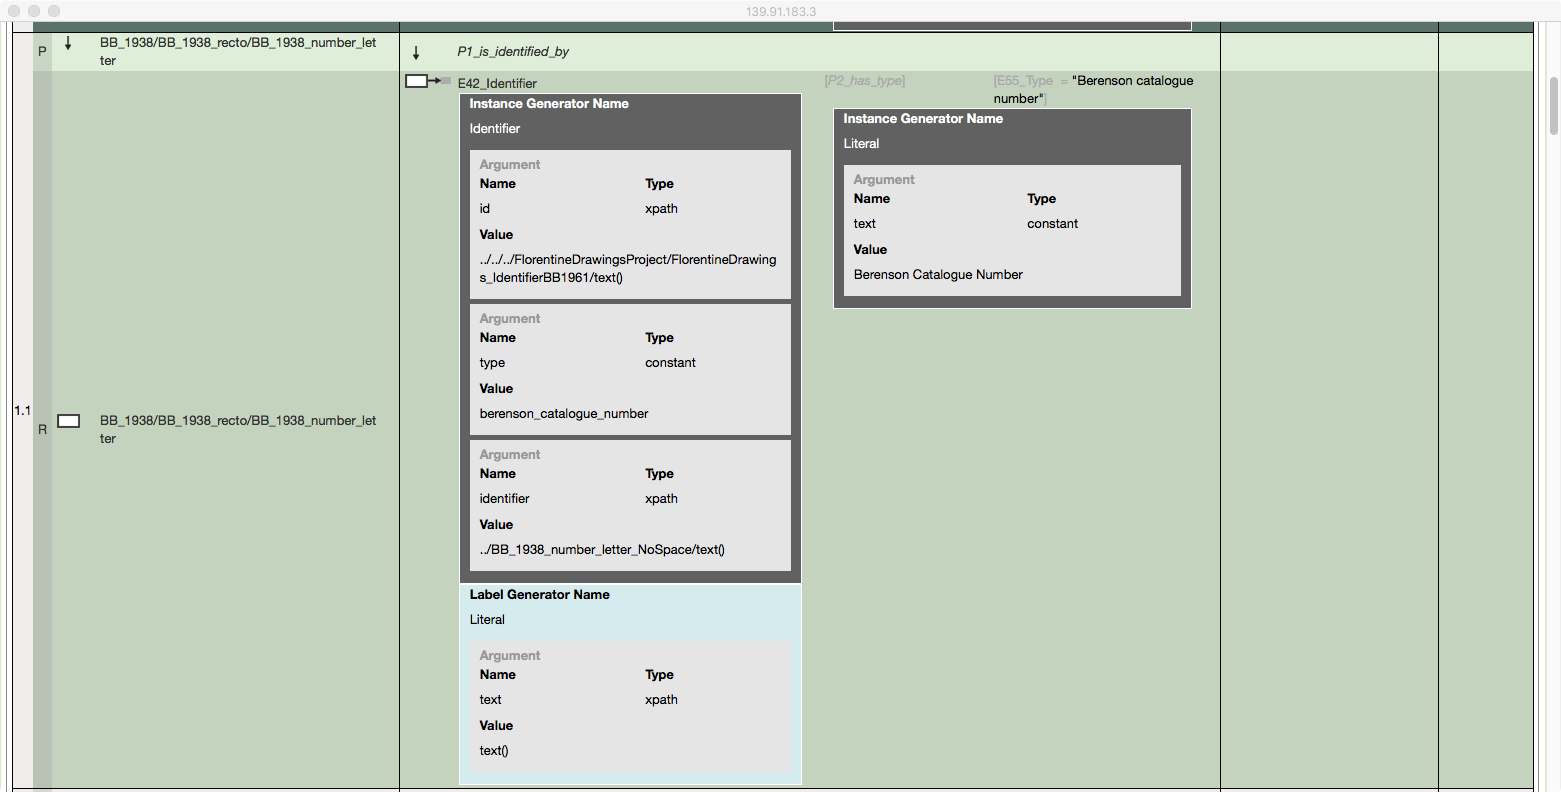 Figure 5: URI generator mapping for the Berenson catalogues number in 3M.
With the mapping and URI generation instructions in place, the data could be run through the 3M’s transformation tab. Because our source XML files were large (9.2 MB of text), we ran the transformation engine (called X3ML) locally in an instance separate from the mapping interface. The resulting files were serialized as N-Triples (Figure 6).
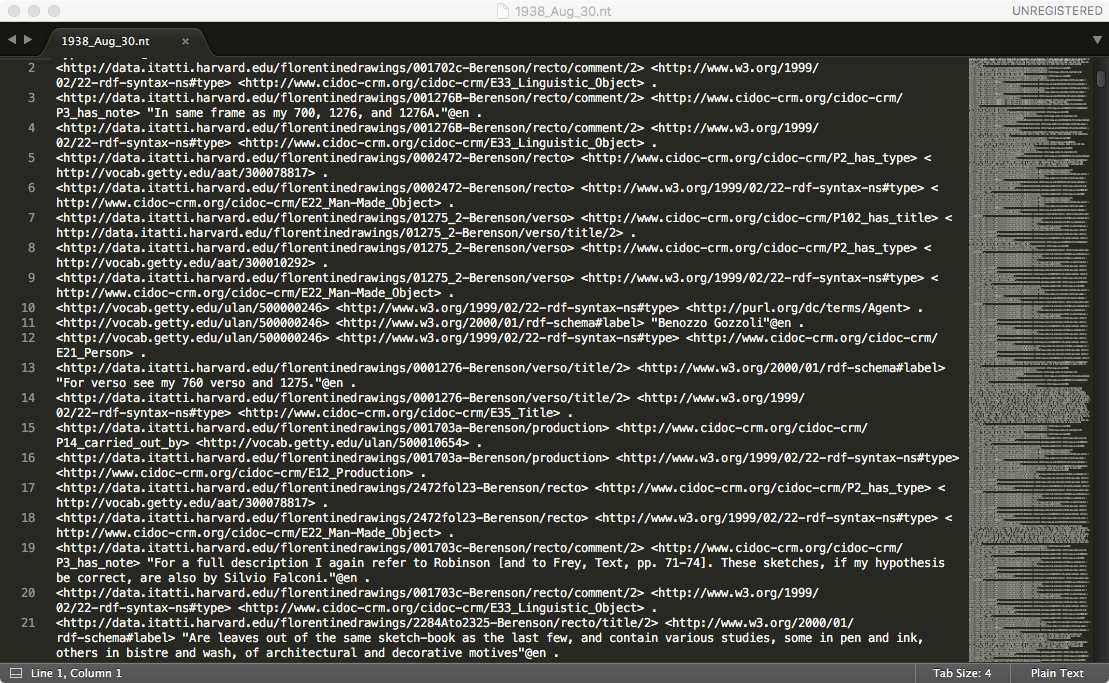 Figure 6: N-triples generated by the mapping for the 1938 edition.
Since our project used named graphs to indicate data provenance, those triples were then converted to quads using a simple python script, adding the graph URI to each triple. Using a shell command, the various quads files were then combined into a single file.
Data Publication
The master quads file obtained from the data transformation phase was then uploaded to Blazegraph, the graph database we chose to host our data. As a front-end to our data endpoint, we chose an open-source platform called Metaphactory from the company Metaphacts. This platform is tightly integrated with the Blazegraph database, providing a public SPARQL endpoint, dereferencing for our URIs, and access control functionality, among other features. Most importantly, it enabled us to construct a user interface to browse our raw data using a templating engine built with HTML5 and SPARQL queries. Metaphactory is used as middleware by the British Museum to build ResearchSpace, an end-to-end LOD system for hosting, publishing, and cataloging in Linked Data using the CIDOC-CRM ontology. At the time of data publishing, the ResearchSpace system had not been publicly released. Had we used Metaphacts to build a platform to browse our catalog, it would have been costly and it would have duplicated the work of ResearchSpace. Instead, we relied on the Metaphactory platform (Figure 7) to build a basic interface that enables data scientists to explore the data.
 Figure 7: User Interface for navigating the catalog data http://data.itatti.harvard.edu
Using Project Blacklight (Figure 8), a popular Ruby on Rails platform often used for library catalogs and digital collections, we built a separate platform that would provide an intuitive and clean interface for researchers and the general public. Project Blacklight uses a SOLR index that does not natively support RDF, so the primary challenge in customizing the platform involved mapping and ingesting our RDF data to the SOLR index. This was done with a rake task but meant that in order to have updated data, one would need to rerun the task. The rake task queries the SPARQL endpoint and builds and indexes a comprehensive Solr document for each record. This is a somewhat elaborate process as it needs to combine data from as many as four different named graphs. For example, a single record could have multiple titles from different editions or even more than one artist attribution that changed between editions. This process also queries remote data sources such as VIAF and Getty — pulling in external data based on URIs in the record. This enrichment has the potential to add additional data that could aid in search and discovery, indexing alternative name labels from VIAF, for example. The resulting Solr document has approximately 70 fields and highlights the challenge going from a graph based data model to a flat Solr index. This code is available on the project Github page: https://github.com/villaitatti/florentine-drawings
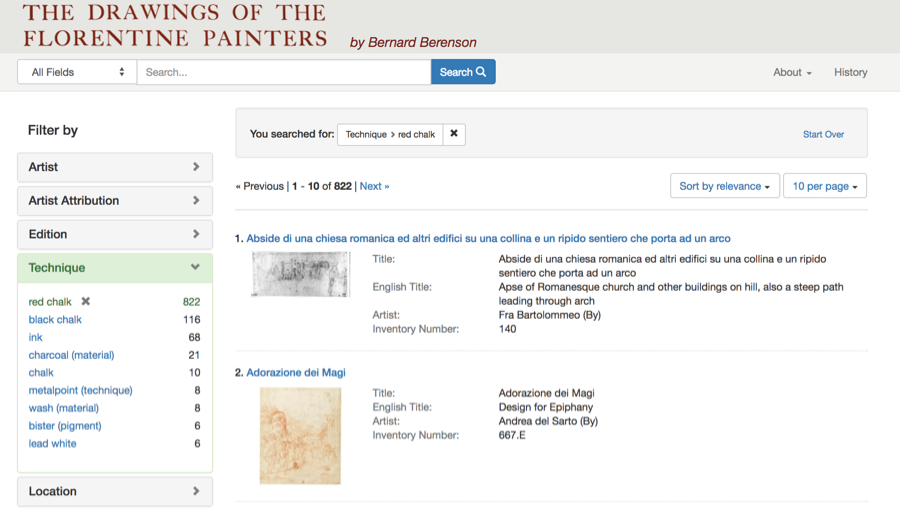 Figure 8: User interface for the Drawings of the Florentine Papers http://florentinedrawing.itatti.harvard.edu
User Interface and Design
Project Blacklight is natively designed to handle the kind of data present in our catalog, providing an intuitive and clean user interface out of the box. The main decisions we had to make addressed layout and theming. Faceted and keyword search provide easy access points to the data, while the home page provides additional points of entry for browsing the data. Each record also points users to a semantic view on the data endpoint, allowing them to browse the data either through a table of statements or a graph visualization. These features are essential for users such as data scientists who need to explore the data structure before accessing it programmatically.
To help us make decisions about the layout and theming of the user interface, we conducted a few informal user tests to study the effectiveness of element labels and generate suggestions for modifications to the interface. Users were presented with two tasks (one focused, and one exploratory) and asked to think aloud. These sessions provided insights into how best to rearrange the elements on the screen and raised content issues that we were then able to correct in the dataset.
Lessons Learned and Future Work
The project began in January of 2015 and concluded in May of 2017, although additional improvements are still underway. During this period, a series of technological developments forced us to change course. Specifically, the initial beta release of Metaphacts in January of 2017 led us to rethink the choice of the data endpoint and URI dereferencing. The possibility of building the public user interface using Metaphacts directly might have been desirable in order to maintain all elements within one system. Nevetheless, this would have hindered the possibility of incorporating developments from the ResearchSpace initiative, and to possibly add more collections in the future. Building a minimal, but functional interface in the Metaphactory software enabled us to provide access geared toward data scientists while remaining open to future developments from the ResearchSpace platform.
The data transformation phase required substantial knowledge about both the CIDOC-CRM data model and the transformation software 3M. This process required formal training, which was not always available locally. Two team members were able to attend ResearchSpace workshops on 3M and the CIDOC-CRM, but the steep learning curve of the software and the complexity of the CIDOC-CRM, meant that collaborating on this part of the project was challenging.
Managing data once the project was finished also proved to be more difficult than anticipated. It was fairly straightforward to load an RDF file to a graph database, but developing a strategy for the long-term maintenance of that data was more complex. After publishing the project, we discovered a host of issues with our data that needed to be updated. The update process proved difficult, as we had to decide either to update the RDF files and reload them every time, or perform a SPARQL update query to make changes. This brought forward new unforeseen issues regarding the “master” copy of the data. Later, these issues were partially resolved with the Metaphacts platform, which has a “form” feature that allows administrators to update data in a graphical user interface through a form input. This did not, however, address the broader issue of how to deal with data that needs to be changed in many locations across the dataset. This requires a significant time investment building SPARQL queries. Issues surrounding data management remain as tools for managing RDF Data are still early in their inception; ideally these would be included in the Metaphactory platform.
Moving forward, Villa I Tatti will seek to build out the Metaphacts platform, integrating the ResearchSpace developments and expanding their digital collections to include digital editions, photographs from the historical photo archive, and documents from the archive, all within a single end-to-end LOD platform. Any development will be contributed back to Metaphacts so that those changes can be incorporated into the open-source version. The Blacklight instance will be Dockerized and maintained in its current state as long as the current web standards and infrastructure will allow it to exist. Most importantly, as more institutions adopt LOD as a standard for publishing their data, we hope and expect to see more tools being developed and shared. This will lower the barriers to publishing datasets in LOD and allow greater discoverability and interoperability of content across the web of data.
The Drawings of the Florentine Painters dataset is made available under a CC0 License
References
Berenson B. 1903. The drawings of the Florentine painters: classified, criticized and studied as documents in the history and appreciation of Tuscan art, with a copious catalogue raisonné. London: John Murray
Berenson B. 1938. The drawings of the Florentine painters. Chicago, Ill.: The University of Chicago press
Berenson B. 1961. I disegni dei pittori fiorentini. Milano: Electa editrice.
Linked Data – Design Issues. [accessed 2017 Aug 17].
Available from:https://www.w3.org/DesignIssues/LinkedData.html.
Rawson K, Muñoz T. 2016 Jul 6. Against Cleaning. Curating Menus.
Available from: http://curatingmenus.org/articles/against-cleaning/
About the Authors
Lukas Klic is the Manager of Information Services and Digital Initiatives at Villa I Tatti – The Harvard University Center for Italian Renaissance Studies, where he co-directed the Drawings database project
Matt Miller is a librarian and technologist focusing on the intersection Linked Open Data and cultural heritage. He is a Visiting Assistant Professor in the School of Information at the Pratt Institute.
Jonathan K. Nelson is Faculty Associate at Syracuse University in Florence. Formerly Assistant Director of Academic Programs and Publications at Villa I Tatti – The Harvard University Center for Italian Renaissance Studies, where he co-directed the Drawings database project.
Cristina Pattuelli is an associate professor at the School of Information at the Pratt Institute, New York and founder and director of the Linked Jazz Project. Her current area of research is semantic web technologies applied to cultural heritage resources.
Alexandra Provo is the Digital Production Editor for the Enhanced Networked Monographs project at NYU. She was the 2015-2016 Kress Fellow in Art Librarianship at Yale University and has been the project manager for two linked open data projects: Florentine Renaissance Drawings: A Linked Catalogue for the Semantic Web and the Linked Jazz Project.

Subscribe to comments: For this article | For all articles
Leave a Reply