by Xi Niu and Bradley M. Hemminger
Background
Transaction log analysis (TLA) has been widely used as a data harvesting and analysis method when researching users’ interaction with an information system. TLA is an unobtrusive way for using a large amount of data to understand users’ interactive behavior with a system. Examples of information systems on which TLA has been used to examine users’ searching behavior are 1) Web search engines (Jansen & Spink, 2006; Jörgensen & Jorgensen, 2005); 2) Online databases (e.g., Davis, 2004; Wildemuth, 2004); and 3) Library OPACs (e.g., Chen & Cooper,2002; Lown, 2008). These empirical studies have explored the benefits and limitations of transaction log analysis techniques, however most exploration of TLA has concentrated on statistical analysis of a large volume of data.
Gaining an understanding of the typical flow of search actions during a session is difficult from only quantitatative statistical analysis. It can be helpful to instead intuitively or qualitatively explore large collections of data, to discover hidden patterns, or to identify and eliminate undesirable outlier log records. A visualization method that takes advantage of the human visual system to quickly understand complicated patterns could help. Such a visualization must also facilitate high-quality human judgment with a limited investment of the analyst’s time and enable diverse exploratory analytical tasks, like understanding the data, discerning patterns and errors, or determining indicators of the intent of an action or an individual (Thomas & Cook, 2005).
Tools for mining transaction logs and presenting generic visual charts and graphs have been previously described (for example, Gray, Badre & Guzdial, 1996; Hochheiser & Shneiderman,1999). Automatic visualization tools have also been developed for several other areas including computer monitoring logs which regularly record system errors, application errors and other details of computer performance. Example of these studies are the visual log browser by Takada and Koike (2002), graphical analysis by Eick, Nelson and Schmidt (1993), and experimental systems by Girardin and Brodbeck(1998). These visualization tools relieve system administers from manually scanning sequences of log entries and could handle a large amount of data at one time. There also exist commercial tools for mining logs for business process, such as ARIS and HP BPI (Grigori, Casati, Dayal & Shan, 2001).
This paper introduces VUTL, a method for graphic visualization of transaction logs for understanding users’ interactions, facilitating further analysis. XML is employed to store the log data while HTML is used to display the data with desired styles. JavaScript is applied to parse XML and load it into HTML.
In this paper, the transaction logs are from the faceted web catalog of the library at the University of North Carolina at Chapel Hill (UNC). This application combines free text search and facet navigation features. Our data contains over 2.5 million transaction lines logging patron interaction from Dec 2008 to Aug 2009. However, the visualization method described is flexible enough to accommodate other similarly structured transaction logs, and has been tested with logs from several other academic libraries, as well as the Phoenix (Arizona) Public Library.
Technical methods
Data Preparation
In this paper, the scripts for data extracting and processing are adapted from the scripts written by Lown and Hemminger (2009) for logs from the NC state library catalog because both are standard Apache server logs. In order to accommodate the features and functions specific to the UNC catalog, we’ve made modifications for action coding. Details about analyzing the data using Perl scripts and MySQL database are elaborated elsewhere (Niu, Lown, & Hemminger, 2009; Lown, 2008).
An “action” refers to a user’s interaction with the system. In most cases, a transaction represents a single action. Related to “actions” are the codes used to indicate generic categories of requests. There are a finite number of things that the user can manipulate when interacting with the system and therefore a finite number of codes representing actions. This study uses a combination of fine-grained and coarse-grained coding to allow flexibility in analysis.
For the UNC library catalog, 23 possible fine-grained codes and 10 possible coarse-grained codes are identified. The name and description of each action code are illustrated in Table 2 below.
| Fine-grained code of action | Coarse-grained code of action | Description |
|---|---|---|
| BeginSimpleText | TextSearch | Open the simple text search tab to begin a simple text search |
| SingleTermText | TextSearch | Submit a single word query in the simple text search box |
| MultipleTermText | TextSearch | Submit a multiple-word query in the simple text search box |
| MultipleFieldsText | TextSearch | Submit a query with words in multiple fields, typically in the advanced search page |
| BooleanTextSearch | TextSearch | Submit a query in the Boolean search box |
| EmptyTextSearch | TextSearch | Submit an empty query in whatever search mode |
| SwitchTextField | TextSearch | Switch the field (e.g. anywhere to author) under the same query in the simple search box |
| BeginAdvancedSearch | AdvSearch | Open the advanced search tab to begin a multiple fields text search |
| OpenFacet | ShowHideFacets | Click the “+” next to a facet to show the values of the facet |
| CloseFacet | ShowHideFacets | Click the “-” next to a facet to hide the values of the facet |
| ShowMoreFacet | ShowHideFacets | Click “Show more” under a list of values for a facet to show more values |
| AddFacet | ModifyFacets | Click a facet value to incorporate it into the query |
| RemoveFacet | ModifyFacets | Click “x” next to the already chosen query term to remove it |
| RefineYears | ModifyFacets | Under “publication year” facet group, manually type the starting and ending years and submit |
| NextPage | NextPage | Click a page number or “next” in the result page to view what in next page |
| SortResults | SortResults | Click “Sort By” to sort the results in result list |
| Refresh | Refresh | Click refresh button in the browser |
| ViewRecord | ViewRecord | Click a record link to view details |
| FollowupAction | FollowupAction | Click a link within a record to find the related records |
| BeginNewTitlesSearch | OtherSearch | Open the browse new titles tab to begin a new search |
| SelectNewTitles | OtherSearch | Select new titles options to search |
| BeginCallNumberSearch | OtherSearch | Open the browse by call number tab to begin a new search |
| SelectCallNumberRange | OtherSearch | Select call numbers (subject headings) to search |
Table 2. Action codes of log data
Under this coding scheme, each transaction is assigned to one of the fine-grained codes and one of the coarse-grained codes. Coding work is done automatically by a Perl script ( action_code.pl in supplementary materials) which codes each transaction by comparing two successive transactions (i.e. their URL addresses which contain the search request). The difference between the two addresses allows us to determine what happened in the current action. An additional 10 data elements are either extracted or calculated based on the original transaction logs (log_pro.txt in supplementary materials). The name and description of the 12 data elements are illustrated in Table 3 below.
| No. | Parameter | Calculated/Extracted | Description |
|---|---|---|---|
| 1 | Action_fine-grained | Calculated | Fine-grained action coding |
| 2 | Action_coarse-grained | Calculated | Coarse-grained action coding |
| 3 | Searchterm | Extracted | Text string used as a query. Extracted from “Ntt” |
| 4 | Field | Extracted | Text field within which text string was searchedExtracted from “Ntk” |
| 5 | Facet | Extracted | Facet values selected. Extracted from “Ntk” |
| 6 | Refine | Extracted | Beginning and end years specified. Extracted from “Nf” |
| 7 | Expand | Extracted | Facet group opened or closed. Extracted from “Ne” |
| 8 | More | Extracted | Facet group for which the user clicked “show more”. Extracted from “more” |
| 9 | Record | Extracted | The viewed item. Extracted from “R” |
| 10 | Time | Calculated | Dwell time (in second) between the current action and the next action. Extracted from date& time stamp |
| 11 | Visit_num | Calculated | Session number |
| 12 | Visit_step | Calculated | Step number within a session |
Table 3. The 12 extracted and calculated data elements
To illustrate the data elements, one example of the logs is given as below:
71.70.185.34 - - [09/Mar/2009:00:13:53 -0400] "GET /search?Ntk=Keyword&Ne=2+200043+206475+206590+11&N=206432&Ntt =boston+globe HTTP/1.1" 200 40035 "http://search.lib.unc.edu/search?Nty=1&Ntk=Keyword&Ntt=boston+globe" "Mozilla/5.0 (Macintosh; U; PPC Mac OS X 10.4; en-US; rv:1.9.0.7) Gecko/2009021906 Firefox/3.0.7"
The log example parsed into 12 data elements is summarized in Table 4:
| Action_fine-grained | AddFacet |
|---|---|
| Action_coarse-grained | ModifyFacets |
| Searchterm | boston+globe |
| Field | Keyword |
| Facet | 206432 (Format:Online) |
| Refine | – |
| Expand | 2+200043+206475+206590+11 (Availability+Location+Format+Subject+Publication Year) |
| More | – |
| Record | – |
| Time | 9 |
| Visit_num | 154495 |
| Visit_step | 2 |
Table 4. Single line of server log with 12 data elements
Data Visualization
This paper proposes using a combination of HTML and XML representations for visualization. The data is first stored in XML, then transformed to HTML for graphical presentation. JavaScript is used to transform an XML document to a HTML web page.
The visualization is implemented in three steps, as illustrated in Figure 1. 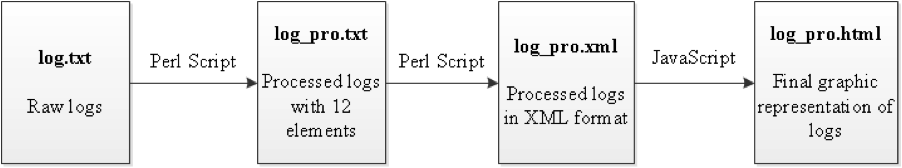
Figure 1.Visualization Process of Transaction Logs
The first step of the visualization process is described above. The following steps in the process are discussed in the sub-sections below.
Conversion of transaction logs into a well-formed XML
The processed logs with 12 data elements are converted by a Perl script to a hierarchically structured XML document, in which the root element is LOG. Each log line from the processed logs is mapped to a TRANSACTION element. The TRANSACTION element contains all the data elements in the processed logs except the coarse-grained action code, since the fine-grained code is used for the action name due to its specificity. Thus, the TRANSACTION element has 11 total child elements. Figure 2 illustrates the aforementioned example in XML format.
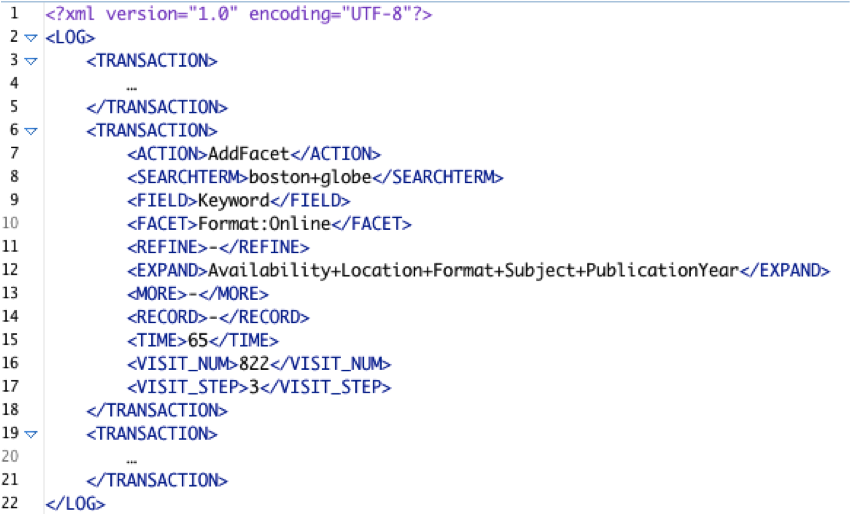
Figure 2.Tabular and XML data of logs
*The ACTION element refers to Action_fine-grained
Parsing XML using JavaScript
The next stage is to read and parse the XML document, which is done with JavaScript executed in a web browser, using the standard XML DOM api.
Graphic representation with HTML
The next step is to define the graphic representation of the XML data. A good graphical representation can help even an inexperienced user to navigate a tree structure without additional knowledge about the graphical notation used (Jelinek & Slavik, 2004). We use flowcharts to express a process simply. We avoid using too many shapes or complex layouts to keep the notations concise and easily understandable.
Every TRANSACTION element in the XML document is represented by a colored rectangle in a flowchart. Different colors denote different coarse-grained actions (described in Table 5). Actions are colored at the coarse-grained level because of the large number of fine-grained actions which make distinguishing them by individual colors difficult. For example, a green rectangle represents a transaction coded as TextSearch and a red rectangle represents a transaction of ViewRecord.. Then the 11 child elements of the TRANSACTION element are used for additional textual information displayed in each rectangle. Not all of the 11 elements are displayed for every action, because only some elements are applicable for certain kinds of actions. For example, a TextSearch transaction needs to display four elements: action, field, searchterm, and time whereas a ViewRecord transaction displays three elements: action, record, and time. Figure 3 below is an example of the TextSearch and ViewRecord rectangles. Table 5 illustrates mapping between actions and their graphics.
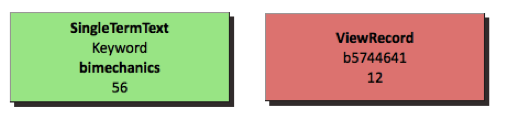
Figure 3. Graphic Visualization of TextSearch and ViewRecord
| Action code | Shape | Variables displayed in the rectangle |
|---|---|---|
| TextSearch | Green rectangle | action, field, searchterm, time |
| AdvSearch | Light green rectangle | action, time |
| ShowHideFacets | Light blue rectangle | action, expand, time |
| ModifyFacets | Blue rectangle | action, facet, time |
| NextPage | Yellow rectangle | action, time |
| SortResults | White rectangle | action, time |
| Refresh | Gray rectangle | action, time |
| ViewRecord | Red rectangle | action, record, time |
| FollowupAction | Light pink rectangle | action, time |
| OtherSearch | Dark green rectangle | action, time |
Table 5. Mapping between coarse-grained action codes and flowchart shapes and colors
Next, the colored rectangles are laid out to reflect the user’s navigational path. Rectangles could have been laid out completely vertically or completely horizontally according to chronological sequence. Here a combination of vertical and horizontal layouts is employed to indicate continuing versus new searches. If the action is refining the search, which operates on the previous result set, the action is placed horizontally to the right of its predecessor. If the action is starting a new search, which will generate a new result set, it is placed in a new row. The layout example in Figure 4 illustrates this. As shown in the figure, the second action AddFacet is placed horizontally next to the first action SingleTermText because it was refining the search results under the same keyword “biomechanics” used in the first action. The same reasoning applies to the placement of RemoveFacet. The next action SingleTermText, using a new keyword “kinetics” to generate a new result set, was instead used to start a new line to indicate a new search. 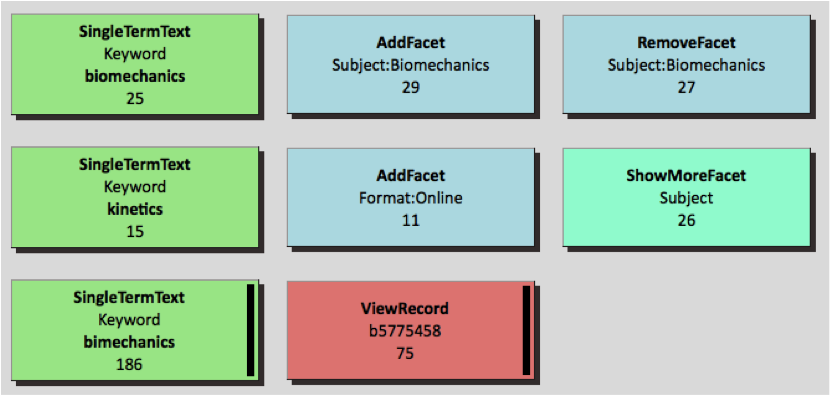
Figure 4. Horizontal layout vs. Vertical layout
In addition to the basic graphical representation, some features were added to aid understanding. First, an index, which links to each session, is built at the top of the visualization file. The index also contains some meta information about each session, including the session number and how many steps there are in that particular session. Second, for transactions with dwell time longer than 60 seconds, a black bar is appended to the edge of the rectangles to indicate that. For transactions longer than 300 seconds and longer than 600 seconds, double black bars and triple black bars are appended, respectively. And finally, some visual effects were added through CSS style sheet language to improve the aeshtetics of the display. For example, shadowing is added to each rectangle as well as 3D visual effects.
The flowchart is implemented as an HTML table and each rectangle is mapped to a table cell. By using HTML, the visualizations can be viewed with a standard web browser.
Figure 5 shows a randomly chosen search session. This is a whole search session visualized using this technique. The action sequence, types of actions, and their duration are all displayed visually. Note again that the black bars displayed for some actions indicate longer duration. For more examples, please visit http://ils.unc.edu/bmh/pubs/SearchLogAnalysis_UNC2010/log_pro.html.
There are three basic steps to constructing such graphics from raw log data:
- preparation of raw logs into processed log data
- transformation of processed log data into XML format
- visualization of the XML document.
For more details, you can visit http://ils.unc.edu/bmh/pubs/SearchLogAnalysis_UNC2010/instructions.html. 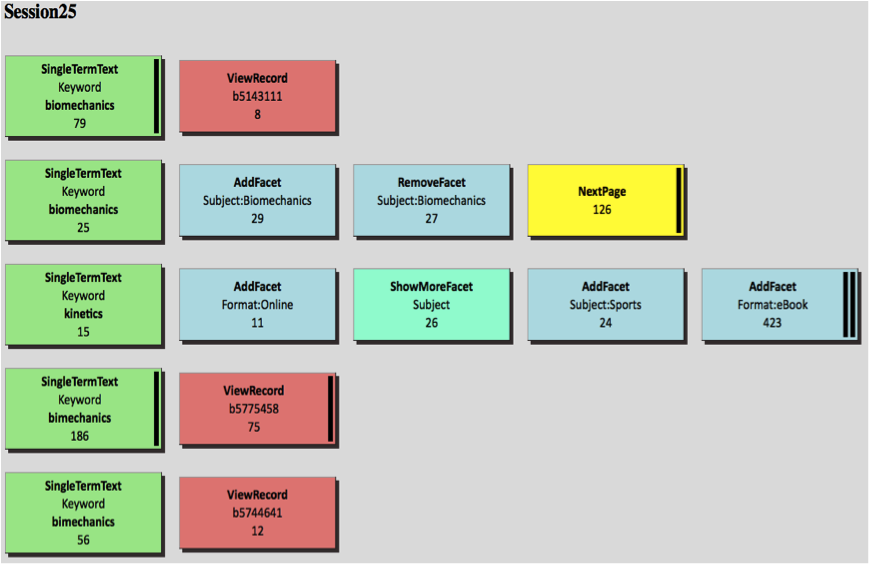
Figure 5. Example of a graphic visualization of a search session
Practical Benefits
Through visually scanning a large amount of search sessions using the VUTL, the overall sense of the search is gained and clusters of similar sessions can be identified qualitatively. To confirm the qualitatively detected clusters, some quantitative methods, such as Cluster analysis, Markov modeling and Maximal Repeating Patterns, can be employed (Niu, Lown, & Hemminger, 2009). Then the VUTL can be used to visualize search sessions for each cluster detected by quantitative methods. For example, one common pattern of interactions that cluster analysis identifies is something that we could call “FacetTextSearch,” where users formulate their queries by first typing in a text search and then applying facets. Three sessions showing this type of interaction are visualized in Figure 6. A more complete set of examples for different groups can be seen at http://ils.unc.edu/bmh/pubs/SearchLogAnalysis_UNC2010/clusters.html. 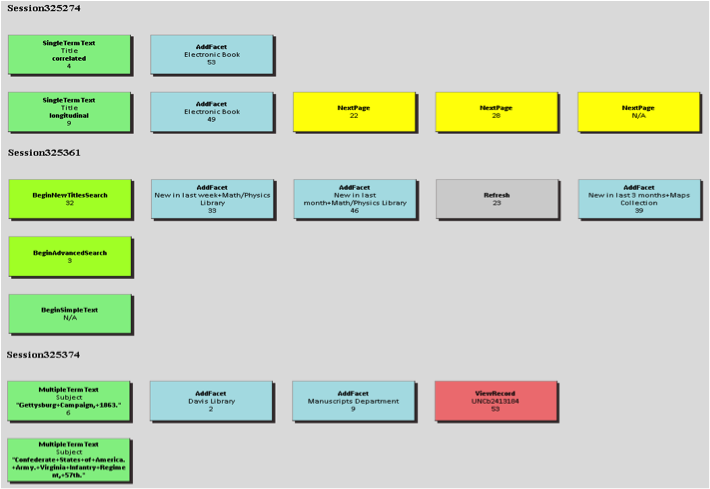
Figure 6. Example search sessions in “FacetTextSearch” group
As an alternative to displaying session visualizations one by one, a large number of search sessions could be visualized on the same HTML page, allowing researchers to scroll through visualizations to quickly browse large numbers of sessions, and look for patterns across sessions.
VUTL supports the exploration and analysis of large amounts of log data produced by library catalog interfaces, so that individual and group behaviors can be studied by both librarians and researchers. By visually scanning the color distribution, the layout of rectangles, and the length of each search session, librarians and researchers will gain an intuitive overview of users’ behaviors. For example, a large amount of green rectangles and relatively fewer blue rectangles suggest a higher usage of the text search compared to the facet search. Librarians and researchers may also discover hidden patterns when browsing the search sessions. For example, in our UNC data it could easily be seen that users took longer actions at the end of rows. The implication is that users tend to think for a longer period of time before deciding to try a new track in their search process (which we are verifying with statistical tests).
Using this visual analytics approach allows for discovering hypotheses about the search action behavior which can then be tested quantitatively from the log data, but which would not have been self evident from just examining the log data. This method of visualization can also provide a convenient tool for studying query reformulations. In the field of information retrieval (IR), there are a series of studies focused on query formulation and query reformulation. In VUTL, each row of actions maps to a query formulation or reformulation. By focusing on only the initial actions on each row and looking at the query actions used by users and the time they take, librarians and researchers can learn users’ strategies for modifying queries, either by narrowing, broadening, or paralleling. Knowing this is particularly helpful for improving the system through incorporating some query-reformulation assistance for its users.
By presenting action sequences, this visualization technique may help librarians and researchers discern some naturally segregated clusters of users whose action sequences are similar, and to further analyze the search tactics and strategies adopted by searchers belonging to a particular cluster. Identified user clusters, in turn, will help customize library catalogs catering to different populations.
Finally, this kind of visualization may help identify “unexpected” or atypical behaviors, so that they can be discarded from quantitative analyses – perhaps because they are likely to be web spider robot accesses, for example. In our analysis, if there are too many actions in a short time frame to be human behavior in one search session, the session is assumed to be conducted by a web spider and therefore should be removed from the data set. If there are always repeating actions (actions which are exactly the same) in one search session, it might be due to the server’s duplicate records of one action. These duplicates should also be removed.
To examine VUTL’s practical significance, we discussed the technique and the visualization result with UNC librarians in charge of the user interface. They expressed significant interest in it. They indicated that the most obvious usage for the visualization tool is for exploring patterns of navigational behavior taken by users in a qualitative manner, which would be combined with additional quantitative methods to uncover sets of recurring patterns in overall usage. Some of the librarians we talked with also considered using this technique for an end-user interface: if incorporated into the actual end-user interface as a tool for power users to see their complete past work flow, users will gain a visually organized version of their query history.
Software availability
The source code of the software is available at http://ils.unc.edu/bmh/pubs/SearchLogAnalysis_UNC2010/. When first visiting this address, please read the provided instructions. Final visualization for more examples using this technique are also available at the address above. This source code can be adapted to other Apache server logs for information retrieval systems.
Future Possibilities and Limitations
Our approach is novel in providing open source software for generating a graphical representation of users’ interactions from Apache search logs customized to a specific search system, in this case a faceted library catalog. Automation of the visualization process allows it to be used with a much higher volume of data compared to manual creation of visualization undertaken by, for example, Wildemuth (2004) and Lown (2008). While some insight can be gained from visualizing a few sessions, the ability to see patterns and understand the big picture was limited in these studies which could only produce a small number of visualizations.
Although VUTL is derived from log data of a library catalog, it is flexible enough to be adapted to many other information systems, such as web search engines, online databases, other OPACs, or any task-based system which provides Apache server logs or similar user transactional logs. By storing intermediate data in an XML format, alternate visualizations could be switched in as well.
There are some limitations to the HTML rendering method we used. The size of the XML file loaded to the browser is highly dependent on the memory of the host computer. For example, for a computer with 2-gigabytes of memory, the browser takes several minutes to load an XML file of 10 megabytes. In this study with several million records, the size of the total XML file generated from the raw logs is several gigabytes, which can be too large for browsers in many environments. Currently this problem is addressed by segmenting the XML files into different parts according the time window and then importing them into the browser separately. Secondly, VUTL is not a fully integrated process. Currently the process contains two sub-processes, each of which is automatic. The first sub process is the conversion of log data to XML data and the second is the visualization of XML data with HTML language. Integration between the two processes is not seamless at this point. We hope to integrate the process as part of our future work.
There is still great potential for improvements on the visualization effects and styles depending on different research needs. For example, support for semantic zooming with a layered presentation providing information at different levels of detail would be helpful.
Finally, the most important issue is how to quantify the interaction patterns revealed by this visualization. The researcher still has to look at all, or a larger number of, sessions to glean information. It still remains a challenge to view and comprehend many thousands of sessions to identify patterns.
References
Chen, H. M., & Cooper, M. D. (2002). Stochastic modeling of usage patterns in a web-based information system. Journal of the American Society for Information Science and Technology, 53(7), 536-548.
COinS
Davis, P.M. (2004). Information-seeking behavior of chemists: A transaction log analysis of referral URLs. Journal of the American Society for Information Science & Technology, 55(4), 326-332.
COinS
Eick, S. G., Nelson, M. C., & Schmidt, J. D. (1993). Graphical analysis of computer log files. Communication of the ACM, 37(12). 50-56.
COinS
Girardin, Luc; Brodbeck, Dominique. (1998) A visual approach for monitoring logs. In Proceedings of 12th Usenix System Administration conference, Boston, Massachusetts, 299- 308.
COinS
Gray, M., Badre, A., & Guzdial, M. (1996). Visualizing usability log data. In Proceedings of the 1996 IEEE Symposium on Information Visualization, 93.
COinS
Grigori, D., Casati, F., Dayal, U., & Shan, M. C. (2001). Improving business process quality through exception understanding, prediction, and prevention. In Proceedings of the International Conference on very Large Data Bases, 159-168.
COinS
Hochheiser, H., & Shneiderman, B. (1999). Understanding patterns of user visits to web sites: Interactive starfield visualization of www log data. Technical Report.
COinS
Jansen, B. J., & Spink, A. (2006). How are we searching the world wide web? A comparison of nine search engine transaction logs. Information Processing and Management, 42(1), 248-263.
COinS
Jelinek, J., & Slavik, P. (2004). XML visualization using tree rewriting. In Proceedings of the 20th spring conference on Computer graphics, 65-72.
COinS
Jörgensen, C., & Jörgensen, P. (2005). Image querying by image professionals. Journal of the American Society for Information Science & Technology, 56(12), 1346-1359.
COinS
Lown, C. (2008). A transaction log analysis of NCSU’s faceted navigation OPAC. Master Thesis. University of North Carolina at Chapel Hill.
COinS
Lown, C., & Hemminger, B. (2009). Extracting user interaction information from the transaction logs of a faceted navigation OPAC. Code4Lib Journal, 7. http://journal.code4lib.org/articles/1633
Niu, X., Lown, C., & Hemminger, B. M. (2009). Log based analysis of how faceted and text based search interact in a library catalog interface. In Proceedings of Third Workshop on Human-Computer Interaction and Information Retrieval, 62-65.
COinS
Takada, T. & Koike, H. (2002). Mielog: A highly interactive visual log browser using information visualization and statistical analysis. In Proceedings of LISA XVI Sixteenth Systems Administration Conference, 133–144.
COinS
Thomas. J & Cook, K.A. (Ed.) (2005). Illuminating the Path: The R&D Agenda for Visual Analytics. National Visualization and Analytics Center, 3–33.
COinS
Wildemuth, B. M. (2004). The effects of domain knowledge on search tactic formulation. Journal of the American Society for Information Science and Technology, 55(3), 246-258.
COinS
About the authors
Xi Niu is a PhD student in School of Information and Library Science at University of North Carolina at Chapel Hill. Her research interests are information seeking behavior, faceted search systems, and empirical research methods. Xi can be contacted at xiniu at email-unc-edu.
Brad Hemminger is an associate professor in the School of Information and Library Science (SILS) at the University of North Carolina at Chapel Hill, with a joint appointment in the Center for Genome Sciences. He directs the Informatics and Visualization Research Laboratory in SILS and leads the Center for Research in Digital Libraries at UNC. His primary research interests are in scholarly communications, digital libraries, human computer interaction, information searching, information visualization and bioinformatics. His current interest is in studying ways to globally share collaborative annotations and reviews for scientific research in the NeoNote project. http://ils.unc.edu/bmh/

Subscribe to comments: For this article | For all articles
Leave a Reply