by James Powell, Tamara M. McMahon, Ketan Mane, Laniece Miller, Linn Collins
Los Alamos National Laboratory
Semantic web representations of data are by definition graphs, and these graphs can be explored using concepts from graph theory. This paper demonstrates how semantically mapped bibliographic metadata, combined with a lightweight software architecture and Web-based graph visualization tools, can be used to generate dynamic authorship graphs in response to typical user queries, as an alternative to more common text-based results presentations. It also shows how centrality measures and path analysis techniques from social network analysis can be used to enhance the visualization of query results. The resulting graphs require modestly more cognitive engagement from the user but offer insights not available from text.
Visualizations and Libraries
Library professional staff and patrons tend to be skeptical of exotic methods of exploring bibliographic metadata, and in particular they are skeptical of visualization tools. This skepticism may in part be a reaction to numerous well-intended research projects which have delivered novel visualization tools with great potential, but with correspondingly significant limitations, including such projects as ActiveGraph, i-scape, and Envision. The Envision project [Nowell et al. 1996] was an early effort to build a dynamic graphical interface for exploring objects in a digital library, but as the creators note “full use of Envision’s Graphic View requires access to a number of document characteristics that are infrequently available in bibliographic databases or library system[s].” While users reportedly “liked the flexibility and power of the Graph View” the system was ultimately too far ahead of its time, with respect to the capabilities of 1990’s desktop computers, and the aforementioned limitations of the available metadata.
Another challenge facing visualization tools is that some visualizations are not readily understood by novice users. Envision relied heavily upon displaying individual items on a scatterplot graph, and representing other characteristics of the items by varying the individual item’s icon size, shape and color, and by supplying a relevant label for each item. While there is certainly utility in this approach to representing and exploring digital library content, and for detecting trends and relationships that would not be apparent by perusing a textual results list, it was an interface that presented a steep learning curve for a non-scientist. A better approach might involve presenting users with a traditional textual interface initially, and offering the option for exploring particular aspects of the data using dynamically generated visualizations. One type of visualization could provide users with the option of exploring the co-authorship networks of various items in the result set supplied in response to a query, using a graph (or network) visualization.
Social Networks
Experts in a particular field often have strong ties to one another, and these ties represent professional collaborations. Exploring these linkages can lead to serendipitous discoveries. [Kules et al. 2008] But most digital libraries display authors as a simple list of names, just as they appear in the source publication. It is cognitively demanding for a user to maintain a mental map of the social network from lists of names. A potential solution is to provide users with a simple visualization of the authorship networks to which a particular author belongs, which has been trimmed so that the nodes and edges displayed to the user are for publications which match a user’s query (see figure 1). These co-authorship graphs have the added benefit of being almost instantaneously comprehensible to users.
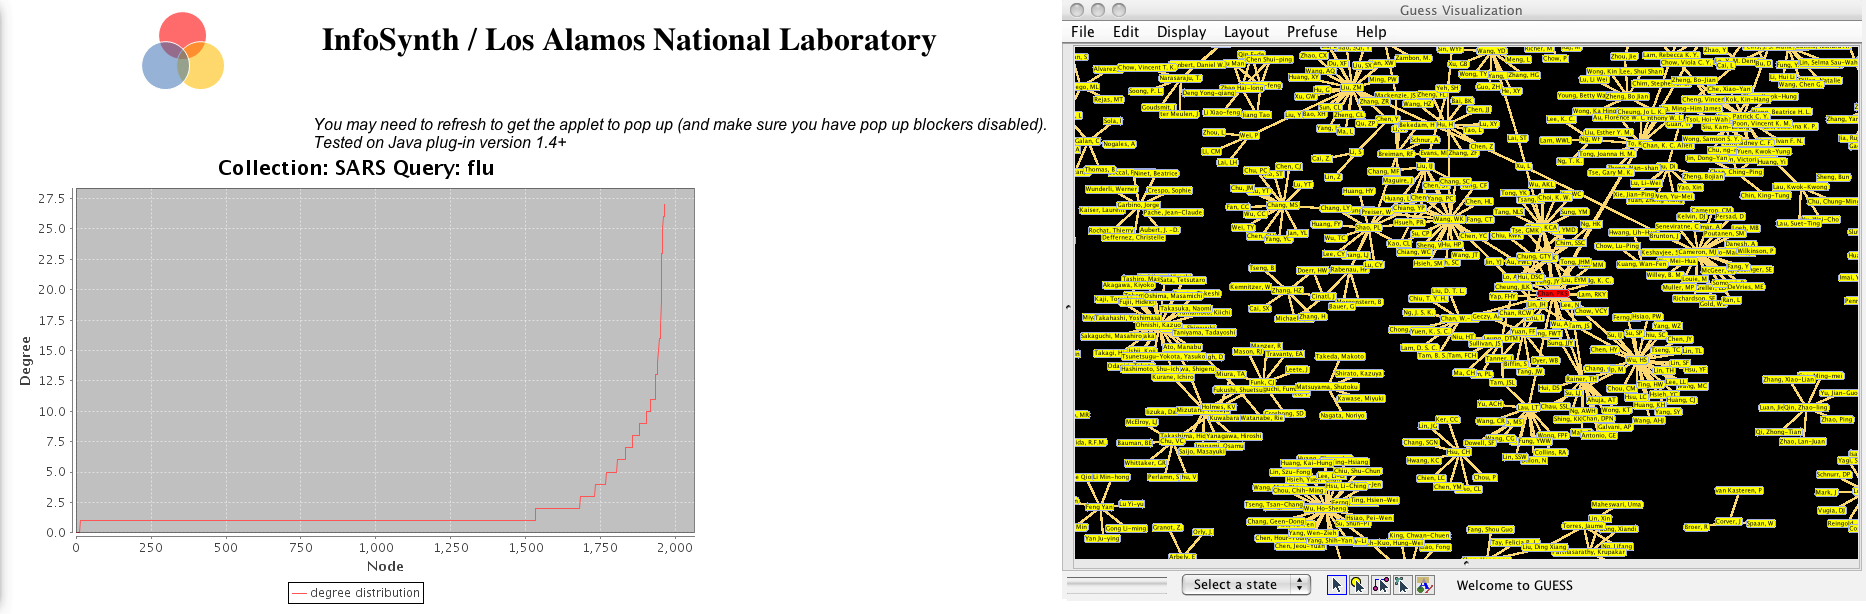
Figure 1. An authorship network where the author with the highest betweenness centrality is highlighted.
A network represents people and the relationships between them as a collection of nodes and edges. Nodes, or vertices, are objects such as authors, subjects, or document titles. Edges represent properties or relationships that bind objects to one another. If a graph does not have too many nodes and edges, it is readily comprehensible to a user, at a glance. They can see patterns such as frequent co-authors or common subject headings shared by a collection of bibliographic records, for example. Denser graphs benefit from the application of centrality measures, which can be used to highlight certain special nodes. Centrality measures are well-known in social network analysis, where they reveal patterns of interaction and communication among nodes (authors) in a social network. An example of a centrality measure is betweenness centrality, which can reveal, in a social network, a person who is critical to communication between two distant people, or between clusters of people. [Powell et al. 2011, preprint]
Graph Theory
Graph theory is at the root of network visualization tools. The authors of the textbook “Graph Theory, 1736-1936” note that “the origins of graph theory are humble, even frivolous… the problems which lead to the development of graph theory were often little more than puzzles.” Yet graph theory, which was often referred to as the geometry of position by early mathematicians, is able to reveal valuable information about connections, roles, and relationships among objects, places, or people. Leonhard Euler, sometimes credited with its invention, was interested in a 16th-century puzzle about whether there was a path that would allow one to cross the seven bridges of Konisberg without repeating any leg of the journey more than once. His interest led to a powerful new field of mathematics with interdisciplinary applications, including many applications in digital libraries. [Biggs 1986]
Graphs, or network-based approaches, were first applied to library data in the mid-20th century [de Solla 1965], to explore citation networks. Our project provides digital library users with the ability to dynamically establish boundary conditions, or trim the graphs so that the resulting authorship network is relevant to a user’s query. Boundary conditions establish constraints that determine the extent of a network, by trimming the graph of all authors and co-authors for a collection so that it only contains authors and co-authors of papers whose metadata contain some keywords related to a user’s query. These authors may have written other papers on related topics, but by constraining the network based on metadata queries, we believe we can offer networks of a reasonable size for visual exploration.
Results as Graphs
Our approach is to provide search results in the form of subgraphs of a co-authorship graph for a set of bibliographic data that has been previously converted to RDF triples. Users perform keyword searches against titles and/or abstracts. Results are initially presented in text form, with various author graph variants available via links. For example, a user can view a clipped co-authorship network that corresponds to search results. Users can optionally select graph variants where the highest degree or highest betweenness centrality node is highlighted. A degree distribution plot accompanies the graph, since this can be helpful in comprehending the overall topology of the graph. For example, does the network exhibit scale-free characteristics, that is, does it have a few hubs (highly connected nodes) and a lot of nodes with just a few, or a single, connection? (see figure 2) This can help provide context for the graph. Finally, we also provide tools which allow users to see who a given author’s direct collaborators are, and to find the “degrees of separation” between two authors (if they are in fact connected). [Newman 2001]
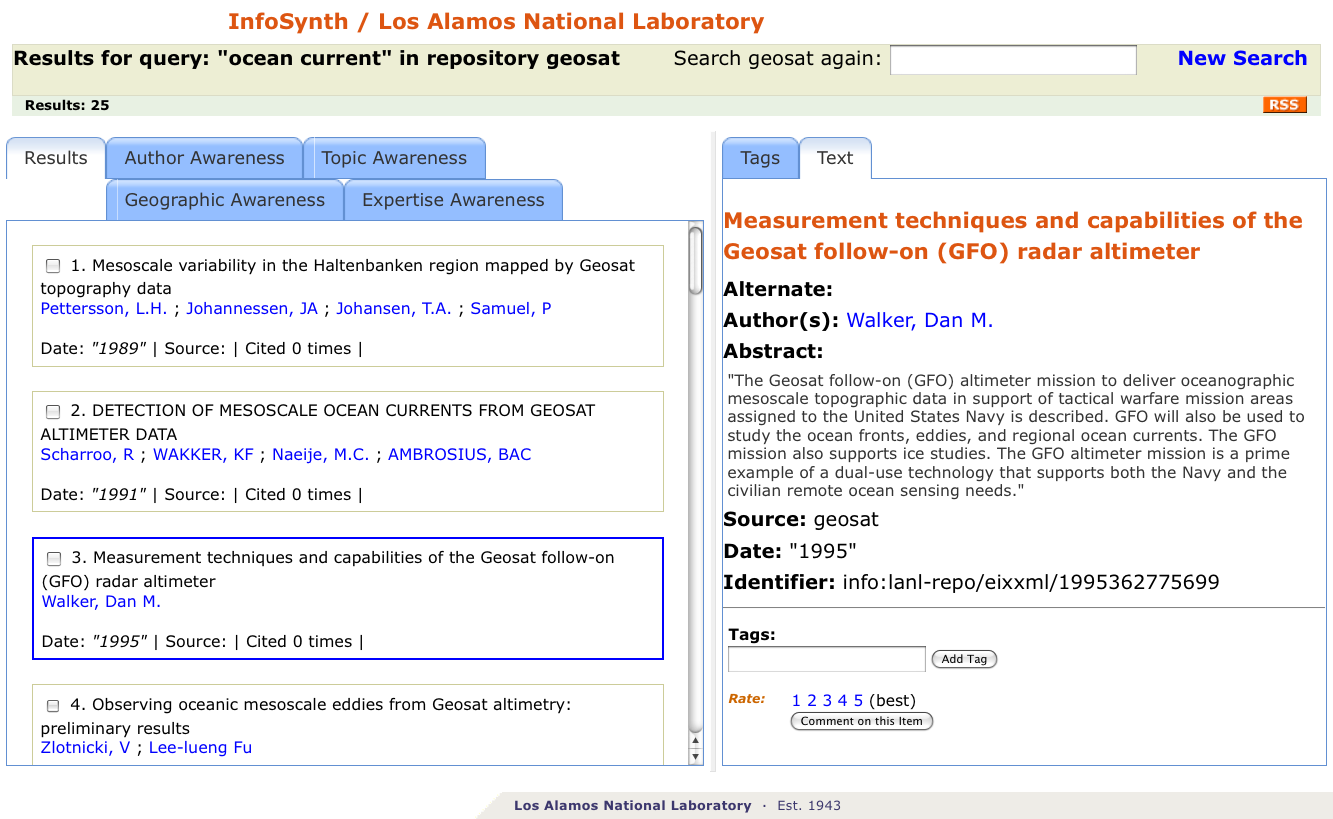
Figure 2. Initial view of results set in InfoSynth.
We call this co-authorship graph exploration tool the Social Awareness Tool, or SAT. It is a component of a search environment we developed for collections of semantic Web data, called InfoSynth. InfoSynth is described in several papers, including [Powell et al. 2010], [Powell et al. June/July 2011], and [Powell et al. November 2011]. For the SAT we use a similar model as employed for the Geographic Awareness Tool [Powell et al. November 2011], where discrete service layers (see figure 3), each with a respective role in processing the user query, are called in order to fulfill a user request.
The data required for building an authorship network are very simple, and are provided by most digital library systems exposed via OAI-PMH. [Lagoze et al. 2002] It is essential to have the document title, and a list of authors. Each author’s name must occur separate from other author’s names – if all names are combined in a single field, then it is less likely that the names can be programmatically extracted from the metadata in a reliable fashion. Some OAI repositories fail to provide authorship data at this level of granularity. Additionally, the first author should either be explicitly designated in some fashion, or it should reliably occur as the first name associated with the record. Here is an example of what the metadata might look like in Dublin Core [Dublin Core Metadata Initiative]:
<dc:title>Emergency Information Synthesis and Awareness Using E-SOS.<dc:title>
<dc:creator>Collins, Linn Marks</dc:creator>
<dc:creator>James E. Powell, Jr.</dc:creator>
<dc:creator>Carolyn Dunford</dc:creator>
...
In this example, the first author is Linn Marks Collins, and subsequent authors contributed to the article, but no assumptions are made regarding the nature or degree of their contributions. As you can see from this small amount of data, challenges in matching names across publications quickly emerge. For example, if Linn is second author of another publication, then it is possible that her name will appear as “Linn Marks Collins” rather than “Collins, Linn Marks.” Another common occurrence is that her name may appear with her first and middle name abbreviated, as “Collins, L.M.” So the heuristics for name disambiguation quickly become complex, and the reliability of those rules decreases as the amount of information available for matching decreases. Matching can be improved when there is additional information available to support a given rule, for example, if the metadata also provided the organization name to which the author is associated, or an email address for each author. Author name disambiguation remains a major challenge for digital libraries. [Smalheiser et al. 2009] For our purposes, we elected to use the following three rules to determine if one author name matches another:
1. Does the new author match a previously detected author exactly?
2. If the name contains a comma, if we swap the portion of the name after the comma with the portion of the name before the comma, does it now exactly match a previously detected author?
3. Does the name include abbreviations (a single character followed by a period)? If so, does this match an abbreviated version of a previously detected name?
While not comprehensive or fool-proof, these rules represent a fair trade-off in terms of matching author names within a particular field. These rules may be good enough for content harvested via OAI-PMH from a topically or institutionally focused repository. However, with larger collections of metadata spanning multiple disciplines, the likelihood of false matches becomes greater, and the resulting authorship networks become increasingly unreliable. Ironically, entity disambiguation efforts can be enhanced by graph analysis techniques. This means there are opportunities to use the resulting graphs to improve author matching, for example, in instances where two entities are textually similar share many of the same relationships with other entities [Bhattacharya and Getoor 2007].
Data Conversion
Since we convert harvested bibliographic records into the Resource Description Framework format (RDF) [Brickley and Guha 2005], using a process like that described in Powell et al. [July/August 2010], we use a well-established practice of storing some of this data in a relational database. Each unique name is assigned a unique author identifier, a universally unique id or uuid, which takes the form of an unresolvable URI. This identifier is used internally by our applications when they generate authorship networks data in response to user queries. It is also possible to store other data to facilitate name matching. For example, there could be a name variant table with a linker table associating all detected variants of an author’s name with an identifier, as well as other data, such as organizations the author has been associated and even temporal data indicating the period of time the author was known to be associated with that organization.
The relational database supports only name matching during record conversion. Dublin Core metadata records are mapped to an RDF/XML serialization, and these triples are loaded into an RDF repository. RDF is especially well suited for representing this data, because the authorship data that implies relationships among authors can be made explicit using the Friend of a Friend (FOAF) ontology [Brickley and Miller 200], in conjunction with Dublin Core metadata elements, which can be used as predicates in RDF triples. It is also easy to add new facts in the form of new statements whenever they are discovered. RDF is more readily understood by humans when triples are expressed in another standard notation, called Notation-3 or N3 [Palmer]. Here is an N3 triple derived from the Dublin Core metadata example featured above:
“Collins, Linn Marks”
This triple expresses the fact that Linn Marks Collins was an author of the paper entitled “Emergency Information Synthesis and Awareness Using E-SOS”. In practice, associations are more typically made between object identifiers, rather than string literals. For example, the document title in this example would instead be an identifier for a set of triples about this paper. The generated triples are then used to populate an RDF/XML repository representing the OAI harvested content (an OAI service provider). Authorship networks are expressed as a series of RDF/XML statements associated with a particular article. During the metadata to RDF/XML mapping process, the unique identifier assigned to a given author is retrieved during the name matching process, and reused across publications when an author name is determined to match a previously detected author name. In this way we can explicitly represent relationships between authors across multiple publications, in RDF.
The RDF/XML example below represents a portion of the mapping of a record from the NASA public OAI repository at http://ntrs.nasa.gov/. J.L. Steinberg is identified as a person using FOAF, and as the first author of a publication about the radiation environment in proximity to the earth. Co-authors S. Hoang and Michelle F. Thomsen are identified as co-authors, and associated with Steinberg with the
<foaf:Person rdf:about="uuid:5d6d9d88-956e-4759-9bd8-5528c4239f7b">
    <foaf:name>STEINBERG, J. L.</foaf:name>
</foaf:Person>
<foaf:Person rdf:about="uuid:b0ee82b9-befa-4917-a2b0-c90ba575e8f6">
    <foaf:name>HOANG, S.</foaf:name>
    <foaf:knows rdf:resource="uuid:5d6d9d88-956e-4759-9bd8-5528c4239f7b"/>
</foaf:Person>
<foaf:Person rdf:about="uuid:5b425905-d8a5-4fc5-9779-b5daa313ed83">
    <foaf:name>THOMSEN, MICHELLE F.</foaf:name>
    <foaf:knows rdf:resource="uuid:5d6d9d88-956e-4759-9bd8-5528c4239f7b"/>
</foaf:Person>
<rdf:Description rdf:about="uuid:3826cdbc-b63a-403d-9785-9d0ee6973b60">
    <dc:identifier>info:lanl-repo/laauthors/LA-UR-90-1420</dc:identifier>
    <dc:title>OBSERVATIONS OF THE EARTH'S CONTINUUM RADIATION IN THE DISTANT MAGNETOTAIL WITH ISEE-3.</dc:title>
    <dc:creator>
    <rdf:Seq>
       <rdf:li rdf:resource="uuid:5d6d9d88-956e-4759-9bd8-5528c4239f7b" />
       <rdf:li rdf:resource="uuid:b0ee82b9-befa-4917-a2b0-c90ba575e8f6" />
       <rdf:li rdf:resource="uuid:5b425905-d8a5-4fc5-9779-b5daa313ed83" />
    </rdf:Seq>
  </rdf>
</foaf>
Once we have mapped a set of harvested records from Dublin Core to RDF/XML, we can either create a new RDF repository in which to store these triples, or add them to an existing RDF repository. We chose the OpenRDF’s Sesame triplestore to store our content and to build our authorship network service. OpenRDF provides an Application Programming Interface (API) for programmatically accessing repository content.
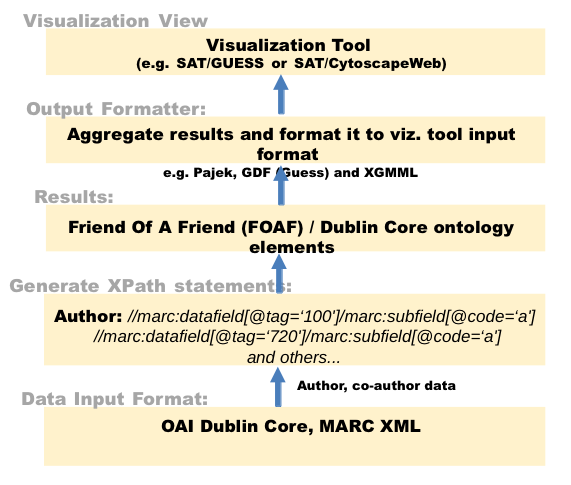
Figure 3. Architecture and data flow for the SAT.
The Middleware Layer
The SAT middleware layer supports direct retrieval of graph data in various raw formats supported by other visualization tools, or by other InfoSynth components. For example, Pajek compatible output might be used with Pajek to render different networks, explore larger networks that the Guess applet can accommodate, or to merge with other networks. These graphs are generated dynamically in response to a user query. The user query is converted into a SPARQL query, which is a query language for RDF data. [W3C SPARQL Query Language for RDF] A very basic SPARQL query, which can be thought of as “select all statements” looks like this:
SELECT ?subject ?predicate ?object
WHERE
{
      ?subject ?predicate ?object.
}
In practice, queries are usually more specific, and include properties such as filter clauses to narrow the results.
If a triple doesn’t exist for a given set of data, it may simply be omitted. However, this possibility must be taken into account when querying the data. The SPARQL query language includes an OPTIONAL clause, which allows a query to be executed successfully even if some data is missing. Portions of the query which involve data which may or may not be present are specified using the OPTIONAL clause, as this example illustrates:
SELECT ?title ?description ?placename
WHERE
{
      ?id <http://purl.org/dc/elements/1.1/#title> ?title.
      ?id <http://purl.org/dc/elements/1.1/#description> ?description.
      OPTIONAL { ?id <http://xmlns.com/foaf/0.1/#topic> ?y.
                 ?y <http://www.geonames.org/ontology#name> ?placename.
      }
}
This query against a set of triples describing documents expects titles and description statements to occur for all objects, but topic and location information may or may not be present. Using the OpenRDF API, we built a middleware layer to query our repository and return results as authorship networks. The API provides classes for establishing a connection to an RDF repository, constructing and submitting a query, and a data type container for results – somewhat reminiscent of what the Java Database Connector (JDBC) API provides application developers for interacting with relational databases. The Java servlet that handles queries uses a partially constructed SPARQL query and incorporates terms supplied by the user into a FILTER clause. Here is the previous query, with a filter by title clause that will result in any statements where the title contains the word “mars” to be returned:
SELECT ?title ?description ?placename
WHERE
{
      ?id <http://purl.org/dc/elements/1.1/#title> ?title.
      ?id <http://purl.org/dc/elements/1.1/#description> ?description.
      OPTIONAL { ?id <http://xmlns.com/foaf/0.1/#topic> ?y.
                 ?y <http://www.geonames.org/ontology#name> ?placename.
      }
      FILTER regex(?title, “mars”, “i”)
}
Next, here is an example of an actual query used by the InfoSynth middleware layer (with namespaces defined with prefixes). The query retrieves only co-authors, so that the authorship network for each matching title can be constructed, with edges between co-authors and the main author. The use of the rdf:Seq element in the RDF/XML ensures that the order of authorship is maintained. The FILTER clause indicates that only items which have a dc:title containing the word “mars” should be returned. The string “mars” is an example of a value passed in as a parameter to the Java servlet, representing a query term entered by a user.
PREFIX dc: <http://purl.org/dc/elements/1.1/#>
PREFIX foaf: <http://xmlns.com/foaf/0.1/#>
PREFIX rdf: <http://www.w3.org/1999/02/22-rdf-syntax-ns#>
SELECT DISTINCT ?docuuid ?title ?node ?name ?knows ?knowsname

WHERE {
  ?docuuid dc:title ?title.
  ?docuuid dc:creator ?seq.
  ?seq ?li ?node.
  ?node foaf:name ?name.
  OPTIONAL { ?node foaf:knows ?knows.
             ?knows foaf:name ?knowsname. }
  FILTER (bound(?knows))
  FILTER regex(?title, “mars”, “i”)
}
The social awareness middleware layer can be addressed via a REST query, such as this one:
http://hostname/satRdf/srdf?q=mars&repo=nasa&format=gdf
The q parameter represents the user’s query, the repo parameter is the name of the RDF repository to be searched, and the format parameter specifies the format for the results. The service can return results as GraphML [Brandes et al. 2005], GDF (Guess data format) [Adar 2006], a Pajek compatible .net file, XGMML [XGMML …], or a GraphViz compatible .dot file. GraphML is a general purpose language for representing the edges, nodes and related values for a graph, as XML. It is supported by a variety of visualization tools (see figure 4). GDF is a native format for the Guess visualization framework – a Java library for rendering graphs. Although Guess technically supports both formats, we found that Guess rendered GDF data far more rapidly than it did GraphML data.

Figure 4. CytoscapeWeb rendering of a co-authorship graph, which was output by a middleware service in GraphML.
The Rendering Layer
The SAT’s rendering service is what the user actually interacts with when viewing social network data. A user submits a search via a simple web form. That query is converted into a query against the middleware service layer described above, and the results are combined with the Guess visualization applet, or the Cytoscape Web tool, and returned to the user’s Web browser. That visualization shows all of the authors who are associated with papers that matched the user’s query. In many cases, it reveals connections among many authors associated with the search term, thus potentially revealing others who may have made significant contributions in this field. The visualizations are simple and easy to grasp at first glance, whereas a simple list of authors associated with various publications would result in a dense network graph and is more likely to quickly overwhelm the user and limit the ability to view collaborations among authors.
A user has the option of viewing alternate versions of the clipped graph that matches a user’s query. Alternate views include graphs where the node with the highest degree or highest betweenness centrality is highlighted. This is helpful when viewing large or dense graphs. As a result, it is easy to represent the graph as an adjacency matrix, and calculate centrality measures such as betweenness and degree centrality for each node in the graph. There is also the option to view a table of all selected author nodes, with their respective centrality measures displayed numerically. This data could be used as the basis for other features, such as a graph view highlighting disparate clusters, or by applying other social network analysis techniques to the data. [Mika 2004]
Finally, the same internal representations of these graphs can also be used to explore paths between authors. We use a Java library called jgrapht [Naveh 2005] to internally represent clipped graphs representing the results of a user query. This library provides a set of path analysis algorithms for exploring the existence and distance of connections among nodes. We use the NeighborIndex class to generate a navigable view of authors and co-authors. Once an author is selected, all of their collaborators are returned in a list form, and users can click on collaborator names to see their co-authors. We also use the BellmanFordShortestPath class to determine if any two authors are connected and if so, how long the path is between them (Figure 5). This is the same idea behind various projects such as the Erdos number and the “Six Degrees of Kevin Bacon” project. Path analysis can be useful in exploring the evolution of ideas and collaborations.
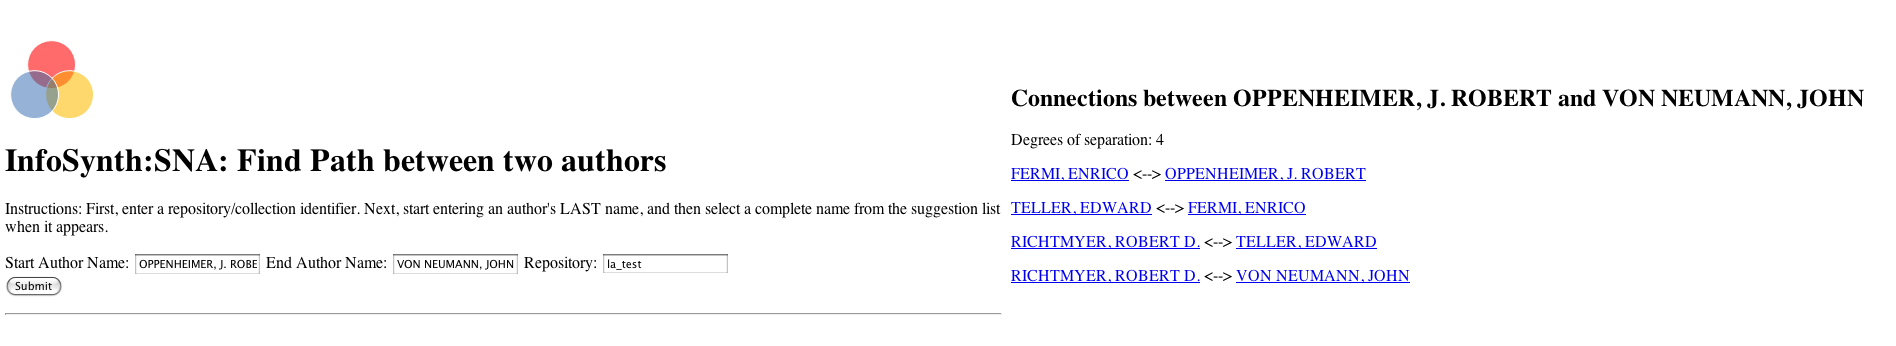
Figure 5. Degrees of separation between Robert Oppenheimer and another scientist.
Conclusion
This paper describes how we used semantic web technologies to build an OAI service that render dynamically generated authorship networks in response to a user query against a harvested digital library, and how these graphs can be further augmented to highlight significant contributors. It has been tested against a wide variety of OAI repositories, and against RDF repositories that represent content from a single OAI data provider, and repositories which contain an aggregation of content from several OAI data providers. The OAI service provides a middleware layer which is capable of providing standards-compliant (GraphML) output, which makes it possible to use with a variety of network visualization tools, or incorporate into other service oriented digital libraries. It also provides a simple rendering layer which supports visualizations of results sets. It uses basic name disambiguation heuristics to match author names during the process of mapping harvested metadata to RDF/XML. The application layer uses the OpenRDF libraries, which are supported by a number of RDF repositories, including highly scalable offerings from commercial vendors such as Allegrograph.
These tools are designed to be both modular and scalable, to function as a standalone service, or to be integrated with an existing digital library. The rendering services provide users with simple but effective visualizations of a specific set of relationships that exist in digital library data. The granularity, specificity, and standards-compliance of the middleware services, and the fact that the rendering services can stand-alone make them easy to integrate with other tools. The simplicity of these graphs, coupled with the fact that they correspond to a user’s specific query, enhances their utility and ease of use. By normalizing topically specific, manageable sets of metadata to RDF we can offer simple, specific, and straightforward visualizations for exploring aspects of otherwise hidden social networks that exist in digital libraries.
References
Adar, E 2006. GUESS: a language and interface for graph exploration. In: CHI ’06 Proceedings of the SIGCHI conference on Human Factors in computing systems,2006 April 22-27; Montreal Canada: ACM.
Bhattacharya, I. and Getoor, L.] 2007. Entity Resolution in Graphs. In: Cook, D.J., Holder, L.B., editors. Mining Graph Data. Hoboken (NJ): John Wiley & Sons, Inc. p. 311-345.
Biggs, Norman. 1986. Graph theory, 1736-1936. Oxford [Oxfordshire] ; New York: Clarendon Press.
Brandes, U., Eiglsperger, M., and Lerner, J. 2005. GraphML Primer. [cited November 2, 2011]. Available from: http://graphml.graphdrawing.org/primer/graphml-primer.html.
Brickley, D., and Guha, R 2005. Resource Description Framework (RDF) Schema Specification. [cited October 30, 2011]. Available from: http://www.w3.org/TR/2000/CR-rdf-schema-20000327.
Brickley, D. and Miller, L. 2005. FOAF vocabulary specification. Namespace Document 27 July 2005. [cited November 2, 2011] Available from: http://xmlns.com/foaf/spec/20070114.html.
Dublin Core Metadata Initiative [Internet].Dublin Core Metadata Initiative; [cited October 2011]. Available from: http://dublincore.org/
Kules, B., Wilson, M., Schraefel, M., Shneiderman, B.] February 2008. From Keyword Search to Exploration: How Result Visualization Aids Discovery on the Web. College Park (MD): Human-Computer Interaction Lab Technical Report HCIL-2008-06.
Lagoze, C., Van de Sompel, H., Nelson, M., and Warner, S. 2002, The Open Archives Initiative Protocol for Metadata Harvesting, Version 2.0. [cited October 2011] Available from: http://www.openarchives.org/OAI/2.0/openarchivesprotocol.htm.
Mika, P. 2004. Social Networks and the Semantic Web, In: 2004 IEEE/WIC/ACM International Conference on Web Intelligence (WI’04), pp.285-291.
Naveh, S. 2005. Jgrapht – a free java graph library. [cited November 2, 2011] Available from: http://www.jgrapht.org/.
Newman, M. E. J. June 2006. Scientific collaboration networks. II. Shortest paths, weighted networks, and centrality. Physical Review E 64, 016132 [cited October 30, 2011] Available from http://link.aps.org/doi/10.1103/PhysRevE.64.016132.
Nowell, L.T., France, R.K., Hix,D., Heath, L.S., Fox, E.A. 1996. Visualizing search results: some alternatives to query-document similarity. In: Proceedings of the 19th annual international ACM SIGIR conference on Research and development in information retrieval (SIGIR ’96). ACM, New York, NY, USA, 67-75. DOI=10.1145/243199.243214 http://doi.acm.org/10.1145
Palmer, S.B. A. Rough Guide to Notation3. Informesh.net. [cited March 24, 2011]. Available from: http://infomesh.net/2002/notation3/.
Powell, J., Alcazar, D., Hopkins, M., Olendorf, R., McMahon, T., Wu, A., and Collins, L.M. 2011. “Graphs in Libraries: A Primer” (LA-UR 10-08362), Information Technology and Libraries, December, 2011, Vol30, No. 4.
Powell, J.E., Collins, L.M., and Martinez, M.L.B. July/August 2010. Semantically Enhancing Collections of Library and Non-Library Content. D-Lib Magazine, [cited October 30, 2011] Available from http://www.dlib.org/dlib/july10/powell/07powell.html
Powell, J., Collins, L.M., and McMahon, T. June/July 2011. Embracing Lossy. ASIS&T Bulletin, Vol. 37, No. 5.
Powell, J., Mane, K., Collins, L.M., Martinez, M.L.B., and McMahon, T. November 2011. The Geographic Awareness Tool: Techniques for Geo-encoding Digital Library Content. Library Hi Tech News, 28(9).
Powell, J.E., Alcazar, D.A., Hopkins, M., Olendorf, R., McMahon, T.M., Wu, A., & Collins, L. 2011. Graphs in Libraries: A Primer. ITAL: Information Technology and Libraries (in press). [Preprint cited March 24, 2011]. Available from http://www.ala.org/ala/mgrps/divs/lita/ital/prepub/powell.pdf
Smalheiser, N. R. and Torvik, V. I. 2009. Author name disambiguation. Annual Review of Information Science and Technology, 43:1–43. doi:10.1002/aris.2009.1440430113.
de Solla Price, D.J. July 30, 1965. Networks of Scientific Papers. Science, 149(3683): 510-515.
W3C. 2008. SPARQL Query Language for RDF. [cited November 2, 2011]. Available from: http://www.w3.org/TR/rdf-sparql-query/.
XGMML. [Internet]. [updated May 2009]. Wikipedia. [cited November 2, 2011]. Available from: http://en.wikipedia.org/wiki/XGMML.
About the Authors
James Powell is a Research Technologist at the Research Library of Los Alamos National Laboratory, and a member of the Knowledge Systems and Human Factors Team where he develops digital library, semantic web, and ubiquitous computing tools to support various initiatives. He has worked in libraries off and on for over 20 years, including eight years at Virginia Tech University Libraries, where he worked on the Scholarly Communications project and participated in several collaborations between the library and the Computer Science department’s digital library group. He later went on to assume the position of Director of Web Application Research and Development at Virginia Tech, and to lead the Internet Application Development group, before joining LANL.
Tamara M. McMahon is a Library Technology Professional at the Los Alamos National Laboratory. Her background in human factors and information science allows her to bring people, data and technology successfully together. Her current work includes knowledge discovery systems and large scale data repositories. Tamara holds a Master of Information Science degree from Indiana University.
Dr. Ketan Mane is a Senior Research Informatics Developer in the Health Informatics and Bioscience Group at Renaissance Computing Institute (RENCI). His current research work focuses on applying visual analytics approaches in decision support role to help clinicians identify viable treatment options at the point of care. Dr. Mane has a background in biomedical engineering, and holds a Ph.D. in Information Science from Indiana University, Bloomington (Advisor: Dr. Katy Borner). Prior to joining RENCI, Mane was a member of the InfoViz lab at Indiana University, Bloomington. He has also worked as a Postdoctoral Research Fellow at Los Alamos National Lab (LANL) as part of the Knowledge Systems and Human Factors Team. His research interest include: information visualization, visual analytics, decision support tools, health informatics, knowledge domain visualization
Laniece Miller is a graduate research assistant the Los Alamos National Laboratory. She recently finished a masters of science in library and information studies at Florida State University.
Linn Collins is a Technical Project Manager at the Los Alamos National Laboratory. Her current work involves knowledge systems, information exploitation, and applying semantic web and social web technologies to challenges in national security. She received a doctorate in educational technology from Columbia University in New York, where her dissertation was on semantic macrostructures. Prior to LANL she worked at IBM Research on Eduport and the Knowledge and Collaboration Machine, and at the Massachusetts Institute of Technology on Project Athena.

Subscribe to comments: For this article | For all articles
Leave a Reply