By Dr Jason Cooper, Dr Jon Knight and Gary Brewerton
Introduction
In the UK academics typically produce an annotated list of material to support students in their course of study. Traditionally these lists would contain references to books, book chapters and journal articles, and thus are known as reading lists. As the variety of material available to academics and students has evolved so too has the list, which now covers other media types including audio visual material and websites/webpages, and are therefore now sometimes called resource lists.
A Reading/Resource List Management Systems (RLMS) provides academics an easy way to create and maintain their reading lists; it also provides the institution’s libraries with easy access to all the academics’ reading lists as the content of these can directly impact the Library’s stock management decisions.
The provision of statistical feedback on reading lists to their academic owners has historically been seen as a weak spot for RLMS. This issue is one of the areas being tracked in the latest version of the Loughborough Online Reading List System (LORLS) (Brewerton et al. 2003, Knight et al. 2012) by the inclusion of an academic dashboard.
The idea of providing a dashboard for the academic owner(s) of lists was strengthened by discussions in the first Meeting the Reading List Challenge workshop (Meeting the reading list challenge [updated 2012]) in July 2011. Being able to feed back list related information to academics was seen as a good incentive for them to make better use of the system.
The current version of LORLS is separated into two halves, the back end and the front end. The back end handles the data storage and security checks and is known as the Loughborough Universal Metadata Platform (LUMP). LUMP is written in Perl and uses a MySQL databases for storage. The front end is a Client for LUMP (named CLUMP) which handles the user interface. This is an AJAX style interface, written in JavaScript and using the jQuery JavaScript library (jQuery … [updated 2012]). The front and back ends of LORLS communicate via a number of RESTful APIs which can return data in either XML, JSON or JSONP.
Implementing the dashboard in LORLS required a number of changes to the existing APIs as well as the creation of a number of new APIs. The front-end interface also needed to be extended to make use of the new features added to existing APIs. A new dashboard interface had to be created to present the information provided by the new APIs to the academic owners of each reading list.
The Dashboard
The academic dashboard in LORLS is available on a per reading list basis, to any users with edit permission for that list. The dashboard option has been included in the toolbar alongside other options like search and logout. Clicking on the dashboard option brings up a lightbox effect window within which the dashboard contents are displayed.
It was decided early on in that the information presented by the dashboard should, where possible, be presented in a visual format. For example, rather than just reporting the total number of views for a reading list a graph should be used to show those views over time, thus presenting more information without overloading the academic with it.
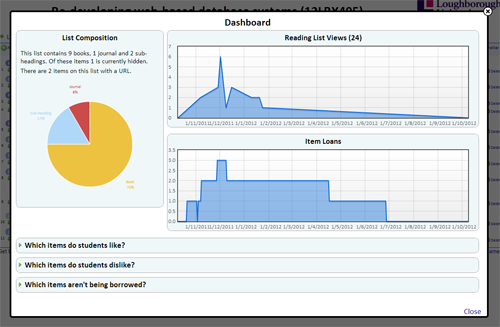
Figure 1. Screenshot of the Academic Dashboard
The list composition information gives a summary count of the types of items on the list, how many items have a URL as part of their metadata and if any of those URLs had been marked as not working by the system. If there are any URLs that have been marked as not working an option is provided that returns the owner to their list and highlight those items with nonworking URLs.
To the right of the list composition information are two graphs, one above the other. The top graph shows the number of users who have viewed the reading list over the last year. Library staff are not reported in the number of views to give a more accurate representation of student usage. The bottom graph shows the number of items on the reading list that have been loaned out from the Library within the last year.
The remainder of the academic dashboard consists of three questions. Clicking on a question will cause it to expand out with the answer in tabular form.
When viewing an item on a reading list the student is presented with two icons for rating the item: a thumbs up and thumbs down. The thumbs up icon can be used to mark that they liked the item and the thumbs down icon can be used to mark that they disliked the item. The students’ votes against items are used to provide the answers to the first two expandable questions on the academic dashboard.
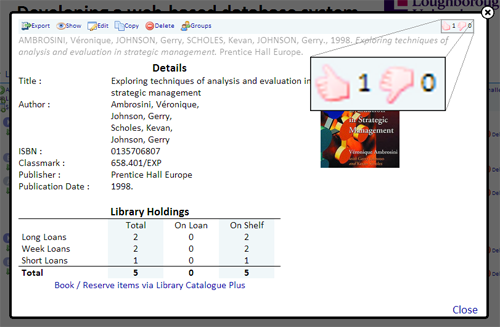
Figure 2. Screenshot Showing Ratings Icon
The “Which items do my students like?” question shows a table displaying the highest user ranked items, how many people had marked them in a positive way, how many had marked them in negative way and the net score for the item. Only items with a positive net score are considered when deciding which items to display. An option to return to the reading list and highlight the items shown is also provided.
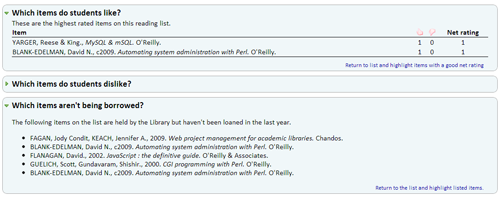
Figure 3. Screenshot Showing Expanded Answer
The “Which items do my students dislike?” question shows the same information as the previous question except for the lowest user ranked items. This time only items with a negative net score are considered for displaying. Again an option is provided to return to the reading list and highlight the items shown.
The final question, “Which items aren’t being borrowed?”, presents a list of items that haven’t been borrowed in the last year, yet are available in the Integrated Library System (ILS). Once again there is an option to return to the reading list and highlight these items.
Logging views
The initial change required for LORLS was to set up logging views of reading lists. This required changes to both the front and back end. To access information on a reading list the front end calls the FastGetStructuralUnit API. Due to the threaded nature of CLUMP the FastGetStructuralUnit API is called multiple times when displaying lists; this in turn required an additional option to be added to the FastGetStructuralUnit API so that the front end could specify that a call shouldn’t be logged as a view.
When logging a view, the source IP address of the request, the name of the client software in use (usually CLUMP in our case), the ID numbers for the particular reading list, the username of the person and the time of the request are recorded in a row in a new “view_log” table in the LUMP database.
A new ViewUsage API was added to allow the front end to access information stored in the view_log table. It takes the id of the reading list and returns a list of views including a timestamp for each view. This information can then be processed by the front end and used to generate a graph of views over a period of time.
The ViewUsage API allows requests to discard views made from machines in given IP address ranges (details of which are held in a separate table). This allows accesses by library staff or during development/debugging of the code to be ignored. The remaining IP addresses are anonymised using the IP::Anonymous Perl module from CPAN (IP::Anonymous … [updated 2012]). The ViewUsage API can also restrict returned viewing matches based on any combination of the client software name, the username of the person viewing the SUs, the source IP address (prior to anonymising) and a start/end timestamp.
Item Loans
Initially the local ILS was queried dynamically to obtain the loan information. As LORLS attempts to be ILS agnostic the code to query it was kept separate. This turned out to be beneficial as due to performance issues actively querying the ILS was soon demonstrated to be an unworkable solution. A local loans cache database was created that was specifically designed to provide the required information more efficiently.
The loans cache table uses a script that runs each day and gets any loans that were either issued or returned for the previous day. These details are then used to update the local loans cache.
There are currently two API calls available for the local loans cache: ‘loanHistory2’ and ‘lastLoaned’. The first API call takes a list of ISBNs and returns, for each day in the last year, the total number of items on loan which match any of those ISBNs. The second API also takes a list of ISBNs but returns for each ISBN if and when it was last issued.
The front end uses the data returned by the first API to provide the graph showing items loaned and the data from the second API to produce the list of items not borrowed in the last year.
Item Rating
The introduction of a feature for users to rate individual items on a reading list required the addition of a new table in the database and a number of new APIs for the front end to interact with it. The new APIs are ‘EditSURating’ and ‘GetSURating’.
EditSURating will set a logged in users rating as either positive (thumbs up) or negative (thumbs down). An individual user can only have one rating attached to any structural unit; any future calls of EditSURating for that SU will alter the existing rating for that user.
The GetSURating API retrieves for each SU specified the total number of positive ratings and the total number of negative ratings.
Graphing Technology
Traditionally graphs shown in web sites are either static images generated and stored on the server or images dynamically generated by CGI scripts running on the web server. Both methods increase the load on the web server and are impractical when the graphs are expected to make full use of the available space on a page, even after the browser has been resized.
The solution to this issue used in LORLS’s dashboard is to have the back end supply the data to the browser and for the browser to dynamically generate the graphs itself. This became possible with the introduction of HTML5’s canvas element and Flot (Flot … [updated 2012]), a jQuery plug-in for drawing graphs. Flot supports a number of different graph styles (line, bar, pie, etc.) and also supports a number of advanced features including dynamically resizing the graph when its containing element is resized.
This method is not without its own issues though. For example, version 8 and lower of Internet Explorer (IE) does not support the canvas element. This requires LORLS v7 to add a canvas element to these versions of IE through the use of the ExplorerCanvas JavaScript library (ExplorerCanvas [updated 2012]) which emulates the canvas element through the use of IE’s vector markup language (VML).
Launch and future development
The dashboard was launched to academics at Loughborough in August 2012. Feedback has been very positive with many academics praising the graphical design of the dashboard and appreciating the insight the dashboard gives them into the use of their reading lists.
Enhancing the dashboard will be part of future versions of LORLS as there is still a lot of information that the academic owners may find useful when creating their lists. Areas that are currently under investigation to be added or enhanced in future versions of the dashboard include loan information, pricing and download counts for online items.
The loan information can be extended with more details such as which books are the most loaned, what are the average number of loans and what the standard deviation is.
Given the recent increase in tuition fees for students, academics may feel the need to be more aware about the cost of resources they are expecting their students to own/access. Information relating to the total and average cost of books on the list may be of benefit to the academic owners as well as librarians when updating their lists.
As more items on reading lists are available electronically via special copyright cleared licenses, being able to view the number of downloads of these items alongside the loan information will help present a fuller picture of how students are making use of the reading list.
Conclusion
The inclusion of an academic dashboard for reading list owners increases the information they have available for managing their reading lists. They can use it to gain an understanding of how their students are using reading lists: if and when they are checking them or borrowing items from them. They can also see which items their students have reported as being particularly useful and which items were not. Finally they can see which books on their reading list haven’t been loaned out by the Library and use this information when revising their reading list and lecture notes.
The dashboard in LORLS will continue to be enhanced in future versions with an emphasis on providing information to the academic owners that helps them make the most of their reading lists.
References
Brewerton G, Knight J. 2003. From local project to open source: a brief history of the Loughborough Online Reading List System (LORLS). VINE, 33(4):189-195. Available from https://dspace.lboro.ac.uk/handle/2134/441
Knight J, Cooper J, Brewerton G. 2012. Redeveloping the Loughborough Online Reading List System. Ariadne, (69). Available from http://www.ariadne.ac.uk/issue69/knight-et-al
Meeting the reading list challenge [Internet]. [cited 2012 October 08]. Available from http://blog.lboro.ac.uk/mtrlc/
jQuery: The Write Less, Do More, JavaScript Library [Internet]. [cited 2012 October 08]. Available from http://jquery.com/
IP::Anonymous : Perl port of Crypto-PAn to provide anonymous IP addresses [Internet]. [cited 2012 October 08]. Available from http://search.cpan.org/dist/IP-Anonymous/lib/IP/Anonymous.pm
Flot: Attractive JavaScript plotting for jQuery [Internet]. [cited 2012 October 08]. Available from https://code.google.com/p/flot/
ExplorerCanvas [Internet]. [cited 2012 October 22]. Available from http://excanvas.sourceforge.net/
About the Authors
Dr. Jason Cooper <j.l.cooper@lboro.ac.uk> is the Library Systems Analyst/Programmer at Loughborough University. He is responsible for developing and maintaining a number of key systems for the Library, including the front end of the LORLS (an open source reading list management system).
Dr. Jon Knight <j.p.knight@lboro.ac.uk> is the Library Systems Developer at Loughborough University. He is responsible for developing and maintaining the back end of LORLS (an open source reading list management system).
Gary Brewerton <g.p.brewerton@lboro.ac.uk> is the Library Systems Manager at Loughborough University and is interested in library automation, information and communication technology, and open source development (e.g. LORLS).

Subscribe to comments: For this article | For all articles
Leave a Reply