By Lydia Harlan, Kristin Buxton and Gabriele Hayden
Introduction/ Background
At University of Oregon (UO) Libraries high level collections decisions are made by a collection managers group consisting of representatives from acquisitions, electronic resources, subject librarians, and access services. Facing a possible large cut to the collections budget in Fiscal Year 2022, this group started talking about how to decide which serials to cut. Cost Per Use (CPU) was raised as one starting point for making data driven decisions.
Historically at UO, usage data has been stored in manually created spreadsheets with data compiled from all vendors, while cost data has been stored in Alma. When small package cancellations were on the table in previous years, CPU was hand generated for those titles. The employees who manipulated the spreadsheets were understandably reluctant to hand generate CPU for the over 78,000 rows of usage numbers for combined vendor statistics at that time.
Two of the authors, members of the collection managers group, began exploring alternative options. We knew that there were commercial products that would provide this data but didn’t have buy-in from the necessary stakeholders to purchase a tool. Instead, we pulled in a third colleague with data experience to help create our own tool. We wanted to provide CPU for as much of the continuing resources collection as we could in ways that would be easily understandable for the subject librarians who would need to use the data.
Literature Review
As Harker ( [1] 2022, 355) has observed, the cost per use metric “has become ubiquitous and nearly universal for evaluating resources, especially renewable resources such as journals and databases,” because it is straightforward and easy to grasp. Most articles discussing cost per use address controversies regarding whether cost per use should be used, the specific metrics and processes that should be included in a cost per use analysis, or limitations to the specific metrics (such as COUNTER 5) currently in use.
Less common are articles describing the technical details of reproducible pipelines for gathering and deploying cost per use analyses. This may reflect the challenges of using proprietary software (such as Power BI) to work with data protected by license agreements. The few articles that did address technical access questions were very helpful to our project. Pesch ( [2] 2015) offers a basic primer for using SUSHI and COUNTER, while Boardman and Thompson ( [3] 2022) describe using Alma Analytics to programmatically query SUSHI APIs and visualize Counter statistics, documenting that it could be done even if they did not share the technical details needed to execute the project. This paper aims to fill a gap in the scholarship by offering a clear, step-by-step description of what we did that may be of use to others.
Approaches to the Pipeline
In the first iteration of this project, we created a CPU table in Excel by merging spreadsheets of usage and cost data. (Figure 1)
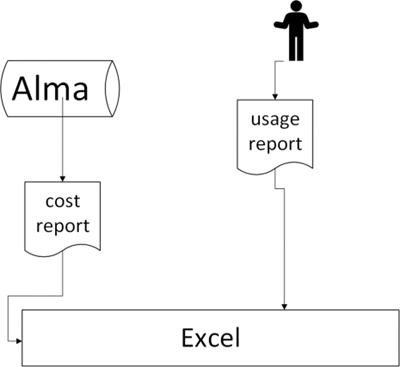
Figure 1.
We performed lookups on title and ISSN for journals where we had both usage numbers and payment history. We were able to calculate the CPU for many of our journals and created graphs to make the data more visual. We ended up not needing to make major cuts to our journals budget at that time, so this tool wasn’t needed immediately. We decided there was still value in improving our report. This Excel-only version had two major limitations: 1) it was challenging to update with new usage numbers and 2) sharing the underlying usage along with the visual meant sharing a very large Excel file vulnerable to user error, easily unintentionally manipulated to show false results.
We next decided to import the Excel files into Microsoft Power BI. (Figure 2)
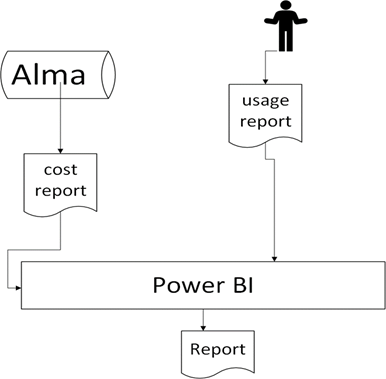
Figure 2.
Power BI allows easier update of datasets, provides additional visualization options, and offers a way to share visuals and tables of data without needing to share the underlying data files. We successfully translated the data transformations we had conducted in Excel into Power BI. However, this version still relied on the laboriously hand-created Excel usage data file.
The next step was to gather usage statistics dynamically by querying the SUSHI APIs of our vendors. We experimented with making SUSHI calls directly from within Power BI and were successful in getting the process to work with a static table, but we couldn’t find a way to continually add the next month’s usage in a way that would store the data properly. (Figure 3)
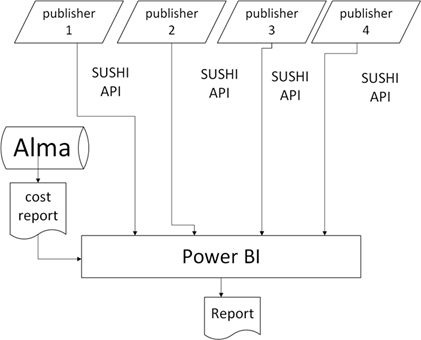
Figure 3.
We learned that this is a deliberate limitation of the Power BI software, which is not designed to function as a data source but instead to draw on more stable data sources such as SQL databases. We would have needed to store the data outside of Power BI, which negated the elegance of establishing SUSHI calls from within Power BI.
We finally settled on using the SUSHI harvester in Alma to gather and store our data. (Figure 4)
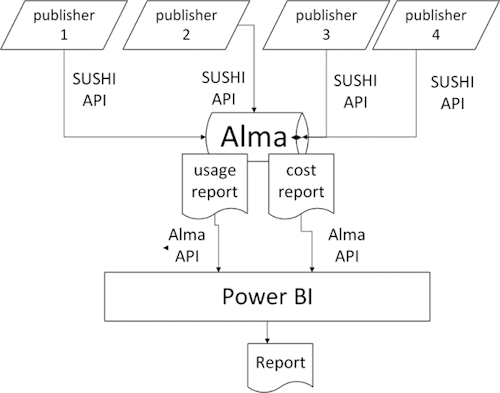
Figure 4.
Alma is designed to both harvest and store usage data, and we knew we could get the information out of Alma using Alma Analytics’ SQL database. However, if we wanted a fully dynamic report, we would then need to query Alma to retrieve cost and usage reports on a monthly basis. We explored querying the Alma Analytics API using Power Query (M) within Power BI but found it very difficult to troubleshoot errors. (Figure 5)
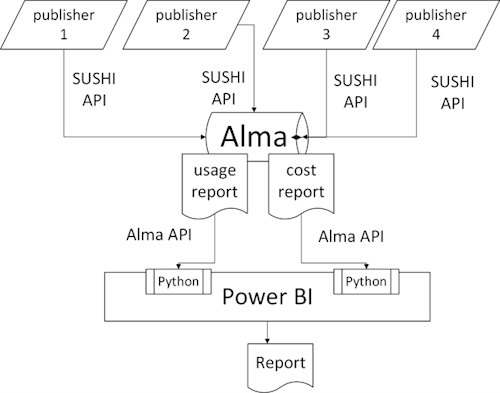
Figure 5.
We decided instead to use a Python script embedded in Power BI to query the Analytics API to retrieve both cost and use data. We then used Power BI to transform the data, calculate and visualize cost per use, and distribute our dashboard to internal stakeholders.
In this final model SUSHI API accounts are set up for as many vendors as possible in Alma, which harvests the tr_j1 reports monthly. Alma Analytics reports are established to capture cost and usage statistics. Python scripts embedded in a Power BI M query retrieve each report via an API and loop through the data using a resumption token (required for data of more than 1,000 rows). The Python code pulls in the complete dataset each time we want to update it, which we can do by simply pressing the Refresh button in Power BI. More M code simplifies the data. DAX code then merges the data from the two datasets to calculate cost per use. Power BI’s visualization tools are used to create a dashboard that can be shared with stakeholders.
If you want to implement a model like this one in your system, full step-by-step details can be found in Appendix A.
The Dashboard Visualized
Our current dashboard includes four views. The first uses a bar chart to display journal titles and their cost per use with the ability to filter by fund and fiscal year. (Figure 6) The second provides a table of usage data across multiple fiscal years, filterable by fund and searchable by platform, publisher or title. (Figure 7) Our third display is a table of titles that might be cheaper to obtain by ILL than subscription, based on the usage patterns and average ILL cost. (Figure 8) Finally, we have an About page that provides information about the dashboard.
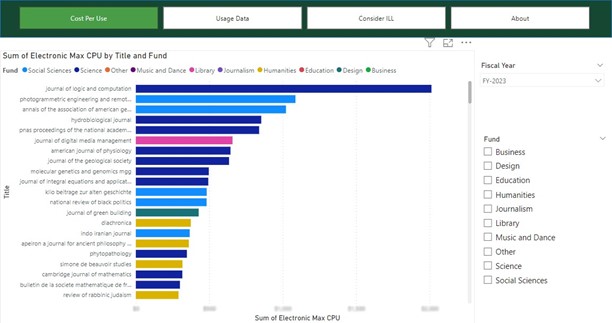
Figure 6.
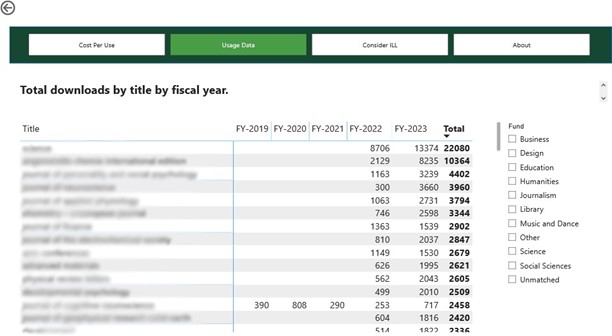
Figure 7.
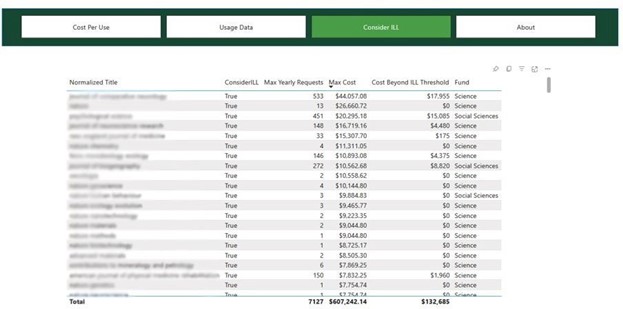
Figure 8.
Cost Per Use Defined
Because this is a proof of concept for our technical pipeline, it uses a very simple definition of cost per use, as the number of uses as defined by COUNTER tr_j1 reports divided by the annual amount we paid for the product — counting only journal use and excluding databases and eBooks. We do not, for example, address any of the issues of open access articles discussed by Jabaily ( [4] 2020) or addressed by the Unsub [5] product. However, the nature of Power BI as a tool that can aggregate and visualize data from a variety of sources means that we hope that this pipeline will be the basis for creating more robust analyses. In the future, for example, we might adjust for open-source access, include eBooks and databases, or incorporate elements such as tracking the journals our faculty and graduate students cite or publish in.
Assumptions and Limitations
In the process of writing up this project we had to distill it down to steps that are communicable and helpful to others. In reality, this was an iterative experience with several dead ends. We frequently tested elements as proof of concept before investing time in developing those same elements on the larger scale. It’s possible there are more efficient approaches, especially related to the normalization of titles and ISSNs. We decided to stick with what was working and not get bogged down in perfection, in the spirit of getting it done. We know there are steps we’d like to improve, some quirks that need troubleshooting, and plenty of opportunity for additional report types and other upgrades, as well as regular ongoing maintenance. We welcome feedback and inquiries via email or via issues on our GitHub repository.
There are gaps in the data where publishers don’t provide SUSHI access, or COUNTER 5 formatted reports, or don’t do so in a timely fashion. Additionally, we have not yet systematically filled in gaps between the beginning of the existence of COUNTER 5 and the initiation of SUSHI harvesting within our instance of Alma. At times the titles or ISSNs don’t line up perfectly, or we have usage reported from multiple platforms. We removed the Gale and JSTOR aggregator platforms from our data, and don’t currently have a way of evaluating this usage. We do not include print usage of our collection at this time. In our initial Excel model print usage was very low and usage was not of recent issues, so we determined that including print usage would not add value to our model.
We made several assumptions along the way that led to the data being useful but not always completely precise. For example, if we don’t have a payment for the current year, we base our calculation on the previous year’s payment, even though it is likely not the same. We also have instances where the calculated CPU is zero. This includes cases where the title and/or ISSN aren’t a perfect match between our usage and cost data, journals that we pay for as part of a package but receive usage on a per-title basis, and journals only available on platforms we removed from consideration because they’re primarily backfiles, like JSTOR.
In short, the data is still messy, and while we have plans for how to fix some of these issues, it will never be perfect. Power BI’s visualization can be deceptive, even seductive. We think our model looks pretty, but we still must put our thinking caps on to be sure that those attractive charts mean what we think they mean. Each of our displays is meant to be a starting point for cancellation decisions rather than a rigid list of things that must be cancelled.
Discussion and Future Work
We set up this model using only the tr_j1 report, and once we gain some experience consulting the model for assistance with deselection decisions, we plan to add more report types. We’re interested in adding historical usage data by uploading COUNTER 4 stats to Alma in order to add more years into the model. We may also consider additional calculations beyond CPU that might be useful for our collection assessment needs. The way these reports are written, we shouldn’t have to make major changes until there are significant changes with either COUNTER or Alma Analytics. This is intentional, so that we can keep the pipeline running with as little maintenance as possible.
Power BI lets us share out a dashboard that any of our colleagues can use to see the visualizations and tables of data. We have yet to use this model for significant cuts, and surely that experience will teach us a lot about what else we need to do to improve this tool. In the meantime, we have sent the model out to our collection managers and subject librarians for review, feedback, and to begin using it to help inform decisions. We encourage our colleagues to use the data as a starting point for collections decisions, rather than as the single tool to make the decisions. Along with the data we’ve shared information about the limitations of that data. So far, we have used this model to extract statistics for administrative reports, and as a starting point for database assessment.
Visualization can help us analyze the data to uncover patterns, trends, and correlations that might not be apparent from a spreadsheet alone. These deeper insights can help us make better decisions. By automating the process, it makes year-over-year comparison more achievable. It also sets us up for expanding the types of reports to intake and types of content to analyze in a reproducible way. With regular updates, the tool will grow more useful over time as gaps are filled in. We expect this tool, and permutations of it, will help our collections management team make data-driven decisions to meet the collections and access needs of our students and faculty.
Notes
[5] Unsub: https://unsub.org/
References
[3] Boardman, Erika, and Jennifer France Thompson. 2022. “Visualizing COUNTER Metrics with SUSHI: Exploring Alma Analytics for E-Resource Evaluation.” Serials Review, September, 1–3. https://doi.org/10.1080/00987913.2022.2120328.
[1] Harker, Karen R. 2022. “The Depths of Cost-per-Use: Historical Context and Applications.” Library Trends 70 (3): 355–86. https://doi.org/10.1353/lib.2022.0000.
[4] Jabaily, Matthew J. 2020. “Recalibrating Cost-per-Use: Implications of COUNTER Release 5 and Unsub.” Serials Review 46 (4): 292–99. https://doi.org/10.1080/00987913.2020.1850040.
[2] Pesch, Oliver. 2015. “Implementing SUSHI and COUNTER: A Primer for Librarians: Edited by Oliver Pesch.” The Serials Librarian 69 (2): 107–25. https://doi.org/10.1080/0361526X.2015.1063029.
About the Authors
Lydia Harlan is the Budget Analyst for Collections, Discovery, and Digital Strategy at University of Oregon Libraries. A librarian by training and budget analyst by circumstance, she holds an MLIS from San Jose State University and a BA in film from Emerson College.
Kristin Buxton is Head of Science Liaisons and Librarian for Computer Science, Mathematics and Physics at University of Oregon.
Gabriele Hayden is Head of Data Services and Librarian for Research Data Management and Reproducibility at the University of Oregon. She holds a PhD in English from Yale and a BA from Reed College.
Appendix A
A Step-by-Step Guide to Building an Alma to Power BI Pipeline for Cost Per Use
- Establish prerequisites
- To replicate our approach, you will need access to, knowledge of, and some skills in Alma, Alma Analytics, COUNTER 5, APIs, SUSHI, Python, and Power BI.
- Power BI Desktop requires a Windows PC.
- It is helpful to have some elementary familiarity with programming with SQL in Alma Analytics and M and DAX languages in Power BI, in order to make adjustments that work better for your needs and workflow.
- Set up vendors with SUSHI API in Alma with tr_j1 reports types enabled
- Follow the “Managing SUSHI Accounts” section of Ex Libris documentation “Managing COUNTER-Compliant Usage Data”. [1]
- Set up vendors manually in Alma.
- Identify administrative usernames and passwords for the content providers and the next layer of credentials for SUSHI: the customer ID, requestor ID, and occasionally, API key. Please note:
- Some SUSHI credentials can be found on the content provider’s website, but others cannot. It may be necessary to contact customer service to obtain them.
- Many credentials changed during the switch from COUNTER 4 to 5.
- Credentials can change at any time without notice.
- Establish the base URL for the SUSHI API string. Please note:
- Commonly used vendors are already established in our consortial instance of Alma, and most of the time the base URLs were correct.
- If the “Vendor URL” doesn’t work in Alma, experiment with the “Override URL” field. One may need to add “/sushi”, “/sushi/”, “/reports”, or “/reports/” to the end of the base URL to pull a report successfully.
- “Requester” ID is spelled with an “e” in Alma and is spelled “Requestor”, with an “o” in COUNTER API strings. This is an important detail if you test the API strings in a browser.
- Under “Usage Report Types” in Alma, click “Add Report Type” to see the list of report types. Select tr_j1 to follow our example.
- Select “Test with Response” to test whether the connection is working and see an example of the harvest that Alma returns.
- Set up auto-harvest of SUSHI in Alma
- Follow the “Managing SUSHI Harvesting” section of Ex Libris documentation “Managing COUNTER-Compliant Usage Data”. [1]
- Once the vendors are set up, tested, and verified, enable the auto-harvest.
- Select a harvest date.
- After experimenting with different Alma preset dates, we settled on the 18th of the month to collect new usage reports.
- Enable the function to receive the monthly SUSHI harvest report by email once the harvest has been completed.
- The monthly SUSHI harvest report will list completed and failed attempts, with errors. Handling errors is described in step 12.a.
- This email signals that the Power BI model can be refreshed to intake updated usage statistics, described in step 12.c.
- Create an Alma Analytics report on costs
- Experiment with Ex Libris’ out-of-the-box reports or create your own. We did not find an Out-of-the-box report that met our specific needs.
- To follow our example, use Library Name, Fiscal Period Description, Transaction Expenditure Amount, Fund Code, Title (Normalized), ISSN, and PO Line Reference details including Item Description and filter on “continuous” continuity and an “active” status.
- Item Description provided the best results for us to be able to match titles with Normalized Title in the Usage Data subject area of Analytics, but this may vary with your cataloging workflow.
- Edit the column formula of Item Description to turn all item descriptions into lower case, like so – “
LOWER("PO Line"."Item Description“) – to begin normalizing the data. Removing proceeding articles occurs in a later step, in Power BI. It is also an option to lower the case in Power BI to do all the normalization steps in one environment. This may be the preferred method if Analytics formulas aren’t familiar. - Write both Analytic reports to display the fiscal year as “FY-XXXX” to enable matching between tables.
- Test the report and adjust as necessary for your data and institution.
- Create an Alma Analytics report on COUNTER 5 tr_j1 use
- We did not find an out-of-the-box report that met our specific needs.
- To follow our example, use TR_J1 – Unique Item Requests, TR_J1 – Total Item Requests, Usage Date Fiscal Year, Usage Date Year, Usage Date Month Key, Usage Date Month, Usage Date Quarter, Normalized Title, Normalized ISSN, Normalized EISSN, Origin ISSN, Origin EISSN, Normalized Publisher, Publisher, Normalized Platform, and Load File COUNTER Report Type.
- This report uses the normalized title, so no additional transformations are necessary.
- Write both Analytic reports to display the fiscal year as “FY-XXXX” to enable matching between tables.
- Test the report and adjust as necessary for your data and institution.
- Obtain permissions to use the Alma Analytics API key for Acquisitions
- Work with your institution’s Alma developer to get permissions and the API Key to use the “Retrieve Analytics Report” API, with secrets held in the Alma Developer Network.
- Follow Gandalf’s advice to “keep it secret, keep it safe.” [2]
- Build the path for each Analytics report with the root URL, Analytics report path, and Acquisitions API Key.
- Our path begins with https://api-na.hosted.exlibrisgroup.com/almaws/v1/analytics/reports?path= but it may vary for your Alma instance.
- Open either the cost or use report in Analytics. In the browser, copy the portion of the link for the Analytics report that begins after the equal sign. Add the copied text after the equal sign of the path you are building. Notice that when you copy and paste, blank spaces are replaced by “%20”. (Figure 1)
- Add “
&apikey=” and then the API Key for Acquisitions to the end of the path. - Repeat the steps in 6.b to build the second report URL.
- Test each report.
- There are many options for testing APIs, including putting the whole string in the browser.
- Another way to test this is to set the API as the data source in Power BI.
- Review the data. If your data is more than 1,000 rows, you will need to use a resumption token to retrieve the full set in Power BI. We were unable to get the resumption token to work using Power Query (M) directly, so we used a Python script to retrieve the report and pass in the resumption token, as described in the next step.
- Write a Python script to query the Alma Analytics API, including resumption tokens to retrieve more than 1,000 results
- We based our Python query on a well-documented set of instructions for how to query the Open Alex API created by Eric Schares and Sandra Mierz. [3]
- Feel free to copy our code, which is available in several different versions. [4]
- Because the Alma Analytics API has access to patron information, we maintained a high level of security. We initially did this by creating a Python script tracked in GitHub that used the
configparserlibrary to pull in our secrets (API key and report paths) from a separateconfig.inifile not tracked in GitHub. - We recommend testing your Python code outside of Power BI using your preferred Python interpreter with debugger since Power BI doesn’t have a Python debugger built in.
- However, because Power BI does not allow the Python code to consult other files (such as a
config.inifile) we manually created a version that no longer usedconfigparserto reference a separate file with secrets, but instead included all secrets hard coded into the Python script. In the next section, we discuss how we added this hard-coded script to Power BI, and how we modified it to allow each secret to be a Power BI parameter. - Establish Power BI connection cost and use reports using Python script
- To add a Python script to Power BI, first follow the instructions in Microsoft documentation to install Python on the desktop (a virtual environment is recommended), import any necessary Python libraries (we used pandas,
xml.etree.ElementTree,requests, andtime), configure Python access in Power BI, and enable permissions. As of this writing, all Python data sources need to be set to “Public” to work with the Power BI service. - Once permissions are configured, in Power BI Desktop, select “Get Data” and scroll down to select “More” to open up a new box. Scroll down to select “Python script” and then click “Connect”. Paste the Python script in the text box, then click “OK”. If the script runs correctly, you will be prompted to load data into a Power Query table. The first applied step for this data will be “Source,” and a gear icon to the right of the step allows you to open and view the Python script as originally entered.
- To see the Python script as it appears loaded into a Power Query (M) script, open “Advanced editor” in the Power Query ribbon. Note that Power BI has translated the script by wrapping it with a command to run in Python and adding
#(lf)where each line ending was in the original Python. - We recommend turning the hard coded secrets (API key and report path) into Power BI “Parameters” that can be more easily updated by those less proficient with Python or M. To do this, first follow Microsoft’s instructions to create your parameters. For our code we created four:
url,api_key,use_data_pathandcost_data_path. Be sure to specify data type “Text” and enter each parameter with quotation marks around it. For example, theapi_keyparameter will look something like “k3lk2ke4536kjklk4” (quotes included). - Now return to the “Advanced editor” window in Power Query and replace the hard coded API key, which will be something like “k3lk2ke4536kjklk4”, with “
& api_key &”, whereapi_keyis the name of the parameter, and the replacement code begins and ends with double quotes. - To see our Python code in the Power BI context, open the Power BI template (.pbit) file available in our GitHub repository, https://github.com/uodataservices/cost_per_use/. [5]
- If no appropriate Alma Analytics reports are configured, enter the real url, api_key, use_data_path and cost_data_path values. If not, enter any placeholder value into the fields (like “test”) to access our Power BI model. Either way, click “Load”.
- You may need to give permission to Power BI to run the script.
- There will be a delay as Power BI tries to make the API calls.
- If parameters have “test” entries, you will see a popup window warning of Python script errors. Go ahead and close that error box.
- Despite more error messages, you are now in our Power BI file and can explore every step of our data transformations in Power Query (M) and DAX.
- Find the Python code by choosing “Transform Data” and then clicking on the “Advanced editor” for either the usage_data or cost_data tables.

Figure 1.
The following steps will explain how we worked with our data once it was imported into Power BI. You can look for these steps in the Power BI environment to go with the steps described.
- Match cost and use data on ISSNs and Titles using M and DAX languages
- Once a connection is established, transformations will need to be done in Power Query using the M language to open the tables, normalize data, and prepare it for matching.
- Starting with the cost data, open the data tables by clicking on the arrows that point simultaneously left and right until all the column carrots point down and you have drilled down to the columns so that they match the Alma Analytic on costs. (Figure 2)
- You may need to change data types (e.g. convert numbers to currency), remove unnecessary columns, rename columns for clarity, etc. so that your data makes sense and functions well in Power BI. This is an interactive process that you will need to customize for your data and needs.
- Recall that we lowered the case of the Item Description in Alma Analytics. At this point use M code in Power Query to remove the beginning “the” and “a” to further normalize and match these titles with the titles that will appear in the use table.
- Code for removing “the”:
= Table.ReplaceValue(#"Renamed Columns", each [Title Normalized], each if Text.StartsWith([Title Normalized],"the ") then Text.RemoveRange([Title Normalized],0,4) else [Title Normalized], Replacer.ReplaceText, {"Title Normalized"}) - There may still be differences in the cost table versus usage table between “and” and “&”, punctuation in the middle of a title, and other unknown differences.
- Code for splitting by delimeter:
= Table.SplitColumn(#"Replaced Value", "ISSN", Splitter.SplitTextByDelimiter("; ", QuoteStyle.Csv), {"ISSN.1", "ISSN.2"}) - Optionally, add a conditional column for Fund Code Display and group fund codes by broader category to make this information more digestible to subject librarians. Anecdotally, our funding schema is more complicated than most libraries, so you may not need this step.
- Move to the usage data, and open up the data tables until you have drilled down to the columns so that they match the Alma Analytic on use, like in step 8.a.1.
- Normalize titles here as well, removing the beginning “the” and “a” so that they will match with the titles in the cost table.
- Again, you may need to change data types, remove columns, rename columns, etc. so that your data makes sense and functions well in Power BI. This is an interactive process that you will need to customize for your data and needs.
- Navigating out of Power Query, and into the tables, at this point you should have one table for cost and one table for use. Our table for cost has all the columns we built in the Alma Analytic on cost as well as the split ISSN columns and the Fund Code Display column.
- Create a use summary table. Cost data is available per fiscal year, while usage data is available aggregated by month. To simplify joining information, we summarized usage data in a new table and matched the summaries with cost data on ISSNs or normalized titles.
- Here is the DAX code for the usage summary table including the sum of Total Requests:
usage_summary = SUMMARIZE('usage_data', usage_data[Usage Date Fiscal Year], usage_data[Normalized Title], usage_data[Normalized Platform], usage_data[Normalized Publisher], usage_data[Normalized EISSN], usage_data[Normalized ISSN], "Total Requests", SUM(usage_data[Total Requests])) - With the usage summary table established, match on ISSN and title.
- We started with ISSN1 of the cost table and matched it against the Normalized EISSN of the use table. Here is the DAX code:
ISSN1 by Normalized EISSN = CALCULATE (SUM ( 'usage_summary'[Total Requests] ), FILTER ( 'usage_summary', AND(AND('usage_summary'[Normalized EISSN] = 'cost_data'[ISSN1], 'usage_summary'[Usage Date Fiscal Year]='cost_data'[Fiscal Period Description]), IF(AND('cost_data'[ISSN1] = "", usage_summary[Normalized EISSN] = ""), FALSE, TRUE))) - We made a new column for ISSN2 by Normalized EISSN, and so on, as well as Title by Title.
- Because of data irregularities, we chose to calculate Cost Per Use in a fuzzy way using the most expensive year and the highest use year. It will not be exact for data in a specific year. Since this information is meant to discover outliers, this level of detail is sufficient for our needs. To calculate Cost Per Use we added columns for maximum use and maximum cost per use:
- Electronic Use Max:
Electronic Use MAX = ROUND(MAX('cost_data'[Title by Title],MAX(MAX('cost_data'[ISSN1 by Normalized EISSN],'cost_data'[ISSN1 by Normalized ISSN]),MAX('cost_data'[ISSN2 by Normalized EISSN], 'cost_data'[ISSN2 by Normalized ISSN]))),0) - The employment of the ROUND function is to resolve troubles with a fraction of a use.
- Electronic Max CPU:
Electronic Max CPU = IF([Electronic Use MAX]=0,0,'cost_data'[Transaction Expenditure Amount]/[Electronic Use MAX]) - Recognizing that borrowing material is also an option in libraries, we included a formula for the Cost Beyond ILL Threshold, and a column for how that formula translated into whether to consider ILL instead of subscription.
- This is our formula for Cost Beyond ILL Threshold, assuming documents through Reprints Desk cost $35 and we can request an item 20 times before having to pay for it [5]:
Cost Beyond ILL Threshold = IF('cost_data'[Electronic Use MAX]-20<0,0, ('cost_data'[Electronic Use MAX]-20)*35) - The Consider ILL column is a simple True / False statement:
ConsiderILL = IF(AND('cost_data'[Cost Beyond ILL Threshold] < 'cost_data'[Transaction Expenditure Amount],cost_data[Electronic Use MAX] > 0 ), TRUE, FALSE) - Create a table for ILL vs Subscriptions so that it can be shown as a visualization. Here is the code:
ILL_vs_subscription = SUMMARIZE('usage_summary', usage_summary[Normalized Title], usage_summary[Normalized Platform], usage_summary[Normalized Publisher], usage_summary[Normalized EISSN], usage_summary[Normalized ISSN], "Max Yearly Requests", MAX(usage_summary[Total Requests])) - Create visualizations based on cost and use
- The point of all of that data wrangling was to be able put together a cost per use visualization, and now that all that hard work is done, the visualization is relatively straightforward. For Cost Per Use, we chose a stacked bar chart, used Title Normalized for the y-axis and the sum of Electronic Use Max CPU (step 7.d.ii) for the x-axis, and added the Fund Code Display (which we shortened to Fund) as the Legend. We added slicers for Fund and Fiscal Year. The display can be filtered by these slicers, or it can be searched by title. (Figure 6 of main paper)
- For a closer look at the usage data, on the second tab, we created a table drawn from the Usage Summary table’s Normalized Title, Total Requests, and Usage Data Fiscal Year, and added in a slicer for Fund. This table can be filtered by fund or searched by platform, publisher, or title. (Figure 7 of main paper)
- The third display is a table of titles that might be cheaper to obtain by ILL than subscription, based on the usage patterns and average ILL cost. (Figure 8 of main paper)
- The last tab is an About page, covering the highlights of what is and isn’t included in the data, known limitations, and the process overview.
- Publish the Power BI web dashboard/report so you can share it with colleagues
- In the Power BI cloud app, create a Workspace where you will share the model.
- Name the Workspace, describe it, and add the people who you want to have access to it.
- In Power BI Desktop, click “Publish” and select the Workspace where you want to upload it.
- Navigate to the Report in the Workspace and then click the “Share” button to share the report colleagues.
- Perform ongoing maintenance
- Continually refresh vendor usernames and passwords, harvest credentials, API keys, changes to platforms and base URLs as needed.
- There are a variety of errors to work through on the monthly SUSHI harvest report, ranging from the vendor’s usage dates not being available yet, to failure to connect, to retrieving unwanted reports. It is helpful to have Alma’s monthly SUSHI harvest report emailed the person managing the accounts to identify and troubleshoot errors.
- SUSHI errors are described by Project Counter. [6]
- Alma / SUSHI errors are well described by CARLI. [7]
- Add new vendors as they enable COUNTER 5 reporting.
- Monthly, after Alma performs the SUSHI harvest, refresh the data in Power BI.
- Open the Power BI model in Power BI Desktop
- Click “Refresh” to bring in both the updated cost data and usage
- Click “Publish” to overlay the currently published model with the updated one.
- Click “Save” to save the updated workbook.
- A message will pop up about overlaying the currently published data set. Agree, and click “Replace”.
Figure 2.
iv. The field ISSN contains multiple ISSNs. There were as many as six ISSNs, but we decided that two would be enough to match on. We split the column by a delimiter to separate the first two ISSNs into two columns.
statistics.
Appendix Notes
[1a][1b] “Managing COUNTER-Compliant Usage Data”: https://knowledge.exlibrisgroup.com/Alma/Product_Documentation/010Alma_Online_Help_(English)/020Acquisitions/090Acquisitions_Infrastructure/010Managing_Vendors/Managing_COUNTER-Compliant_Usage_Data
[2] See the movie “The Lord of the Rings: The Fellowship of the Ring”
[3] OpenAlex-CitedReferences: https://github.com/eschares/OpenAlex-CitedReferences
[4] Available at our project Github repository (https://github.com/uodataservices/cost_per_use) and archived in Zenodo at https://zenodo.org/records/10426231.
[5] This formula is based on a formula created by our colleague David Ketchum, Director of Access Services at UO Libraries.
[6] Appendix F: Handling Errors and Exceptions https://www.projectcounter.org/appendix-f-handling-errors-exceptions/
[7] Alma SUSHI Harvesting Status Examples https://www.carli.illinois.edu/products-services/i-share/electronic-res-man/sushierror

Subscribe to comments: For this article | For all articles
Leave a Reply