Introduction
The WGBH Media Library and Archives has embarked on a project to design and pilot an online media archive for scholarly research. Having launched http://openvault.wgbh.org in 2006 for educators and the general public, we are now focusing on the specific needs of academic researchers with our pilot site, http://openvaultresearch.wgbh.org.
The goal of the project is to work with three prominent scholars to design a web-based system to address the needs of archive users in terms of searching, selecting, and accessing archival moving image materials. In conversation with our scholars, WGBH staff have discovered that academic researchers want to get a broad overview of our collections immediately and then quickly pinpoint items relevant to their work. In addition, they are extremely interested in learning how materials within the collection relate to each other.
For example, scholars researching in media collections may be interested in a particular sequence of footage. They want to view and analyze the content, but they also seek information about its provenance: who shot it, who owns it, and how it was used (or not used) by producers for a particular documentary program or web site. Successfully translating this information to a searchable and quickly scannable web site is our objective.
One strategy we have employed in service to this end, has been to create an online visual representation of the relationships among and between items in the collection. While our scholars have struggled to become oriented to this visual method of surveying content, we are confident that further research and revision will prove our graph to be one useful device in the researchers’ toolkit.
The Challenge of Moving Image Archives
There are three major challenges for moving image archivists trying to serve the needs of researchers. The first is lack of exposure. Media archives have traditionally been more difficult to access than paper-based archives because of obsolete formats and playback technologies. Add to this copyright barriers, some scholars’ attitudes towards the use of media as a source, and the relative newness of history captured as moving images, and we find that media archives are only beginning to gain momentum in the research arena.
The second challenge for moving image archivists relates to access strategies. The standards for cataloging moving image materials have traditionally mimicked bibliographic cataloging. They have focused on finished films with titles and authors. However, in order for researchers to find and access raw footage and film elements, these materials must be cataloged at the item or sub-item level. This work is not only labor intensive, it also requires direct access to the materials via transfers, digitization, or the use of rare and aging playback equipment. For all of these reasons, moving image archives find themselves struggling to make their collections easily accessible to researchers and the public.
Finally, moving image archives face a number of technical challenges, due to the lack of existing applications and utilities for managing and exposing the repositories that are developed. Consequently, there are few common or broadly applicable policies and frameworks for the legal issues, vocabulary development, and information discovery. The digital media files themselves pose problems for archivists as the file size of preservation quality video makes redundant copies of video expensive, but necessary in the volatile landscape of evolving compression formats.
Media archives themselves face obsolescence, however, if they do not find a way to make their collections accessible. Given the rise of YouTube, Hulu and the current generation of “digital natives” who take video on the web for granted, moving image content must be exposed on the web or it may as well not exist. As the keepers of rich historical materials, moving image archivists find themselves at a turning point. With the exception of media studies, established humanities scholarship has yet to recognize film and television archives as a go-to source. Yet, history is increasingly born digital and, just over the horizon, the younger generation expects their content to be delivered online and on-demand.
Background
In order to bridge the gap between the seasoned generation of scholars who seldom use media and the emerging generation of scholars who demand it online, The Andrew W. Mellon foundation has been supporting projects which seek to make archival moving image content easily accessible. We launched our prototype in November of 2008 in order to solicit feedback from our scholar advisors. We continue to gather user input and plan to revise the site based on this data in Spring 2009.
Established in 1978, the WGBH Archives contains 750,000 asset level records representing the film, videos, still images and documentation gathered in the course of our productions. Each of these components, gathered for one project initially, are constantly used and re-used by various productions. Therefore the relationships between these assets are often highly complex. WGBH productions collect hundreds of assets in the course of their research, much of which never makes it into the final documentary films. For example, the American Experience‘s 2 hour documentary on Jimmy Carter deposited 2040 assets into the archive on shutdown. While three minutes of an interview may be edited into a final documentary, the archives hold the entire hour-long interview conducted by the filmmakers. A five-minute sequence of news footage ordered from a network news station may be trimmed to 20 seconds for a production, but the archives hold the full five minutes for the next production to exploit.
Other examples include an interview with physicist David Wilkinson filmed in 1998 for A Science Odyssey which was also used in NOVA‘s “Origins: Back to the Beginning” in 2004. Footage shot for a documentary on Huckleberry Finn was re-used by American Experience for a film on Kit Carson. Each of these uses are recorded in both our electronic databases and in legal documents also housed within the archives. One shot of moving image material, therefore, is represented across multiple databases and referenced by multiple related assets. Our repository architecture attempts to record descriptive information about intellectual content (programs, series, etc), which allows us to create explicit relationships between digital objects from information once inferred from naming conventions in a physical assets database. This work will help tie together the loosely federated databases to provide an accurate and complete description of provenance.
Assets also share common themes by subject, location, and personalities. For example, WGBH producers have interviewed former National Security Advisor Robert McFarlane on four different occasions for four different projects. A search across the archives for Reagan or McFarlane reveals this wealth of oral history content. WGBH researchers working on a documentary on Taiwan spent months gathering materials before they narrowed their selections for editing into their film. The archives, therefore, hold a wealth of material on Taiwan which never made the final cut of the program. Our prototype seeks to illustrate these subject based relationships for researchers explicitly.
For our descriptive metadata we are using several linked data sources which, we hope, provide sufficient information to construct broader terms or general categories of information, so additional data can be derived easily from external data sources (e.g. a map of locations covered by pulling in latitude/longitude information from resources like the Getty Thesaurus of Geographic Names or even the folksonomic Freebase) and potentially re-integrated into the search index for a better search experience. We also provide tagging suggestions from our controlled vocabularies for folksonomic data, which we presume will make re-integrating user-generated material easier.[1]
Our challenge is to make our content accessible not only in an orderly way, but also in a way that allows for quick surveyal and for “serendipitous discovery.”[2] While uni-dimensional data is quite easily expressed in lists and tables, the material in our archives rarely is so easily categorized. We are therefore experimenting with visualization as a new way for researchers to explore and browse our media collection and to see the relationships between assets based on shared subjects, persons and provenance. Our current solution, a radial graph, also serves a secondary purpose: it creates a visually rich and interesting glimpse into our collections, themselves primarily visual. In this way, it helps acclimate the researcher to the types of materials they will find within our site.
The Cataloging behind the Visualization
As a media archive, our cataloging needs are very different from those of a library. We also do not fall into the traditional archival framework of the finding aid. We arrange as archivists but describe as librarians. That is to say we manage series and collections of materials whose provenance is of utmost importance, but, because of both the non-human-readable formats on which our collections exist, and because our content is so visually oriented, we must describe our materials to the item and even sub-item level.
Without thorough item level description, we have found that our media assets are of relatively little use because items of interest are difficult to uncover. At the same time, without collection level context, they lose much of their value to scholars.[3] To exploit the meaning and content of individual assets in a media archive, or any archive for that matter, the researcher must be able to see a larger picture. For our project, we have attempted to draw this picture by illustrating selected metadata-driven relationships between assets.
Our descriptive metadata is contained within a PBCore XML document, one document per digital asset. [4] WGBH has an internal Digital Asset Management (DAM) system from which we export metadata, which is converted to PBCore XML, and groomed as necessary. While PBCore describes media assets accurately, it is a relatively new and underutilized standard, and we have found some areas for improvement. To supplement the PBCore vocabulary we have used XML namespaces to “mash” in, for example, the more precise date elements from the European Broadcasting Union’s EBUCore. [5]
For the purposes of visualizing the collection, the most important elements in the PBCore document are coverage (spatial), creator, contributor, and subject. We have struggled with the schema which defines contributor rather loosely and sometimes conflicts with our “people as subject” cataloging. For example, in an interview with Jimmy Carter’s National Security Advisor Zbigniew Brzezinski, should Carter himself be a <contributor>, with other personalities, or should he be classified as a <subject>, with more abstract concepts? These are the kinds of cataloging kinks we are still working out.
Although the PBCore document serves as a high level summary of an archival asset, the real nitty-gritty details which greatly enrich the visualization come from the asset’s sub-item or content level description: a TEI encoded transcript or shot log. Using the “Transcriptions of Speech” profile of the Text Encoding Initiative we tag people, places, dates, and subjects where applicable. We have made use of the Library of Congress Authorities and Subject Headings as our cataloging authority wherever possible. As a back-up, we make use of Wikipedia terms. For geography, we utilize the Getty Thesaurus of Geographic Names or TGN.
Below is a sample from an encoded transcript of our interview with Zbigniew Brzezinski about President Jimmy Carter:
<keywords scheme="http://authorities.loc.gov">
<term xml:id="Carter_Presidency" xhtml:href="http://authorities.loc.gov/cgi-bin/Pwebrecon.cgi?AuthRecID=55297&amp;amp;amp;amp;amp;amp;amp;v1=3&amp;amp;amp;amp;amp;amp;amp;HC=3&amp;amp;amp;amp;amp;amp;amp;SEQ=20081021125716&amp;amp;amp;amp;amp;amp;amp;PID=sIKaMkQj81YZYqeVLTUtQWiNzoVuN">United States. President (1977-1981 : Carter)</term>
<term xml:id="Jimmy_Carter" xhtml:href="http://authorities.loc.gov/cgi-bin/Pwebrecon.cgi?AuthRecID=1886254&amp;amp;amp;amp;amp;amp;amp;v1=1&amp;amp;amp;amp;amp;amp;amp;HC=3&amp;amp;amp;amp;amp;amp;amp;SEQ=20081021125716&amp;amp;amp;amp;amp;amp;amp;PID=sIKaMkQj81YZYqeVLTUtQWiNzoVuN">Carter, Jimmy, 1924- </term>
<term xml:id="Camp_David_Accords" xhtml:href="http://authorities.loc.gov/cgi-bin/Pwebrecon.cgi?AuthRecID=3527320&amp;amp;amp;amp;amp;amp;amp;v1=1&amp;amp;amp;amp;amp;amp;amp;HC=3&amp;amp;amp;amp;amp;amp;amp;SEQ=20081027185602&amp;amp;amp;amp;amp;amp;amp;PID=aq4Q-FxoB_MjtEHktCOpTplezKcyZ">Camp David Agreements (1978)</term>
<term xml:id="Middle_East" xhtml:href="http://authorities.loc.gov/cgi-bin/Pwebrecon.cgi?AuthRecID=4740719&amp;amp;amp;amp;amp;amp;amp;v1=1&amp;amp;amp;amp;amp;amp;amp;HC=3&amp;amp;amp;amp;amp;amp;amp;SEQ=20080924182635&amp;amp;amp;amp;amp;amp;amp;PID=o4OFiU_Y0RauYOwrZtlezJ99X7KhL">Middle East</term>
<term xml:id="Cold_War" xhtml:href="http://authorities.loc.gov/cgi-bin/Pwebrecon.cgi?AuthRecID=4818518&amp;amp;amp;amp;amp;amp;amp;v1=1&amp;amp;amp;amp;amp;amp;amp;HC=2&amp;amp;amp;amp;amp;amp;amp;SEQ=20080925121225&amp;amp;amp;amp;amp;amp;amp;PID=UiW3m7iQS1LraOT2IFfFIZNKSiJLC">Cold War</term>
</keywords>
<keywords scheme="http://www.getty.edu">
<term xml:id="China" xhtml:href="http://www.getty.edu/vow/TGNFullDisplay?find=china&amp;amp;amp;amp;amp;amp;amp;place=&amp;amp;amp;amp;amp;amp;amp;nation=&amp;amp;amp;amp;amp;amp;amp;prev_page=1&amp;amp;amp;amp;amp;amp;amp;english=Y&amp;amp;amp;amp;amp;amp;amp;subjectid=1000111">China (nation)</term>
<term xml:id="Soviet_Union" xhtml:href="http://www.getty.edu/vow/TGNFullDisplay?find=soviet+union&amp;amp;amp;amp;amp;amp;amp;place=&amp;amp;amp;amp;amp;amp;amp;nation=&amp;amp;amp;amp;amp;amp;amp;prev_page=1&amp;amp;amp;amp;amp;amp;amp;english=Y&amp;amp;amp;amp;amp;amp;amp;subjectid=6006211">Soviet Union (former nation/state/empire)</term>
<term xml:id="Poland" xhtml:href="http://www.getty.edu/vow/TGNFullDisplay?find=poland&amp;amp;amp;amp;amp;amp;amp;place=&amp;amp;amp;amp;amp;amp;amp;nation=&amp;amp;amp;amp;amp;amp;amp;prev_page=1&amp;amp;amp;amp;amp;amp;amp;english=Y&amp;amp;amp;amp;amp;amp;amp;subjectid=7006366">Poland (nation)</term>
</keywords>
<keywords scheme="http://en.wikipedia.org">
<term xml:id="Soviet_war_in_Afghanistan" xhtml:href="http://en.wikipedia.org/wiki/Soviet_war_in_Afghanistan">Soviet war in Afghanistan</term>
</keywords>
...
<div type="qa" xml:id="q39">
<u who="#q">
<seg xml:id="para80" smil:begin="00:27:04.788" smil:end="00:27:20.138">
Because he wasn't re-elected in <date when="1980">1980</date>, a lot of people thought his <name type="org" ref="#Carter_Presidency">presidency</name> had been a failure. Certainly on foreign policy we can look at some successes. Tell me about some of those. What do you think <name type="person" ref="#Jimmy_Carter">Carter</name> will be remembered for? What are the great central accomplishments?
</seg>
</u>
<u who="#a">
<seg xml:id="para81" smil:begin="00:27:20.138" smil:end="00:28:15.328">
Well, .. I think, quite a few. We in our conversations mentioned <name ref="#human_rights">human rights</name>. I think that was a very major accomplishment. It revived the American ideal worldwide. <name ref="#Camp_David_Accords">Camp David</name>, the first peace ever in the <name type="place" ref="#Middle_East">Middle East</name>. Normalization of relations with <name type="place" ref="#China">China</name> and a strategic relationship with <name type="place" ref="#China">China</name> at the high point of the <name ref="#Cold_War">Cold War</name>, when the <name type="place" ref="#Soviet_Union">Soviet Union</name> seemed to be cresting. Deterrence of the Soviet invasion of <name type="place" ref="#Poland">Poland</name> in <date when="1980">1980</date>, when the Soviets were about to march into <name type="place" ref="#Poland">Poland</name>, and <name type="person" ref="#Jimmy_Carter">Carter</name> took a very strong stand. Tough-minded response to the Soviets in <name ref="#Soviet_war_in_Afghanistan">Afghanistan</name>, which bogged the Soviets down for years. There're many others. Strategic agreement with the Russians. Although it didn't go terribly far, at least maintained that process of strategic normalization. And I'm sure I have skipped some, but that's not a bad list already.
</seg>
</u>
</div>
To make this information useful, we need to add it to a search index. To do so, we create a master PBCore record that combines the basic descriptive information with technical metadata and the terms from the TEI document using XSLT documents and the Fedora relationships. We developed a mapping for each keyword type to an appropriate PBCore element.
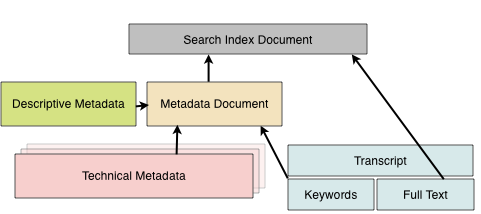 Figure 1: Metadata aggregation for search indexing
We are preserving the keyword URLs for future use, with the idea that future linked data applications may be able to take advantage of them, or that data providers will offer a usable API to access additional contextual information. This, we hope, will provide a valuable entry point to the content for semantic web enabled technologies and also allow us to use inferencing to provide broader and related terms in our browsing and faceted search interfaces.
As a result of our in-depth cataloging, we can do some very practical things, such as improving search results and providing relevant facets. Perhaps more interestingly, we can also do new and creative mashups of the data. These mashups, we feel, may provide a method for “serendipitous discovery” of our materials for the general public and encourage scholarly researchers to explore our material in a less structured manner.
As a starting point, we decided to explore abstract graph-based visualizations to help demonstrate the depth of materials within the collection and the complexity of internal relationships between them. Put another way, we are attempting to answer the questions: “What is the scope of your collection?” and “I am interested in this item; what else in your collection might be worth my time?”
The Technology
For our prototype, we experimented with two different types of visualizations: a force directed graph and a radial graph. Because of the diversity and expanse of the collection, we wanted to work with algorithms that created the graph independent of editorial control. Both layouts use the concepts of nodes and edges that connect them. The nodes are our descriptive records and the edges are the explicit metadata connections. To keep things simple, we have assumed there is a central node as a starting point, which also gives our users a starting point for their exploration.
To quickly begin using these visualizations, we picked two JavaScript libraries, JSViz (http://jsviz.org) and the JavaScript Information Toolkit (JIT) (http://thejit.org) , that accept JSON data to draw these graphs. To generate the dataset, we employed a very simple algorithm to gather up a set of related records:
- Retrieve the metadata for the central record and create a list of keywords
- Retrieve a new set of data that shares those keywords
- Repeat step 2 until sufficient data has been gathered (from brief testing, we decided repeating this process twice provided a good balance between an overload of information and sufficient context to encourage discovery)
This collection of records is serialized into JSON formats and used by the respective layout engines.
Force directed graphs
In a force directed graph, algorithms are used to calculate layouts that conform to a set of rules. At their most basic level, these rules define a physical simulation of the attraction of connected nodes and the repulsion of others, often expressed as analogous to electrical forces and spring systems. In Figure 2, the graph indicates that the central interview with Robert McFarlane (blue border) contains discussions of the Vietnam War, the Cold War, Marxism, and Terrorism. Other interviews also discuss these topics, and the proximity of their icons to McFarlane’s, indicate how many topics their interviews share in common.
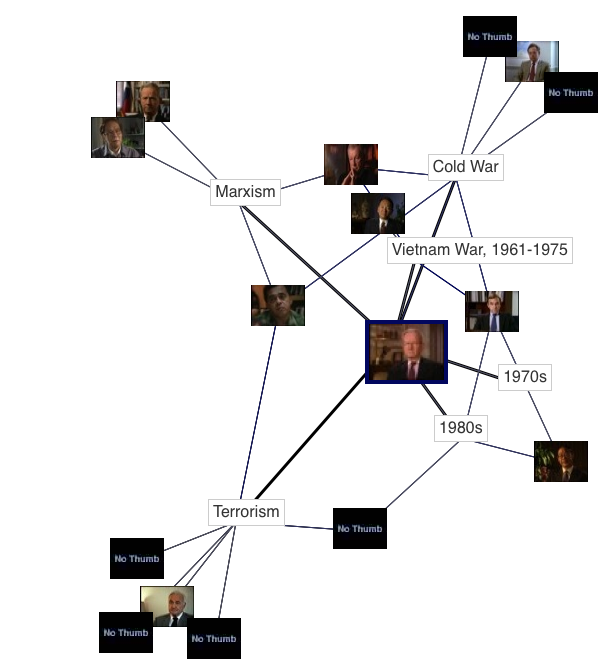 Figure 2: Force directed graph
We use the JSViz JavaScript library to draw these graphs. This also gave us the ability to add the “strength” of a relationship as a determining factor of the layout, which affects the proximity of two records and visually indicates relevancy. The biggest technical weakness in force-directed graphs, however, is they do not perform well with larger datasets because of the calculations needed to display them.
Radial graphs
Radial graphs are much simpler because everything is positioned on spokes of a fixed length, so that the records are arranged on a series of concentric circles. The closer the record is to the center indicates its similarity to the central record.
Figure 3 contains the same content as Figure 2, however, placement of related assets is restricted by the layout algorithm, resulting in a more structure appearance.
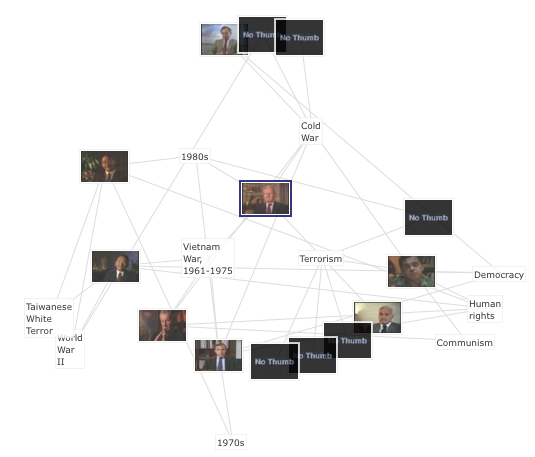 Figure 3: Radial graph
We are using the JavaScript Information Toolkit (JIT) to draw these graphs. Because the development of this graph is less computationally expensive, it is possible to add additional interactive features such as dynamic morphing (see Figure 4), which has been shown to reduce confusion when the graph is re-oriented [6]. While proximity is no longer a dimension, user testing has shown the organizing structure makes visual scanning of the collection easier.
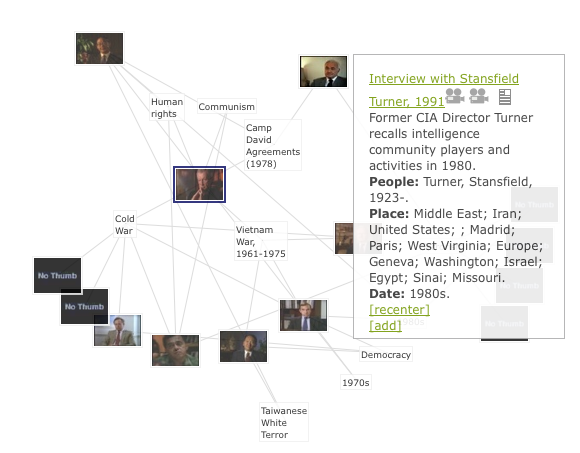 Figure 4: Re-centered Map
Conclusion and continued experimentation
We are continually testing the utility of the relationship map with our users. In general, they are excited by the idea of visually browsing the relationships between items in the collection. Our current instance allows them to browse by topic, people and context or source. We have found that upon first encountering the map, users generally understand the basic idea and purpose but require more information in order to make use of it. They have found an abstract visualization a bit foreign but quickly get acclimated once they start exploring. We have tried to integrate it into the search results function of our site but they are highly resistant to this. So far, they prefer using the map as a tool for browsing and exploration but do not trust or feel comfortable using it as a navigation tool to find specific items within collection.
Segmented Assets
Our original conceptualization of the map included segmentation functionality within each asset. We hope to implement this functionality in the next revision of our site. This segmentation or “pie chart” functionality would indicate to the user the amount of content within a particular asset pertaining to a certain topic, place, etc. This will require the log or transcript of the asset to be segmented into sections and tagged at a higher level.
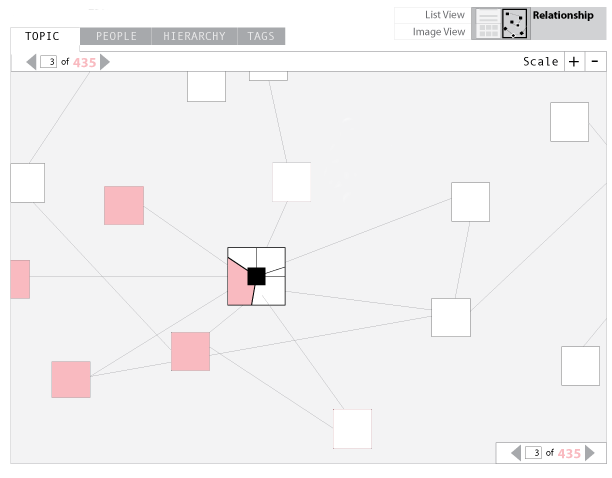 Figure 5: Segmented Assets
Additional cataloging is labor intensive but allows for additional functionality: this is a constant theme for the project. We are keeping our eye on whether the additional functionalities we experiment with are worth the effort in relation to the benefit to our users.
Finally, once we have invested the time to catalog the materials to the standards required for robust digital access, our developer can easily add new features in ways that are useable in other linked data applications.[7] For example, a user could possibly create a tag cloud from their search results in order to see the prominence of certain terms or places:
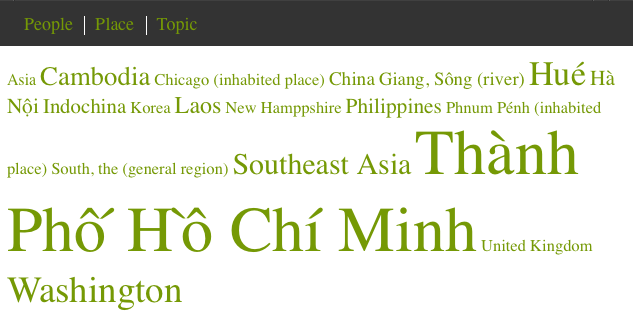 Figure 6: Tag Cloud
Users could also utilize the cataloging data to create a map of their found set and discover the locations where their archival items were created. Cambridge Community Television in Cambridge, Massachusetts has built a similar function illustrating their neighborhood stories:
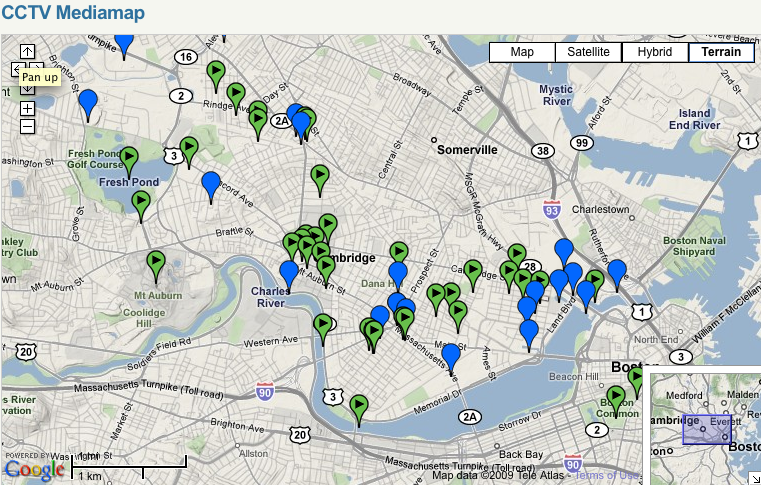 Figure 7: CCTV Media Map[8]
Although we are just at the beginning of our project, we are hopeful that this exploration of visual expressions of media collections will continue to inspire other library and archives content providers to consider the value of their cataloging work beyond traditional search and discovery.
Our work so far has convinced us of the value of in-depth cataloging of media materials as a requirement for flexible user interfaces. As archivists move beyond the library catalog and the finding aid and into the semantic web, we must exploit the information we have already created to allow a rich diversity of access points into our collections.
The code for this project is available under an MIT license. It can be accessed at launchpad.net under the project name bvault on (http://launchpad.net/bvault). Our prototype is currently closed to the public but readers can see and manipulate an example radial graph implementation on the homepage at http://openvaultresearch.wgbh.org.
Notes
[1] We presented this work at the New England Chapter of Code4Lib: “Semi-controlled-folksonomic-tagging-vocabulary: Encouraging Useful Metadata Contributions” on December 9, 2008. See also an example of a controlled vocabulary tagging scheme using Freebase’s API: http://mqlx.com/freebase-suggest/examples/suggest_demo_tagging.html
[2] See “Serendipitous Information Retrieval” by Elaine G. Toms in Proceedings of the First DELOS Network of Excellence Workshop on Information Seeking, Searching and Querying in Digital Libraries, http://www.ercim.org/publication/ws-proceedings/DelNoe01/3_Toms.pdf
[3] For a discussion of the trade-offs between broad vs. item level description of moving image collections, see Andrea Leigh’s “Context! Context! Context! Describing Moving Images at the Collection Level” in The Moving Image, 6.1, Spring 2006.
[4] The PBCore schema is available at http://www.pbcore.org/index.html.
[5] EBUCore is available at http://tech.ebu.ch/lang/en/MetadataEbuCore
[6] Yee, K. P., D. Fisher, R. Dhamija, and M. A. Hearst (2001). Animated exploration of dynamic graphs with radial layout. http://citeseer.lcs.mit.edu/yee01animated.html
[7] Much of this work was inspired by a presentation on data visualization at JCDL 2008: “Shakespeare, god, and lonely hearts: transforming data access with many eyes” available at http://doi.acm.org/10.1145/1378889.1378914. The manyeyes project encourages users to play with, and discover new insights into often familar data. We hope our scholar researchers will be able to discover new paths into our content and gain a better understanding of our collection through interacting with our visualizations.”
[8] Cambridge Community Television, Media Map: http://www.cctvcambridge.org/mediamap
Acknowledgments
This work was funded in part by The Andrew W. Mellon Foundation and the Institute for Museum and Library Services. The authors also wish to thank Karen Cariani and Peter Pinch, co-principle investigators, and our advisors: Drs. John Dower, Peter Winn, James Blight and janet Lang.
About the Authors
Chris Beer is a Developer at WGBH Interactive. He can be reached at chris_beer@wgbh.org.
Courtney Michael is a Project Manager at the WGBH Media Library and Archives. She can be reached at courtney_michael@wgbh.org.
Mayo Todorovic is a Designer at WGBH Interactive. She can be reached at mayo_todorovic@wgbh.org

Subscribe to comments: For this article | For all articles
Leave a Reply