by Hui Zhang and Camden Lopez
Project Motivations
ScholarsArchive@OSU, the institutional repository of Oregon State University (OSU) built using DSpace, is the central space at the university to share and preserve scholarly works including electronic theses and dissertations (ETD), faculty publications, and datasets. Quantitative measures of impact such as number of downloads by article are provided through ScholarsArchive (SA@OSU), and university administrators can request from the library a usage report for items deposited in SA@OSU. However, librarians working with SA@OSU face growing demands to move beyond mere reporting and to showcase research visibility and impact. For instance, authors want to know when and where their articles are being read so they can have a fresh view of their research impact. In addition, university administration would benefit from a visual tool that demonstrates the purpose and impact of the institutional repository (IR) to donors and the general public.
After collecting comments from stakeholders of SA@OSU, we started looking for existing showcasing tools for DSpace and had no luck to find one. One of our colleagues then recommended the Readership Activity Map from BePress Digital Commons because it was a good match for our requirements. However, after reviewing that application, we decided to develop a new readership map for a few reasons:
- The Readership Activity Map by BePress is proprietary software and available only to institutions that are paid subscribers of Digital Commons, an IR platform developed by BePress.
- We wanted to use either publicly accessible or open access software for the development of the new readership map.
- We wanted to decouple the new readership map from the underlying IR platform.
Overall, the development goals were to create a readership map that is feature-rich, open source, and not tied to any specific repository platform. The first step of the map development was to choose the data source and decide how to integrate SA@OSU metadata.
Tracking Repository Traffic with Google Analytics
Elasticsearch vs. Google Analytics
SA@OSU uses Elasticsearch as the engine to provide usage statistics instead of Solr, which is the default engine of DSpace. We chose Elasticsearch because of its capacity to process large amounts of data quickly. SA@OSU is a large IR with traffic of about 7 million legitimate visits (including both views and downloads) to SA@OSU in 2016. Elasticsearch is shipped with DSpace 3.0 as an optional solution for usage statistics. It is turned off by default and available only with an XMLUI interface. However, turning on Elasticsearch statistics involves editing only two configuration files. Once deployed, it can collect information about user requests such as IP address, user agent, and DSpace object IDs.
Using the Elasticsearch index as the data source for the readership map would have violated our goal of decoupling the map from the underlying repository platform. Another problem with the Elasticsearch data is that the usage statistics are subject to contamination with web spider and bot traffic. DSpace provides a tool for filtering out such traffic, but the tool is available only for Solr. SA@OSU administrators must clean the Elasticsearch statistics manually. The readership map needs clean data to be available immediately because it displays readership in near-real-time.
Google Analytics (GA), the free service offered by Google for tracking and reporting web traffic, is an independent platform that is more resistant to spider and bot traffic. Because GA uses JavaScript to collect and transmit tracking data, spiders and bots which do not process JavaScript will not trigger any tracking info to be recorded by GA. Furthermore, GA provides a suite of features for spam and bot filtering at the administrator dashboard. In the end, we chose GA as the data source for the readership map because it can provide consistent and reliable usage statistics. Additionally, modern IR platforms such as DSpace 4.0 and Hydra have adopted GA for recording and reporting usage statistics. Next, we will describe how we track and report IR usage with GA and discuss how we address data privacy concerns.
Tracking article views and downloads
A JavaScript library provided by Google, analytics.js (latest version) or ga.js (legacy version), must be included on each page for which usage statistics are to be collected. For DSpace-based repositories using the XMLUI user interface, the library should be added to page-structure.xsl in dspace-xmlui/src/main/webapp/themes/Mirage/lib/xsl/core, where Mirage is the theme in use by XMLUI, as in the following snippet.
<script type="text/javascript"><xsl:text>
  (function() {
    var ga = document.createElement('script'); ga.type = 'text/javascript'; ga.async = true;
    ga.src = ('https:' == document.location.protocol ? 'https://ssl' : 'http://www') +
      '.google-analytics.com/analytics.js';
    var s = document.getElementsByTagName('script')[0]; s.parentNode.insertBefore(ga, s);
  })();
</xsl:text></script>
To track page views with the included GA library, we also add the following to page-structure.xsl.
var _gaq = _gaq || [];
_gaq.push(['_setAccount', 'UA-xxxxxxxx-x']);
_gaq.push(['_setDomainName', 'ir.library.oregonstate.edu']);
_gaq.push(['_trackPageview']);
The argument following ‘_setAccount’ needs to be a Google Analytics tracking ID, and the argument following ‘_setDomainName’ is the domain of the IR in which tracking will take place.
Tracking file downloads in DSpace with GA is more difficult because we have to record the download activity as an event triggered by a user clicking on View/Open in a repository item page. The following snippet, added to item-view.xsl in dspace-xmlui/src/main/webapp/themes/Mirage/lib/xsl/aspect/artifactbrowser, serves this purpose.
<xsl:template name="view-open">
  <a>
    <xsl:attribute name="onclick">
      trackDownload(this)
    </xsl:attribute>
    <xsl:attribute name="href">
      <xsl:value-of select="mets:FLocat[@LOCTYPE='URL']/@xlink:href"/>
    </xsl:attribute>
    <i18n:text>xmlui.dri2xhtml.METS-1.0.item-files-viewOpen</i18n:text>
  </a>
  <script type="text/javascript">
    <xsl:text>
      function trackDownload(link) {
        _gaq.push(['_trackEvent', 'Bitstream', 'Download', link.href]);
        setTimeout('document.location = "' + link.href + '"', 200);
        return false;
      }
    </xsl:text>
  </script>
</xsl:template>
The first part of the snippet, between <a> and </a>, adds the trackDownload method which is triggered when the file is downloaded by a user. The second part of the snippet specifies that the trackDownload method will report the visit to GA as an event with ‘Bitstream’ as the event category, ‘Download’ as the event action, and the URI for the downloaded file as the event label (see https://developers.google.com/analytics/devguides/collection/analyticsjs/events).
Data privacy
The fact that SA@OSU uses GA for usage tracking raises issues of protecting visitor and data privacy. One way to address the privacy concern is to take advantage of a GA option which partially anonymizes the visitor IP addresses stored and used by Google. However, according to Google, this reduces the accuracy of the geographic data that are calculated from the IP address (“Greater choice and transparency for Google Analytics”, 2010). This is a significant problem for our map because knowing the locations of readers is a major requirement from our repository stakeholders.
We prefer to address data privacy concerns by providing transparency about our data collection practice. OSU Library is drafting a data privacy policy to protect users’ rights of privacy and confidentiality, and part of the policy is telling users what information the library will collect for recording and reporting. For example, the privacy policy will state that the library websites (including SA@OSU and the readership activity map) collect the following information from user requests:
- Domain, country, IP address
- DNS/Hostname
- Date, time
- User Agent
- Resource (title, URI) in SA@OSU that has been used
The collected data are exclusively for evaluation of site design to best serve user needs.
Map Implementation
The implementation of the readership map will be described in detail, but here is a brief overview. The map itself is implemented in JavaScript using the Google Maps JavaScript API. The map gets readership data from a Ruby on Rails (Rails) application we created to serve as an intermediary between the map and Google Analytics. Readership data initially flows from our repository pages to GA when users visit the repository and view or download items. Then, when a user loads the readership map and the map requests data from the Rails application, the data flows from GA to the map through the Rails application.
Google Analytics data
The readership map uses the following data collected by GA for each page view or download on an SA@OSU page:
- Page URI and title,
- Hour and minute when the page was visited or a download occurred, and
- Location (city, region if applicable, and country) of the user.
The page URI allows us to provide a hyperlink to the repository item page within the map. The page title (specified by the “title” element in the page’s HTML) happens to be the item title for SA@OSU repository items. That is, an item in the SA@OSU repository titled “ABC” will have a page within the SA@OSU web interface with HTML title “ABC”, and that title gets recorded by Google Analytics as part of the data collected for a page view or download event. So the GA page title data provide us with a convenient way to display a hyperlinked item title in the map.
We use the hour and minute to simulate real-time display of the readership data. We found that the most recent GA data became available in batches, approximately every 5 to 10 minutes. Repeated queries for the most recent data would yield the same data set for 5 to 10 minutes until a query returned an updated set which had new data for the past few minutes. Subsequent queries would return those same data for 5 to 10 minutes until the next update, and so on. If we displayed data as it became available, the resulting display would be uneven over time. As described in the Google Map section, our solution was to use the hour and minute associated with each view or download to simulate real-time display.
The location of a user is determined by GA from the user’s IP address and is only an approximation. We filter out any data for which there isn’t a valid location, indicated by a value of “(not set)” for the city. GA provides latitude and longitude coordinates for the center of the user’s city, and we use those to place city markers on the map. For users inside the United States, the region given by GA is the unabbreviated state name. For readership associated with those users, we use the city and state to label the location on the map. Otherwise, we use the city and country.
Rails application
The Rails application for the readership map is open source and made available through GitHub. This intermediary application between Google Analytics and the map was necessary for the GA authentication and authorization process. To access GA data, it is necessary to authenticate one’s identity as a user with authorization to access the requested data. A person can provide authentication when accessing data through a web browser by signing into a Google account. Software applications must provide authentication through a Google service account. A secret key stored in a file provides the essential authentication information. We could not put such a secret key in the readership map code because it could be downloaded and read by anyone who loaded the map. Instead, we created a Rails application running on an OSU server to access the GA account on behalf of the readership map.
Another reason for using an intermediary application between GA and the readership map is to improve efficiency. Since the GA data get updated every 5 to 10 minutes, it would be wasteful to have every instance of the readership map generating its own queries to GA, most of which would be redundant. With the intermediary application, we can limit the number of GA queries to at most one every 5 to 10 minutes, store the data temporarily on the server, and serve the data quickly in pre-processed form to readership map instances.
We chose to implement the server application in Ruby on Rails, a web development framework built on the Ruby programming language. Rails was ideal for our purpose because it is designed for creating web applications with minimal configuration. Additionally, because we are going to renovate SA@OSU using a Rails-based framework called Hyrax, there was already knowledge and resources available at OSU Library for using Rails.
The Rails application temporarily stores readership and supplemental data in a MySQL database. The main table in the database, containing all of the readership data used by the map, is readers. We use another table, locations, for storing location information (city name, region, etc.). The location information has to be downloaded separately from the readership data because GA limits the number of fields (dimensions) one can request in a query to 7, which is not enough to get all readership and location data in one query. The locations table helps match the results of the separate readership and location queries to form complete records of readership.
The Rails application is fairly simple, with most of the functionality defined in app/controllers/data_controller.rb. When the readership map requests data, if the Rails application has retrieved GA data less than 10 minutes ago, then the saved data are simply sent to the map in JSON format. Otherwise, the Rails app queries GA for all of the current day’s data (with separate queries for page views, downloads, and location information), does some minor processing of the results, updates the database, and sends data to the map.
The following snippet shows how we construct the GA query for readership data. The terms “metrics” and “dimensions” (“dims”) are the Google Analytics terms for quantitative measurements and non-quantitative attributes, respectively. When we request, for example, the metric “ga:pageviews” and the dimensions “ga:hour”, “ga:minute”, etc., GA finds all unique combinations of the dimensions we requested, and for each combination calculates the total number of pageviews. The results returned by GA have one row per unique combination of the dimensions. The results are calculated for a specified date range, which in the code snippet is given as the first arguments of query (from “today” to “today”).
if activity == 'download'
  metrics = 'ga:totalEvents'
else
  metrics = 'ga:pageviews'
end
dims = 'ga:hour,ga:minute,ga:cityId,ga:pageTitle,ga:hostName,ga:pagePath'
...
rows = query('today', 'today', metrics, dims, filters, sort, max)
Although hour and minute data are available for pageviews and events in GA, it isn’t possible (or at least isn’t easy) to query for a range of times. One can query only for a range of dates. So with each query, we get the whole current day’s data, most of which will have been already downloaded in the last query. This inefficiency is not much of a concern because we query once every 10 minutes at most, but there may be a way to avoid the redundant downloads. When we send data from the Rails application to the readership map, on the other hand, we send only the most recent data. Selecting for a range of times is straight-forward once the data have been stored in a MySQL database with a timestamp as one field. Having such convenient database functionality is another advantage of using a server application to go between GA and the map.
Authentication and authorization for querying Google Analytics
Our Rails application queries Google Analytics for SA@OSU usage data using the Core Reporting API. Each query requires authentication and authorization via OAuth. Setting up authentication and authorization takes several steps.
- In the Google Developers Console, enable the Analytics API, create a service account, and obtain a credentials file within the relevant project (Readership-Map in our case). More detailed instructions are at https://developers.google.com/api-client-library/ruby/auth/service-accounts.
- Note the service account ID (an email address ending in “gserviceaccount.com”). In the Admin section of the Google Analytics UI, for the Google Analytics view containing the data that the readership map will use, add the service account ID to the list of users in User Management. Grant the service account ID “Read & Analyze” permission (see Figure 1).
- Put the credentials file for the service account in a secure place where the Rails application can access it (on an OSU server, in our case).
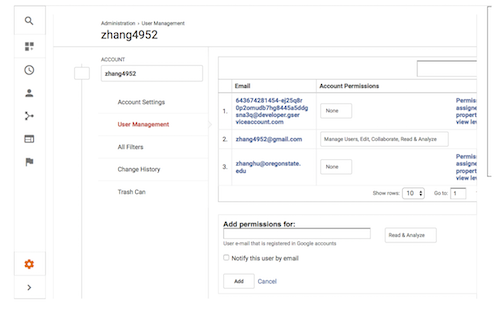
Figure 1. Granting the Readership-Map service account access to Google Analytics data.
The googleauth Ruby gem provides a convenient method, get_application_default, for loading an OAuth credentials file into a Rails application. We currently load the credentials a slightly different way using environment variables, but in the following snippet we show the get_application_default method. The google-api-client gem provides a Ruby interface with the Analytics Core Reporting API. Putting these together, the query function used at the end of the last code snippet acquires authorization and queries GA as follows.
require 'googleauth'
require 'google/apis/analytics_v3'

def query(start_date, end_date, metrics, dimensions, filters, sort, max)
  service = Google::Apis::AnalyticsV3::AnalyticsService.new
  scopes = ['https://www.googleapis.com/auth/analytics.readonly']
  service.authorization = Google::Auth.get_application_default(scopes)
  service.authorization.fetch_access_token!
  service.get_ga_data(ENV['GA_PROFILE_ID'], start_date, end_date, metrics,
                      dimensions: dimensions, filters: filters, sort: sort,
                      max_results: max) do |result, err|
    ...
    return result.rows
end
Google map
The map’s JavaScript implementation is hosted by the Rails app in app/assets/javascripts/rm.js.erb. We instantiate and initialize a Google Map using the google.maps.Map function from the Google Maps JavaScript API. Then the script retrieves recent readership data in batches from the Rails application every 10 minutes, using the jQuery.get() function to asynchronously send requests. The data consist of the times, locations, page titles, and URIs associated with the batch of page views and downloads, and are transferred in JSON format.
We simulate real-time display of the data by thinking of a virtual clock running 30 minutes behind the actual time (the delay and other timing parameters are configurable). Each minute, we update the virtual clock and display pageviews and downloads whose timestamps have been reached or passed by the virtual clock. The 30 minute delay is intended to prevent the virtual clock from skipping over data which GA has taken an unusually long time to process.
var currentTime = new Date();
virtualTime.setMilliseconds(virtualTime.getMilliseconds() +
                            Math.round(currentTime - lastDisplayTime));
...
while (dataStack.length > 0 &&
       dataStack[dataStack.length - 1].time <= virtualTime) {
  toDisplay.push(dataStack.pop());
}
When there is more than one page view or download to add to the map in a single display interval, we try to even out the display of the data by dividing the interval into equal parts and adding one page view or download at-a-time.
if (displayStack.length > 1) {
  displayOneTimer = setInterval(displayOne,
    minToMs(displayInterval()) / displayStack.length);
}
Displaying a page view or download means creating a marker (using google.maps.Marker) on the reader’s city if one doesn’t already exist, then animating the marker for a few seconds and updating the count of page views or downloads associated with the city. The map keeps track of page titles and URIs for the most recently viewed and downloaded items for each city, and we use those to fill an info box which opens when a user selects a city marker. Users can click on a link to the most recently viewed/downloaded item, opening a new browser tab with that item’s page in SA@OSU.
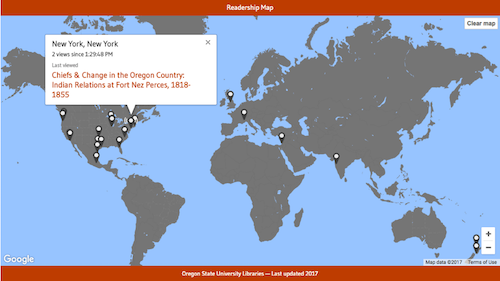
Figure 2. Readership map with the info box for a city opened.
Next Steps
We deployed the readership map in early 2017 and embedded the map on the homepage of SA@OSU.
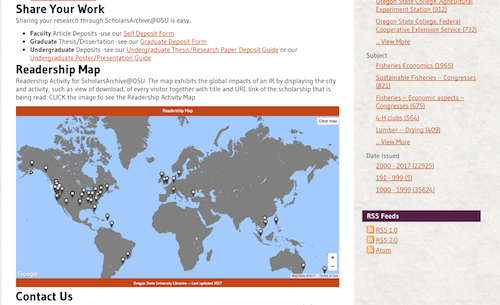
Figure 3. Deployment of readership map on SA@OSU homepage.
We added a section called Readership Map to the home page with a brief introduction to the application and a clickable screenshot of the map. Interested users can click the image and will be redirected to the readership map application. This is accomplished by editing news-xmlui.xml in dspace/config with a new “div” section.
<div>
  <head>Readership Map</head>
  <p>The map of Readership Activity for ScholarsArchive@OSU exhibits the global impacts of an IR by displaying the city and activity, such as view of download, of every visitor together with title and URL link of the scholarship that is being read.</p>
  <figure source="themes/Mirage/images/slides/readershipmap.png" target="http://readershipmap-dev.library.oregonstate.edu/"></figure>
</div>
As OSU Libraries are planning to migrate SA@OSU from DSpace to the Hydra framework with a Rails-based front-end, the immediate next step is to investigate how to embed the readership map into a Rails view so that the live map can be viewed within SA@OSU rather than on a separate webpage. Because we draw our readership data from GA without interacting directly with the repository, the readership map will require few or no modifications as the repository moves from DSpace to Hydra.
Future plans also include a usability study to explore whether and how an interactive visualization like the readership map improves user satisfaction with an institutional repository.
References
Greater choice and transparency for Google Analytics [Internet]. [Updated 2010 May 25]. [Cited 14 March 2017]. Available from: https://analytics.googleblog.com/2010/05/greater-choice-and-transparency-for.html
Author Biographies
Hui Zhang (hui.zhang@oregonstate.edu) is the Digital Application Librarian for Oregon State University Libraries and Press. He works with a team of developers to keep the digital repositories with the latest technologies and create software tools and solutions for the library and its patrons.
Camden Lopez (camden.lopez@oregonstate.edu) is a graduate student in the Department of Statistics at Oregon State University. He worked on the ScholarsArchive@OSU readership map as a part-time programmer in OSU Libraries.

Subscribe to comments: For this article | For all articles
Leave a Reply