by Mara Blake, Karen Majewicz, Amanda Tickner, Jason Lam
Introduction and Overview of Group Activities
The Big Ten Academic Alliance (BTAA) Geospatial Data Project is a collaboration between twelve member institutions of the consortium and works towards providing discoverability and access to geospatial data, scanned maps, and web mapping services. (See Appendix I for a full list of participating institutions.) The project officially began in June 2015 with the goal of creating a centralized geoportal populated by a collection of harmonized geospatial metadata records. The participating institutions divided work up geographically, with each institution collecting and editing metadata for openly available collections of geospatial data in their region. Working with the Project’s Metadata Coordinator, the institutions created ISO 19139 records for geospatial data and Dublin Core records for scanned maps. In the summer of 2016, the project launched the BTAA Geoportal, built with GeoBlacklight, an open source geospatial discovery application.
An Interface Steering Group convened in Fall 2016 with the charge to assess the interface and usability of the BTAA Geoportal. The team included six members from five institutions of the Task Force and a usability student assistant. They focused on determining perceived usefulness and perceived ease of use, which are important factors in determining acceptance of new technologies (Saade and Bahl 2005; Adams, Nelson and Todd 1992; Baroudi, Olson and Ives 1992). Usability tests and heuristic evaluations were chosen as methods of evaluation, as they have had a long standing in measuring and managing website engagement and are essential in the process of iterative design (Letnikova 2003; Campbell 2001).
Giving back to the GeoBlacklight community provided another motivation behind conducting the usability study of the BTAA Geoportal. As open source software, GeoBlacklight relies on a robust community of developers to contribute to the code base. Because the BTAA Geospatial Data Project does not include a full-time developer, our project has not been able to contribute very much technical development to the software. Our project hopes to give back to the community by publishing the results of our usability findings with the hope that it will benefit other portals built with GeoBlacklight.
The group began with an important question: Who is/are the target audience(s) of the geoportal? Addressing the needs of diverse users, in part, motivated the Task Force to select GeoBlacklight in the first place. This is because GeoBlacklight distinguished itself among geoportal technology as being designed for an audience beyond advanced GIS users (Hardy and Durante 2014; Stanford 2014). The project’s decision to include records for scanned historical maps meant that we anticipated serving users who may not be familiar with GIS conventions and terminology. The group discussed this issue at length and decided to see if usability evaluation of the site identified differences in the experience of users with dissimilar backgrounds.
Usability Studies of Geoportals
The literature on geoportal usability includes articles that lay out the criteria that defines what a geoportal is and how it should function (Aditya and Kraak 2005; Wyttenbach et al. 2008; Henzen and Bernard 2014). These articles are mainly from Europe, which may be a reflection of the INSPIRE Directive that requires all states in the European Union to harmonize and share specified spatial datasets (I.N.S.P.I.R.E. 2007). This directive resulted in different countries looking to create geospatial discovery applications, and a need arose to document and standardize geoportal functionality.
The literature also suggests that there has been limited formal user testing on geoportals. Most available studies have been confined to large scale national spatial data infrastructures, including Sweden (He et al. 2012), Australia (Barton et al. 2015), Switzerland (Kellenberger et al. 2016), and Brazil (De Araujo et al. n.d.). Resch and Zimmer (2013) employed a survey method to interview users of multiple geoportals across the European Union. An exception to this pattern was a test performed at the University of New Hampshire Library on the open source application, OpenGeoportal, instead of an established geoportal (Wolff and Parker 2014). In each of these studies, GIS professionals were the test subjects. Many were even already familiar with the specific geoportal applications being tested (Resch and Zimmer 2013; He et al. 2012). Although these studies fully documented their testing methodology, the problems they uncovered were mainly confined to minor interface design issues and did not affect the primary features of a geoportal, namely the combination of graphical spatial, categorical, and text searches.
Heuristic Evaluation
Heuristic evaluation provides a way to assess a user interface against established principles of usability. The members of the Interface Steering Group completed a form designed to guide us through some of these standard usability issues and evaluate our interface. The group produced an overall score of 82/100. Despite a relatively high score, the heuristic evaluation identified some usability issues. The keyword search proved the most problematic in the heuristic evaluation as searches often did not return expected results. Conducting the heuristic evaluation also sensitized the members of the group to the user experience with the geoportal and helped us prepare for user testing. (See Appendix II for the full heuristic analysis.)
Developing and Administering the User Tests
The Interface Steering Group completed a total of 16 user tests, including users with and without GIS experience, and representing the span from undergraduate student to advanced researcher. Three institutions completed the user testing on site: University of Michigan, University of Minnesota, and Michigan State University.
Task development for the tests proved challenging. We wanted to assess various features of the geoportal, but were aware of the likely knowledge gap between different users. We found writing tasks that provided generous background information without making assumptions about someone’s experience with GIS impossible, because suitable user tasks should provide all of the context that the user might need to complete it without giving unnecessary hints. Therefore, users were split into two groups: those without GIS experience and those with GIS experience. Levels of expertise with GIS varied. We developed two very similar, but not identical, sets of tasks for each group with the intention of enabling a high probability of task completion while still identifying potential differences between them. (See Appendix III and IV for the user testing tasks.)
Users’ tests took approximately one hour to complete. Most tests were conducted by two people: one serving as moderator and the other as note taker. In some cases, only one person was available to administer the test and served both functions. The moderator asked a few introductory questions to determine the correct set of tasks. The user then completed the tasks without intervention from the moderator or notetaker. If users got stuck, the moderator prompted them to do what they would do at home or in their office. Users were asked to indicate when they had completed a task; the moderator often asked the user to rank their confidence that they completed the task correctly on a scale of 1 to 5. After completing the tasks, the moderator debriefed the user, followed up on issues related to tasks, and asked the user to provide feedback on each of the three main sections of the Geoportal: home page, results page, and item page. During this debrief period, the moderator and/or note taker answered any questions from the user about the interface or the larger project.
User Test Results and Observations
We collaboratively analyzed our results, first at our local institutions and then collectively. An exercise using Post-It style notes to organize findings provides a common way to identify trends in results of user testing and serves as a debriefing mechanism for the researchers. Because other members of the group performing the tests work in distributed geographical locations, a physical session would not work. We instead held a virtual meeting and used Trello, an online project management tool, to analyze and combine findings for user tests. We created entries in four categories: observations, insights, questions, and recommendations. Trello offered helpful features for organizing and prioritizing the findings of the user tests.
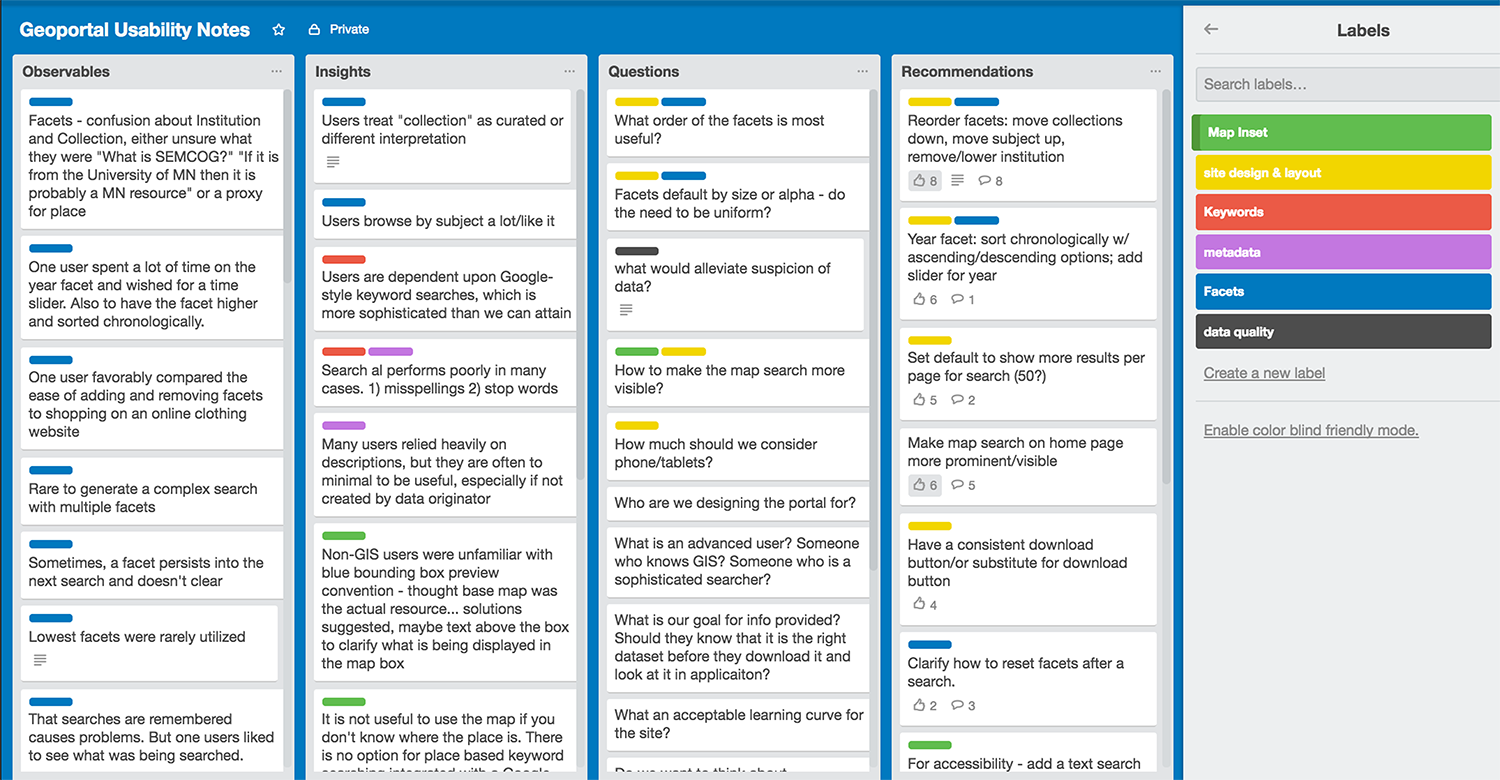
Figure 1: Screenshot of Trello project board
Site Structure
Users expressed unanimous praise for the visual design, color, and aesthetics of the site. Several individuals commented that the site was straightforward to use and that the simplicity of options made it easy to learn. An ignored design feature was the use of icons for institution, access, and data type. Users did not know what these icons are supposed to represent, and none of the users discovered their explanatory hover labels. Users navigated the site by performing searches and occasionally clicking the site logo to return to the homepage. No one clicked on the main toolbar to view the About, Help, or History pages. Many users also did not notice the navigation options for “Back to search” and “Start over.”
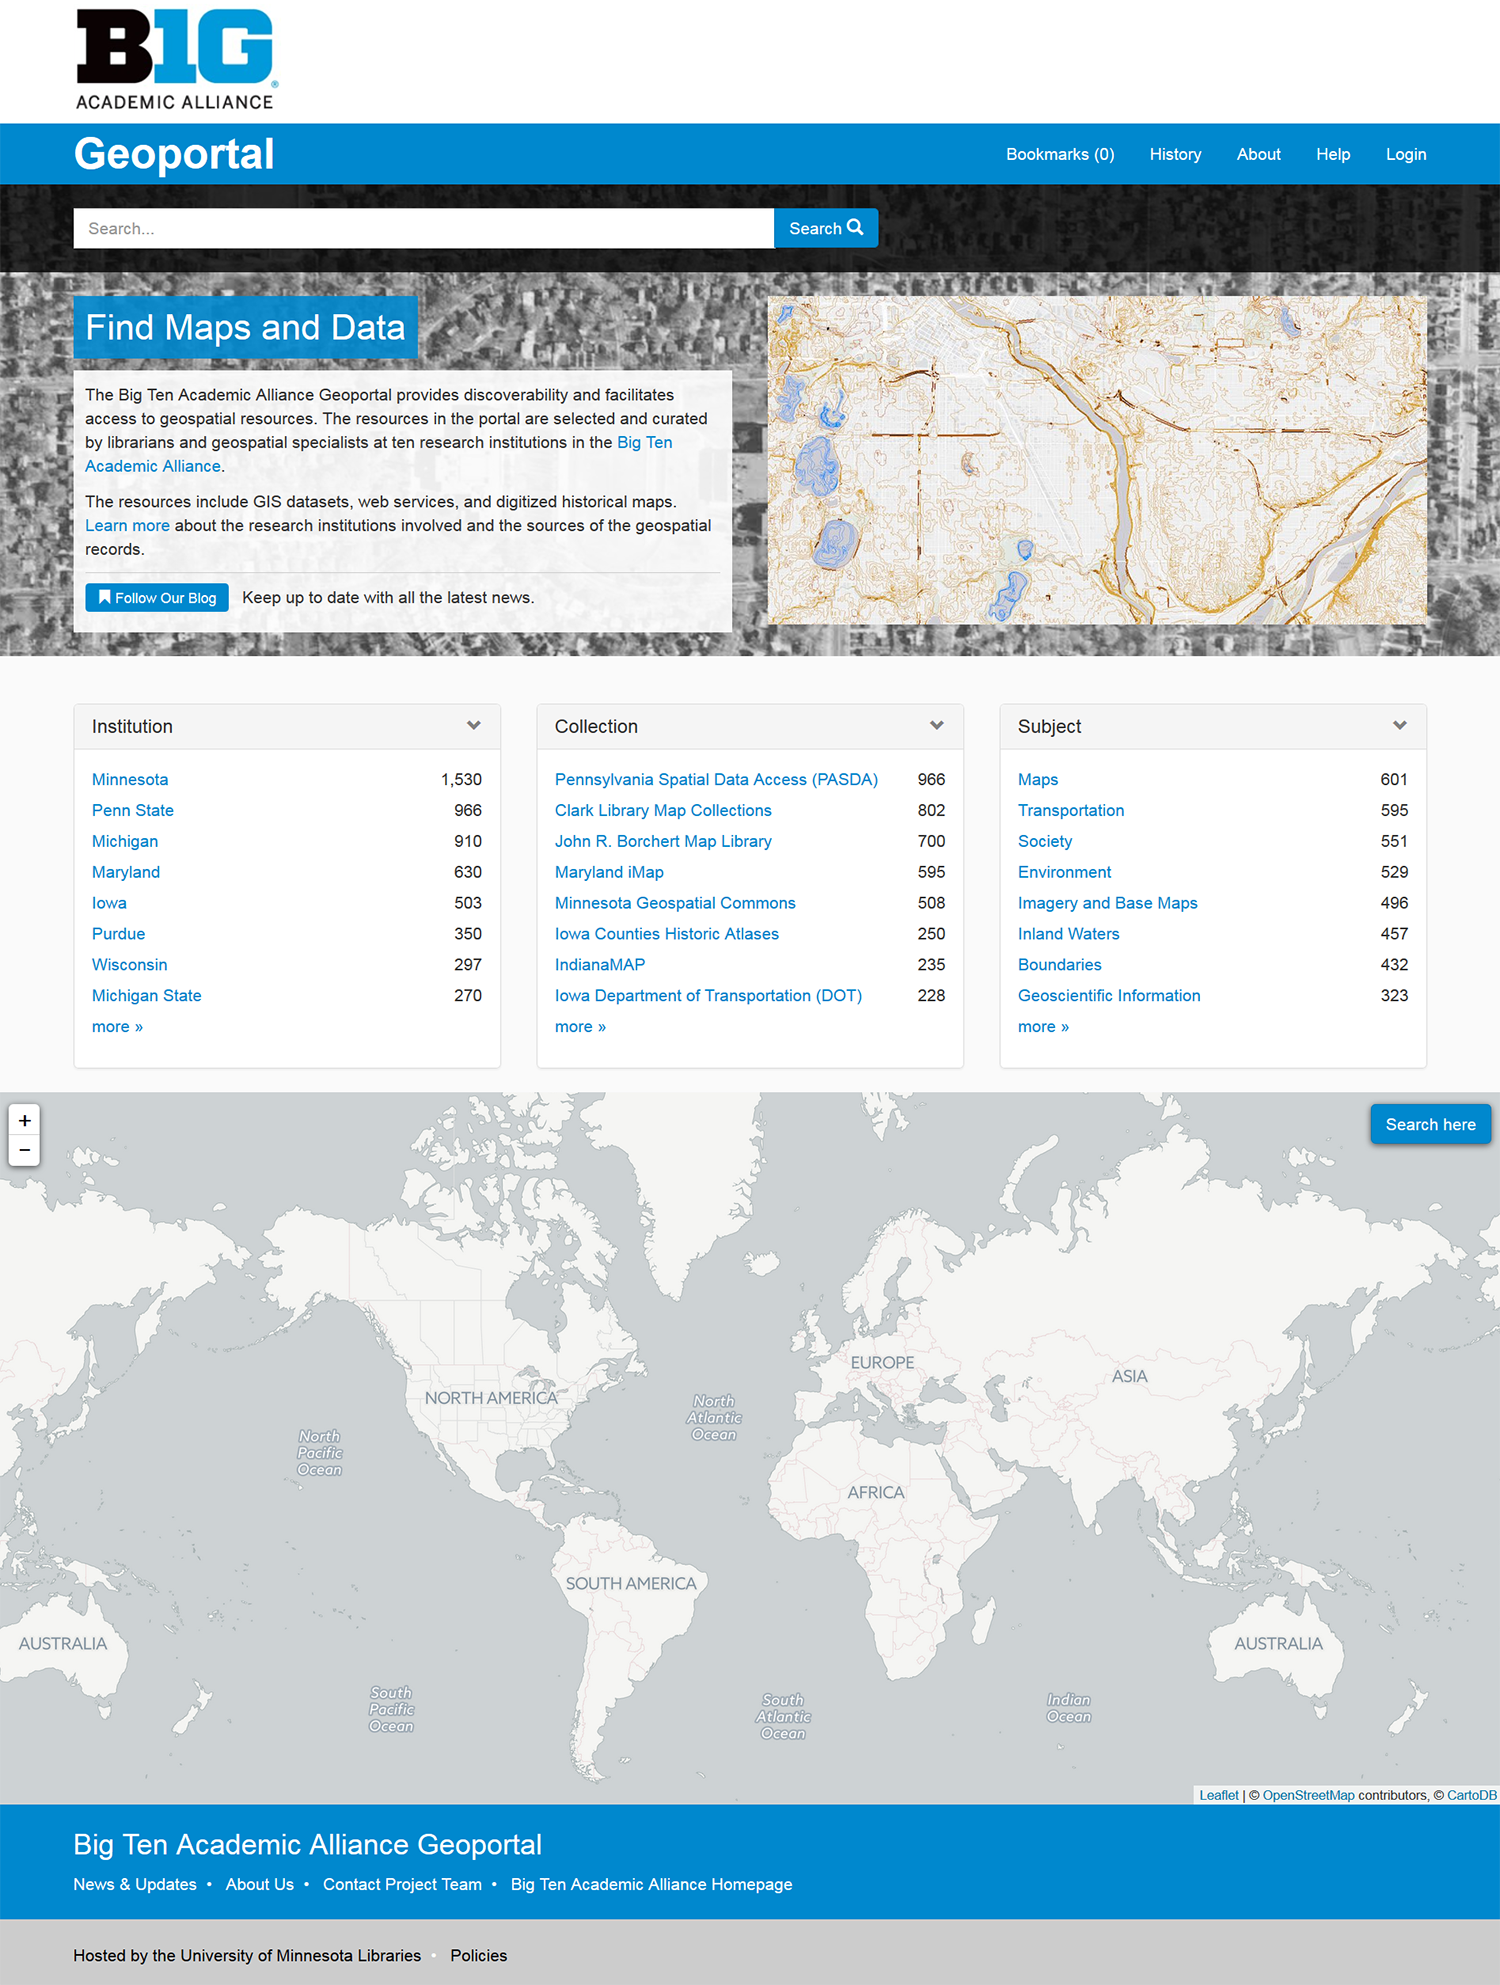 Figure 2: Screenshot of the homepage during testing
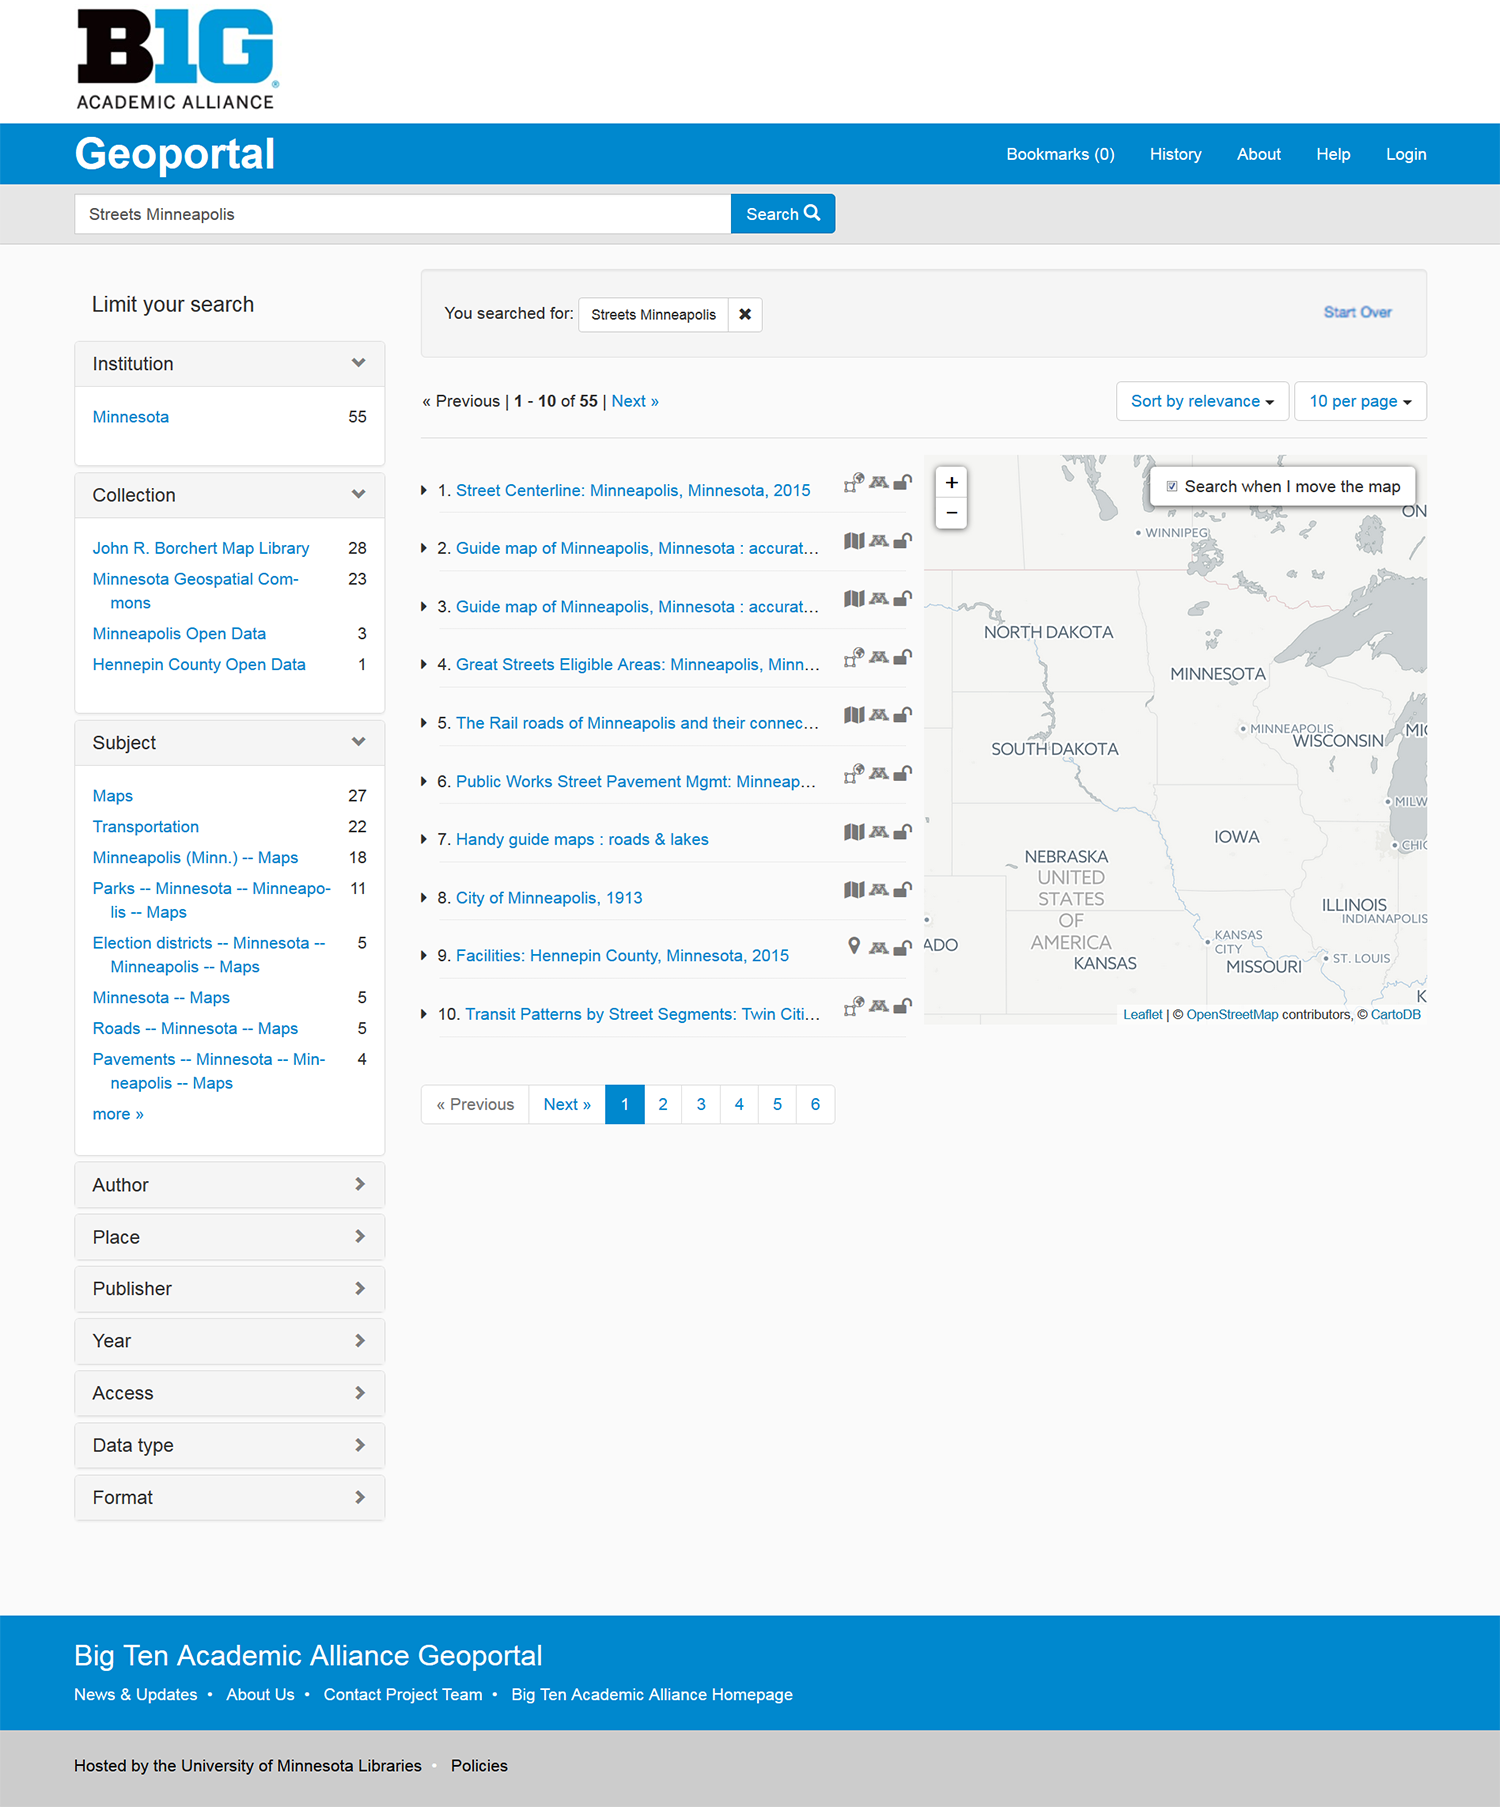 Figure 3: Screenshot of search results page during testing
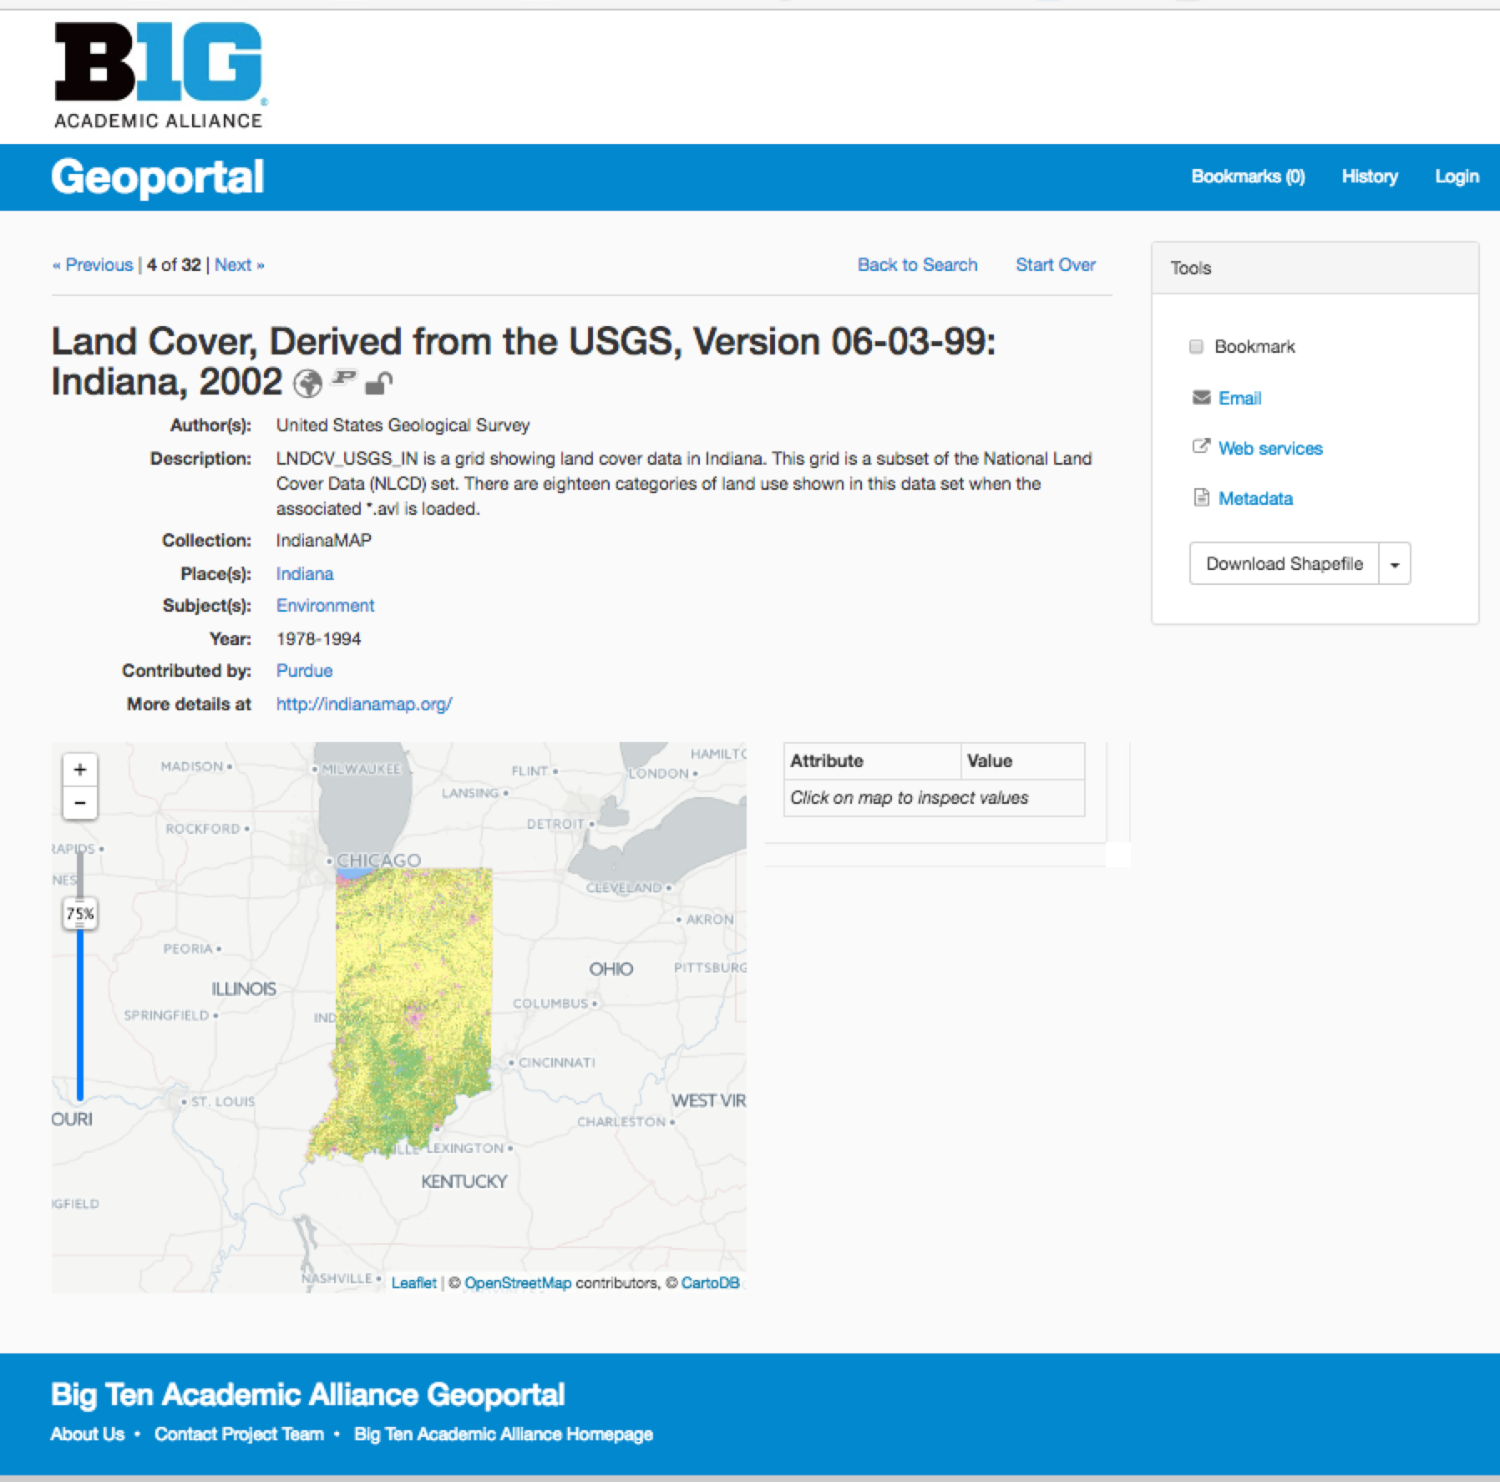 Figure 4: Screenshot of item page during testing
Search Strategies
The geoportal offers three main search functions: a text box, a map inset, and categorized facets. Although all three options are available from the homepage, every participant chose the text box as their first and primary search strategy. In many instances, this strategy returned limited results. The most common cause of a failed text search was after typing in a place name or phrase that did not exist in any of the metadata records. When this occurred, users were often stymied and did not know how to proceed. For example, one user searched for “Ann Arbor, MI.” The state abbreviation “MI” did not appear in any metadata records, causing surprise on the user’s part that the Geoportal did not seem to include items for the city of Ann Arbor.
On their own, users did not initially identify the map inset as a search tool. After the map was pointed out and its functionality explained, users did take advantage of it to browse for items. Only one user independently identified that the map inset offered another way to search on the results page, although they initially did not see it on the homepage. The user said that the text “Search When I Move the Map” next to a checkbox that appears on the results page looked “just like Yelp.” This text allowed that particular user to learn that the map search on the homepage provided the same search functionality.
At the time of testing, the geoportal listed ten facets stacked upon each other on the results page in this order: Institution, Collection, Subject, Author, Place, Publisher, Year, Access, Data type, and Format. The first three facets were expanded by default, and users rarely clicked on any others. Some of the labels on the facets were not intuitive to users, particularly in the cases of “Institution” and “Collection.” Users often selected values from these facets anticipating that they would filter the results to a location, but these values represent administrative metadata that did not provide meaningful information to the users. One user even said, “The institution and collection part were not helpful.” Users found the third facet, Subject, helpful for exploring the overall available content. However, these keywords had not been standardized for capitalization, which negatively affected scrolling through the full Subject list, since the same or similar keywords appeared multiple times. Although the Year facet appeared farther down the list, several users did access it. They struggled with its default sort, which lists the most commonly occurring dates on top. Users expected the sort to appear in chronological order, and felt frustrated by its lack of range setting. Lastly, many users did not notice that they can combine facets to narrow down the items returned. As a result, they also did not realize that as they clicked on facets, the system “remembered” selections, and this behavior could cause subsequent searches to fail.
Item Page Evaluation
When a user selects a record, the item page view appears with three sections: a list of metadata elements and values, a tool box with links for external metadata files, web services, and/or direct dataset downloads, and a map preview that shows bounding boxes, web service previews, or a scanned map image. Some users encountered challenges understanding these options, especially when any of the tools or map previews were missing. Users were especially confused by records that did not provide a direct download link and expressed annoyance when they realized that they needed to visit an external site to obtain the data.
The BTAA Geoportal combines both GIS datasets and scanned maps in the same application, bringing up another point of confusion for users. Several users misinterpreted the map preview feature and incorrectly concluded that it was the actual resource, instead of a basemap layer. As a result, some users could not discern if they had found a shapefile or a scanned map, nor did they realize that there is a distinction.
Metadata View
Users generally found the available metadata to be inadequate. They wanted to see more robust descriptions, as well as a feature catalog listing the attributes. Without this information readily available, several users expressed suspicion of the quality and provenance of the data. None of the users found the “metadata” link useful, because it displays a preview of the metadata in XML format. One user, upon seeing the metadata as XML, said “I know this is important, but I can’t make sense of it. I wish that there was something else here.”
Usage Analytics
The Interface Steering Group also examined Google Analytics reports to check for conflicts with their observations of the user tests. Although the site is still fairly new, many trends shown by usage statistics complement and reinforce what we learned from observing users. For example, Google Analytics shows that the vast majority of text searches are place name keywords. We can also see that users most frequently select only the top three facets on the results page and ignore the lower facets. Lastly, an analysis of the visited page URLs indicates that users are not taking advantage of the map to filter their results, a behavior we also observed during testing.
Recommendations for Site Improvements
User testing generated specific recommendations on the three main areas of the Geoportal: Homepage, Search Results Page, and Item Page; as well as changes to metadata. Each recommendation includes how much effort would be entailed in implementation (easy, medium, difficult); the priority of implementation (high, medium, low); and the group responsible for the task (the BTAA group or GeoBlacklight developers).
Metadata
1) Normalize element values for keywords, place names, and authors/publishers.
While GeoBlacklight is our geoportal interface, the actual metadata records are stored in an index built with Solr, a standalone enterprise search server. With our initial Solr configuration, “Inland Waters” and “inland waters” would not be grouped together, nor would “Philadelphia, PA” and “Philadelphia, Pennsylvania.” Rather than adding numerous “rules” to Solr, we determined that the best practice would be to normalize spellings and punctuation before ingest. This practice also improves interoperability with other catalogs that might not have configured Solr to group these terms.
Effort: Medium
Priority: High
Task owner: BTAA
2) Add synonym files to Solr to facilitate discovery.
Solr offers the option to incorporate a defined synonym file. This would expand the search results to include similar or equivalent terms. For example, a user search for “bike” would also return results with the word “bicycle.”
Effort: Medium
Priority: Medium
Task owner: BTAA
3) Encourage contributors to submit robust entries into the description field.
Many users prefer to glean additional information from a condensed description field written in a narrative format, rather than sorting through elements.
Effort: Medium
Priority: Low
Task owner: BTAA
Homepage
1) Remove problematic facets and replace them with Place, Data Type, and Subject on the homepage
Users struggled to understand the categories Institution and Collection. We recommended replacing them with Place and Data type, because they were of the highest interest to users and were also the facets targeted for metadata standardization.
Effort: Easy
Priority: High
Task owner: BTAA
2) Put more suggestions on a failed search page
When a user typed a term into the search box that yielded no results, they did not know what to try next and might have given up. A message giving suggestions for alternate spellings or to browse certain facets could keep a user engaged to continue searching.
Effort: Medium
Priority: Low
Task owner: BTAA
3) Make the map search more prominent and more intuitive.
The tests made it clear that the map search was not useful, but we were challenged to determine the best solution to this problem. The full page width map was located under the fold during the tests, so it made sense that users did not notice it. However, moving it higher up on the page would require it to share real estate with the text search and facets, potentially rendering it too small for a positive user experience. We also wanted to address the challenge of navigating the map with just pan and zoom controls. Using these features only works if you already know how to navigate to the place you are searching for, but test users weren’t necessarily familiar with the location of a small city like Ypsilanti, MI. We considered adding a text box within the map that would just zoom to locations, but multiple search boxes have tested poorly in other usability studies, as users have difficulty differentiating between them (Nivala et al. 2008; Wolff and Parker 2014). Finally, we realized that because the map does not provide a visualization of the search results, it does not convey much meaningful information, especially for users without strong prior knowledge of a particular geographical region. We decided to refer this problem to the GeoBlacklight developer community to glean more insight with further research and experimentation.
Effort: High
Priority: High
Task owner: GeoBlacklight Developers
Search Results Page
1) Improve the temporal faceting options.
Users found the Year facet difficult, because it displayed by numeric count instead of chronological order. However, we were challenged by Solr to display this facet chronologically without affecting the other facets. We investigated inserting a time slider widget, but did not find one that was suitably intuitive. We settled on recommending a Time period facet that groups items into selectable centuries, decades, or other predefined eras.
Effort: Medium
Priority: High
Task owner: BTAA
2) Reorder and expand the facets on the left sidebar menu, making the first four: Place; Data Type; Subject; Time Period.
Users only clicked on the the expanded facets listed first and ignored the folded ones lower down. Similar to observations from the homepage, users found Institution and Collection confusing. We selected the top four most useful facets, Place, Data type, Subject, and Time period, and set them to display as expanded by default.
Effort: Easy
Priority: High
Task owner: BTAA
3) Make search options clearer on the top of the page and buttonize the text “Start Over.”
Sites built with Solr can offer powerful search filtering options by allowing the user to combine multiple facets. However, the selected facets values need to be prominently displayed for this functionality to be recognizable. In our tests, many users did not notice that their previously selected facet values were being “remembered” in the interface. More emphasis on the “Start Over” button and the facet values list should make the search function clearer.
Effort: Easy
Priority: Medium
Task owner: BTAA
4) Increase set results page default from ten to twenty.
Many users expressed a desire for more results per page in order to minimize having to load another set. Twenty offers more results without distorting the map inset on the search results page.
Effort: Easy
Priority: Medium
Task owner: BTAA
Item Page
1) Display human readable metadata.
Many users asked for metadata that was more easily understood than an XML format. More understandable metadata would assist the user’s selection of appropriate data, as well as alleviate some suspicion of geospatial data.
Effort: Medium
Priority: High
Task owner: GeoBlacklight Developers
2) Have a consistent download button/or substitute for download button.
Once users learned where to find the download button on the right side of the item page, the records missing a direct download button confused them. We should strive to have a download option whenever possible. When providing this is not possible, a substitute in the same place in the interface would help users.
Effort: Hard
Priority: Low
Task owner: GeoBlacklight Developers
3) Add text that indicates what is being shown in the preview box.
Many users did not understand what the map preview with a blue bounding box indicated, particularly those less experienced with GIS.
Effort: Hard
Priority: Low
Task owner: GeoBlacklight Developers
4) Include thumbnail for scanned map if International Image Interoperability Framework (IIIF) is not available.
Many institutions do not have IIIF, and their map records have only a bounding box in the preview window. Given the confusion about the bounding box previews, adding support to use a thumbnail preview for scanned maps could help distinguish them from geospatial data.
Effort: Medium
Priority: High
Task owner: GeoBlacklight Developers
5) Add functionality for supporting documentation, including attribute table information, a codebook, data dictionary, or other supporting files.
Many users wanted to find this information directly in the geoportal. While the primary purpose of the BTAA Geoportal is discovery and access, we also want to facilitate data use whenever possible. Users expressed the desire to see this information and indicated that it would help them identify that a resource contained the data that they need. This is another step that may help alleviate suspicion of geospatial data.
Effort: Medium
Priority: Low
Task owner: GeoBlacklight Developers
Reporting and Implementing Recommendations
Taking the next steps of reporting and implementing our recommendations required an assessment of the extent of each of the changes and who will make them. Some changes would be implemented only to the BTAA Geoportal, while some would require development on the GeoBlacklight codebase.
Local Changes
Local changes were those that fell under the category of customizations, and included adjusting the facet order on the homepage and search results page, normalizing the metadata for place and subject keywords, adding a Solr synonym file for place names, highlighting search options, increasing the default number of search results per page, and inserting a new Time period facet. These changes made searching by place and time easier and more prominent in the interface. These issues were tracked within our own project’s public GitHub repository, where they can optionally be adopted by other GeoBlacklight users.
Homepage facets during testing and new options after metadata cleanup
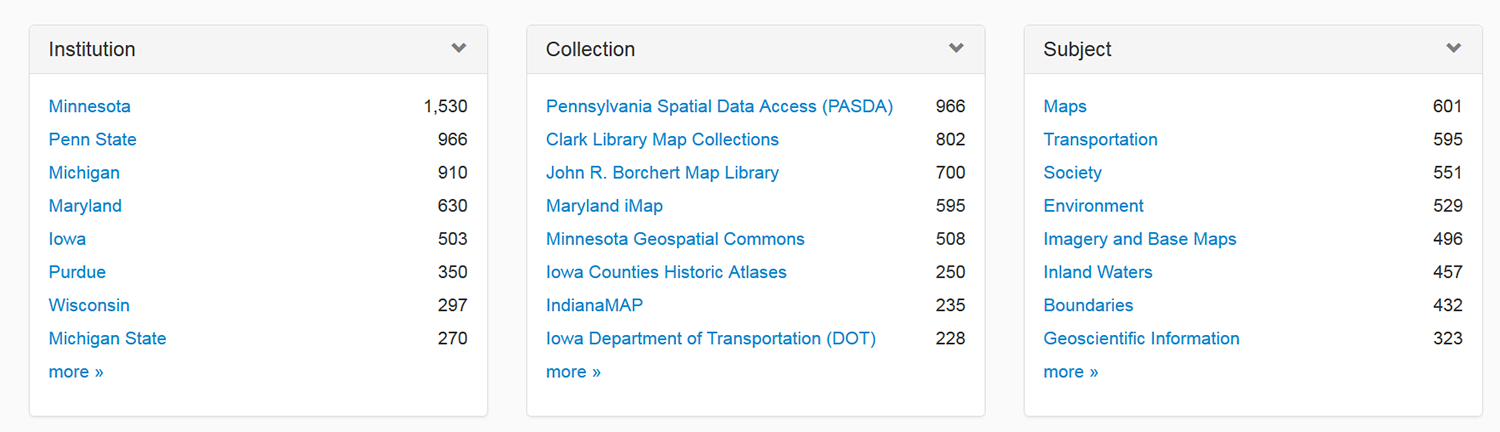 Figure 5: Before
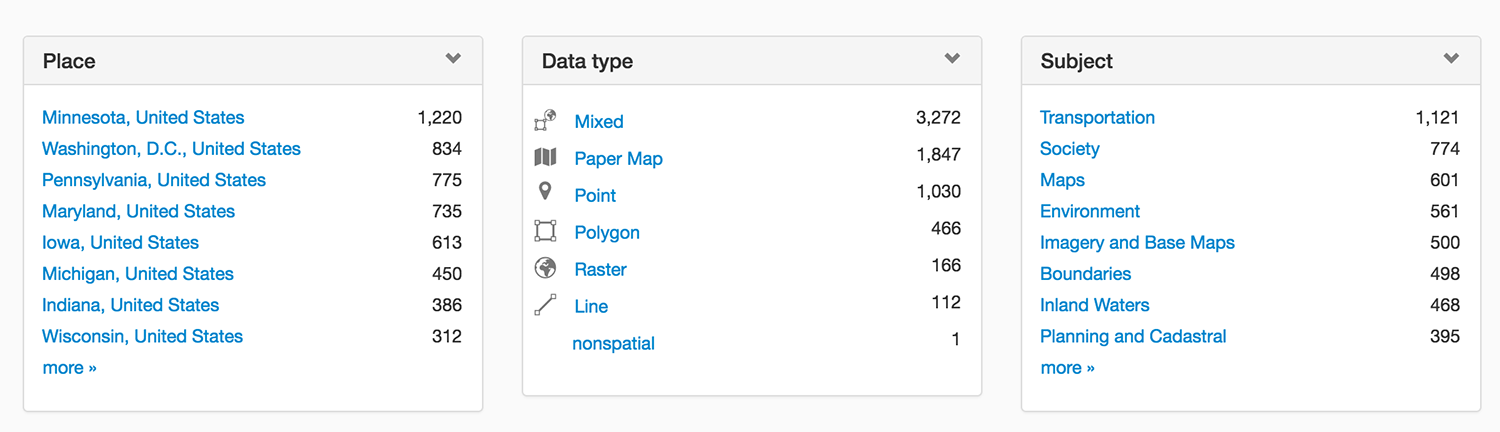 Figure 6: After
Search results page facets during testing and new options after metadata cleanup
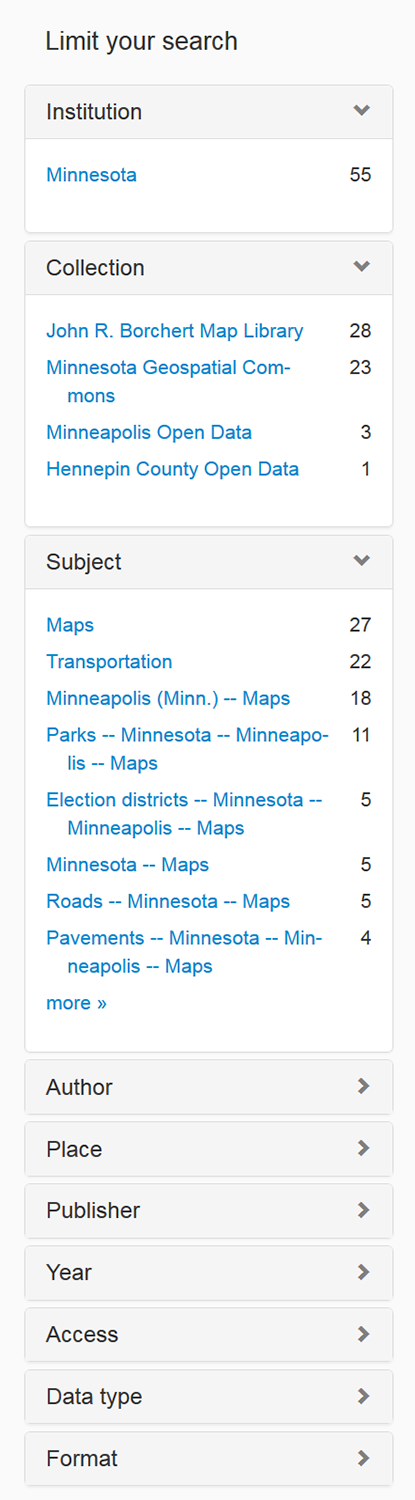 Figure 7: Before
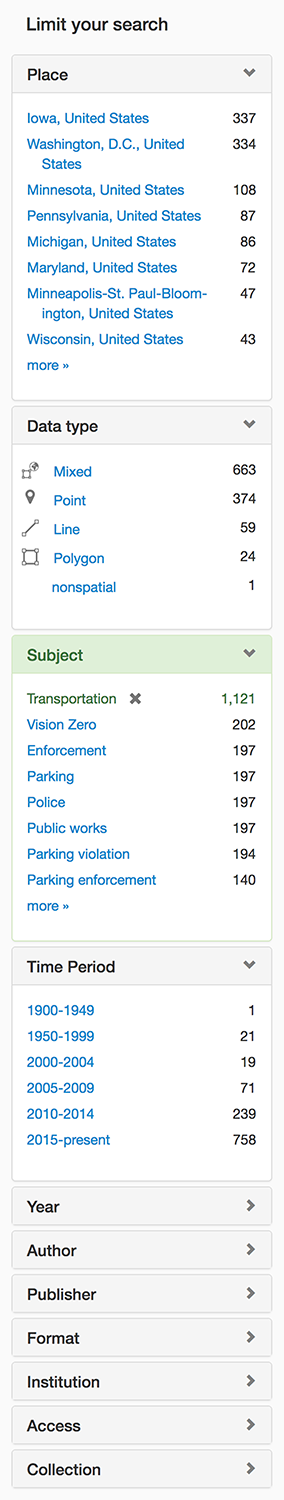 Figure 8: After
Start Over button during testing and after enhancement
 Figure 9: Before
 Figure 10: After
Codebase Enhancements
GeoBlacklight is open source software shared on GitHub, and the main developers welcome collaborative development. Our recommendations that would require modifications to the codebase were reported as potential “enhancements” to the GeoBlacklight GitHub Issues tracker. These issues were reviewed by the GeoBlacklight developer community during a code sprint during the summer of 2017 and selected for inclusion based upon shared need and achievability. This process resulted in improvements in metadata views, more comprehensive recommendations for the metadata profile, and an investigation into the layout and functionality of the map search.
Conclusions, Remaining Questions, and Future Research
Observing the search strategies across a variety of users revealed that the level of GIS experience appeared to have little to no effect on item discovery. Instead, success could be predicted based upon the level of experience in research, libraries, or even online shopping. Users who were already sophisticated searchers were able to creatively expand their strategies to complete the tasks, even when exposed to unfamiliar GIS terminology. In contrast, less experienced searchers found using the geoportal difficult, and might find any type of catalog application challenging, regardless of the discipline. One instance where having a discipline knowledge of geospatial resources was helpful occurred when interpreting the map preview box, which, depending upon the resource type, will display either bounding boxes, web service overlays, or scanned images.
Although we identified and addressed many usability issues, a number of questions remain, particularly regarding metadata quality and the map search interface. Many users repeatedly said that they would only feel confident about the data if they could download and explore it in a GIS application. This leaves us with the question of how the BTAA Geoportal, and geoportals in general, can alleviate this suspicion of geospatial data. While our recommendations, such as providing more readable metadata and a codebook, should help, this poses an interesting topic for future research into the user behavior of geospatial data users. This was one area where the Institution facet helped, as some users saw this affiliation as being a sign that the data was vetted by the Institution and this made them feel more comfortable with the data. Overall, this suspicion was likely compounded by the fact that a significant portion of the available public data in the geoportal was not fully documented in the first place by the source agencies. Our metadata remediation efforts can only partially address this inadequacy by supplying basic administrative information and normalization improvements. To more fully mitigate this challenge, the geospatial community would need stronger incentives for more comprehensive metadata authoring practices across the United States beyond the federal level.
Our study challenged the convention of the map search as it is typically designed for geoportals. Most general web maps that augment digital library searching use point clustering (Digital Public Library of America) or choropleth shading (The Portal to Texas History) to display search results on a map. This approach allows users to browse and click through items on a map to access them. In contrast, geoportals feature a blank base map that needs to be adjusted to define an area of interest. Panning or zooming a geoportal map returns a separated text list of items within that spatial extent, but the map itself displays little information about the defined scope of the collection. Hovering over a search result within the list will trigger a partially transparent bounding box of that item on the map inset, but the density of available items by place will not be obvious. Depending upon the geoportal technology, a user may be able to preview one or more datasets as an overlay on the base map only after an individual item is selected. Although starting with a blank map might be the expected behavior for regular geoportal users (Kellenberger et al. 2016>), users in our study did not intuitively understand this. Further, it conflicts with how they have come to expect how to interact with map interfaces. A key difference fueling this departure is that items in a geoportal are spatially referenced by their bounding box extents, while most web maps representing collections use a single point or polygon centroid to illustrate location. Points can be easily aggregated and selected, but displaying multiple bounding boxes on a single map presents a design challenge.
A comparison of map interfaces on digital library collections websites
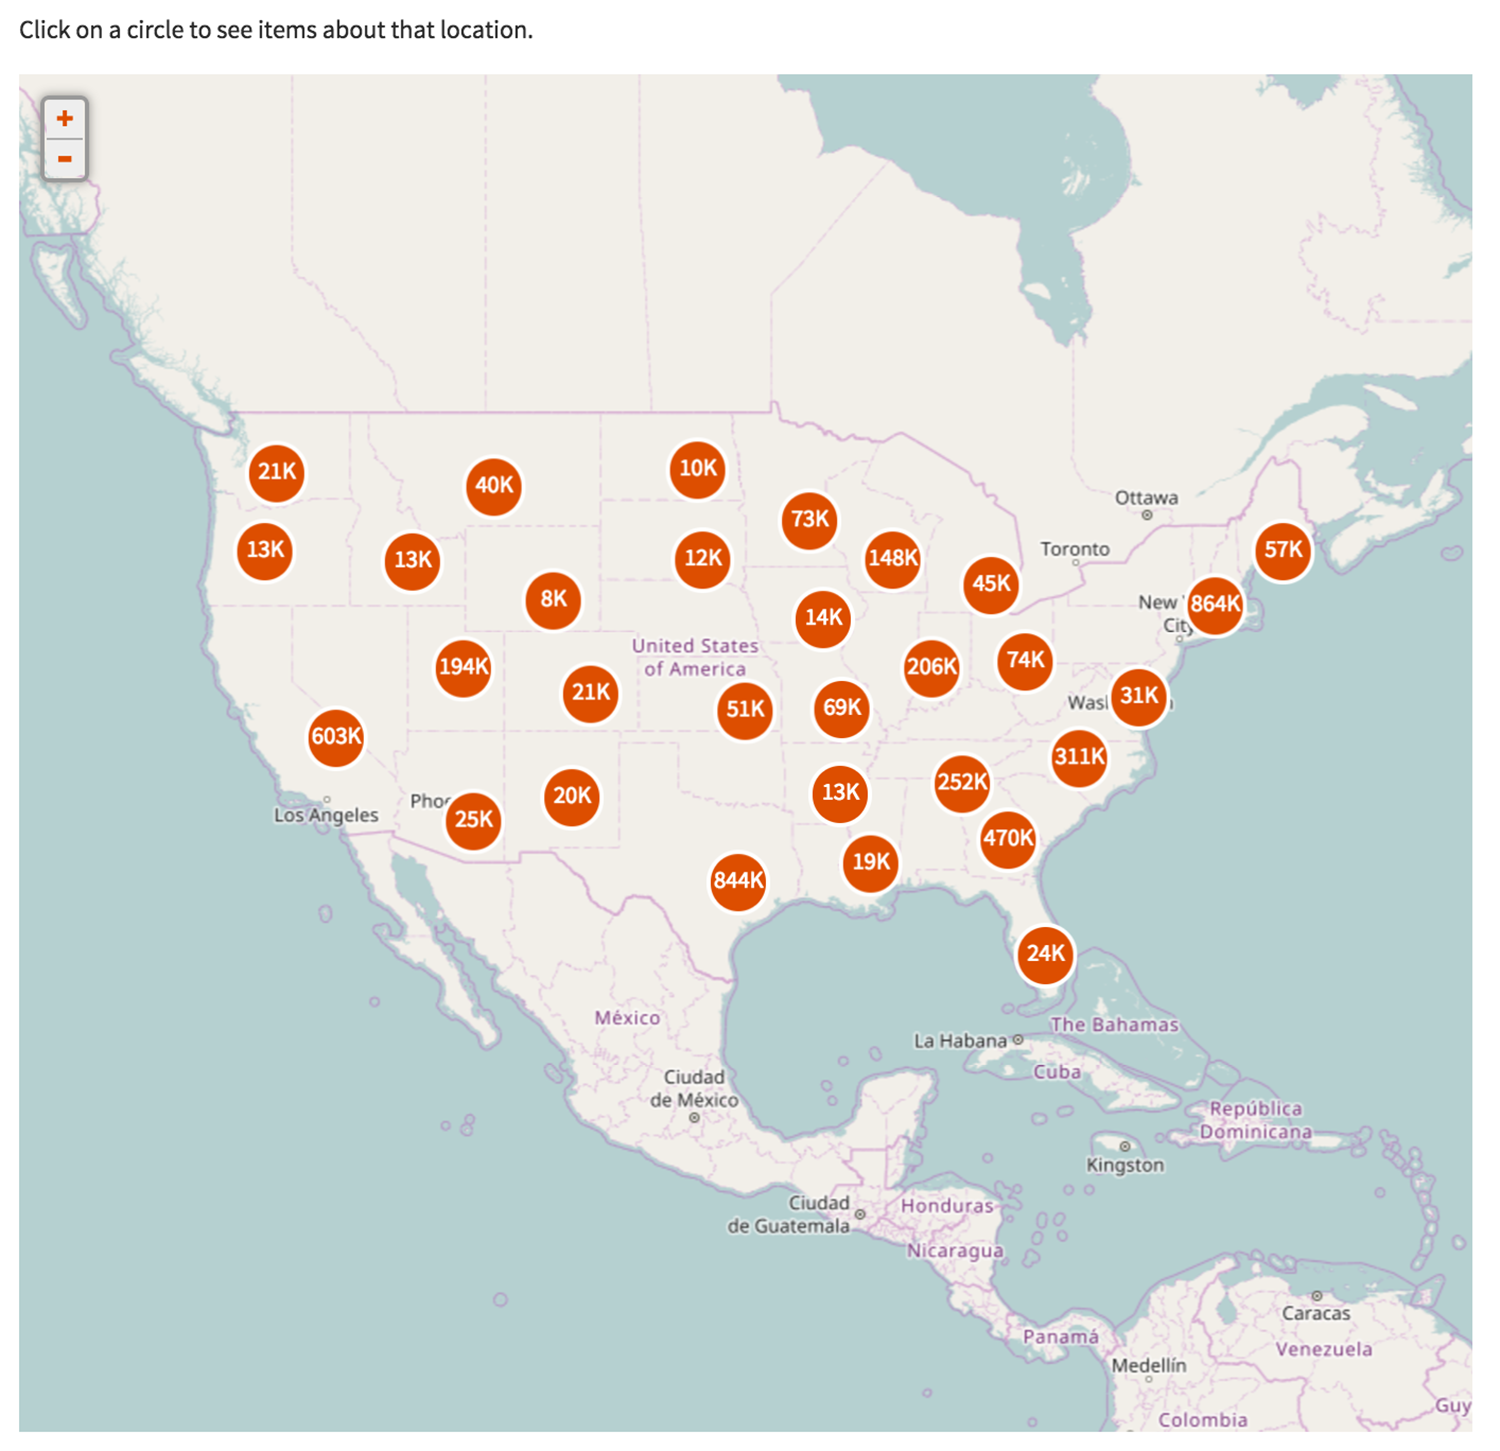 Figure 11: Digital Public Library of America. Map. https://dp.la/map
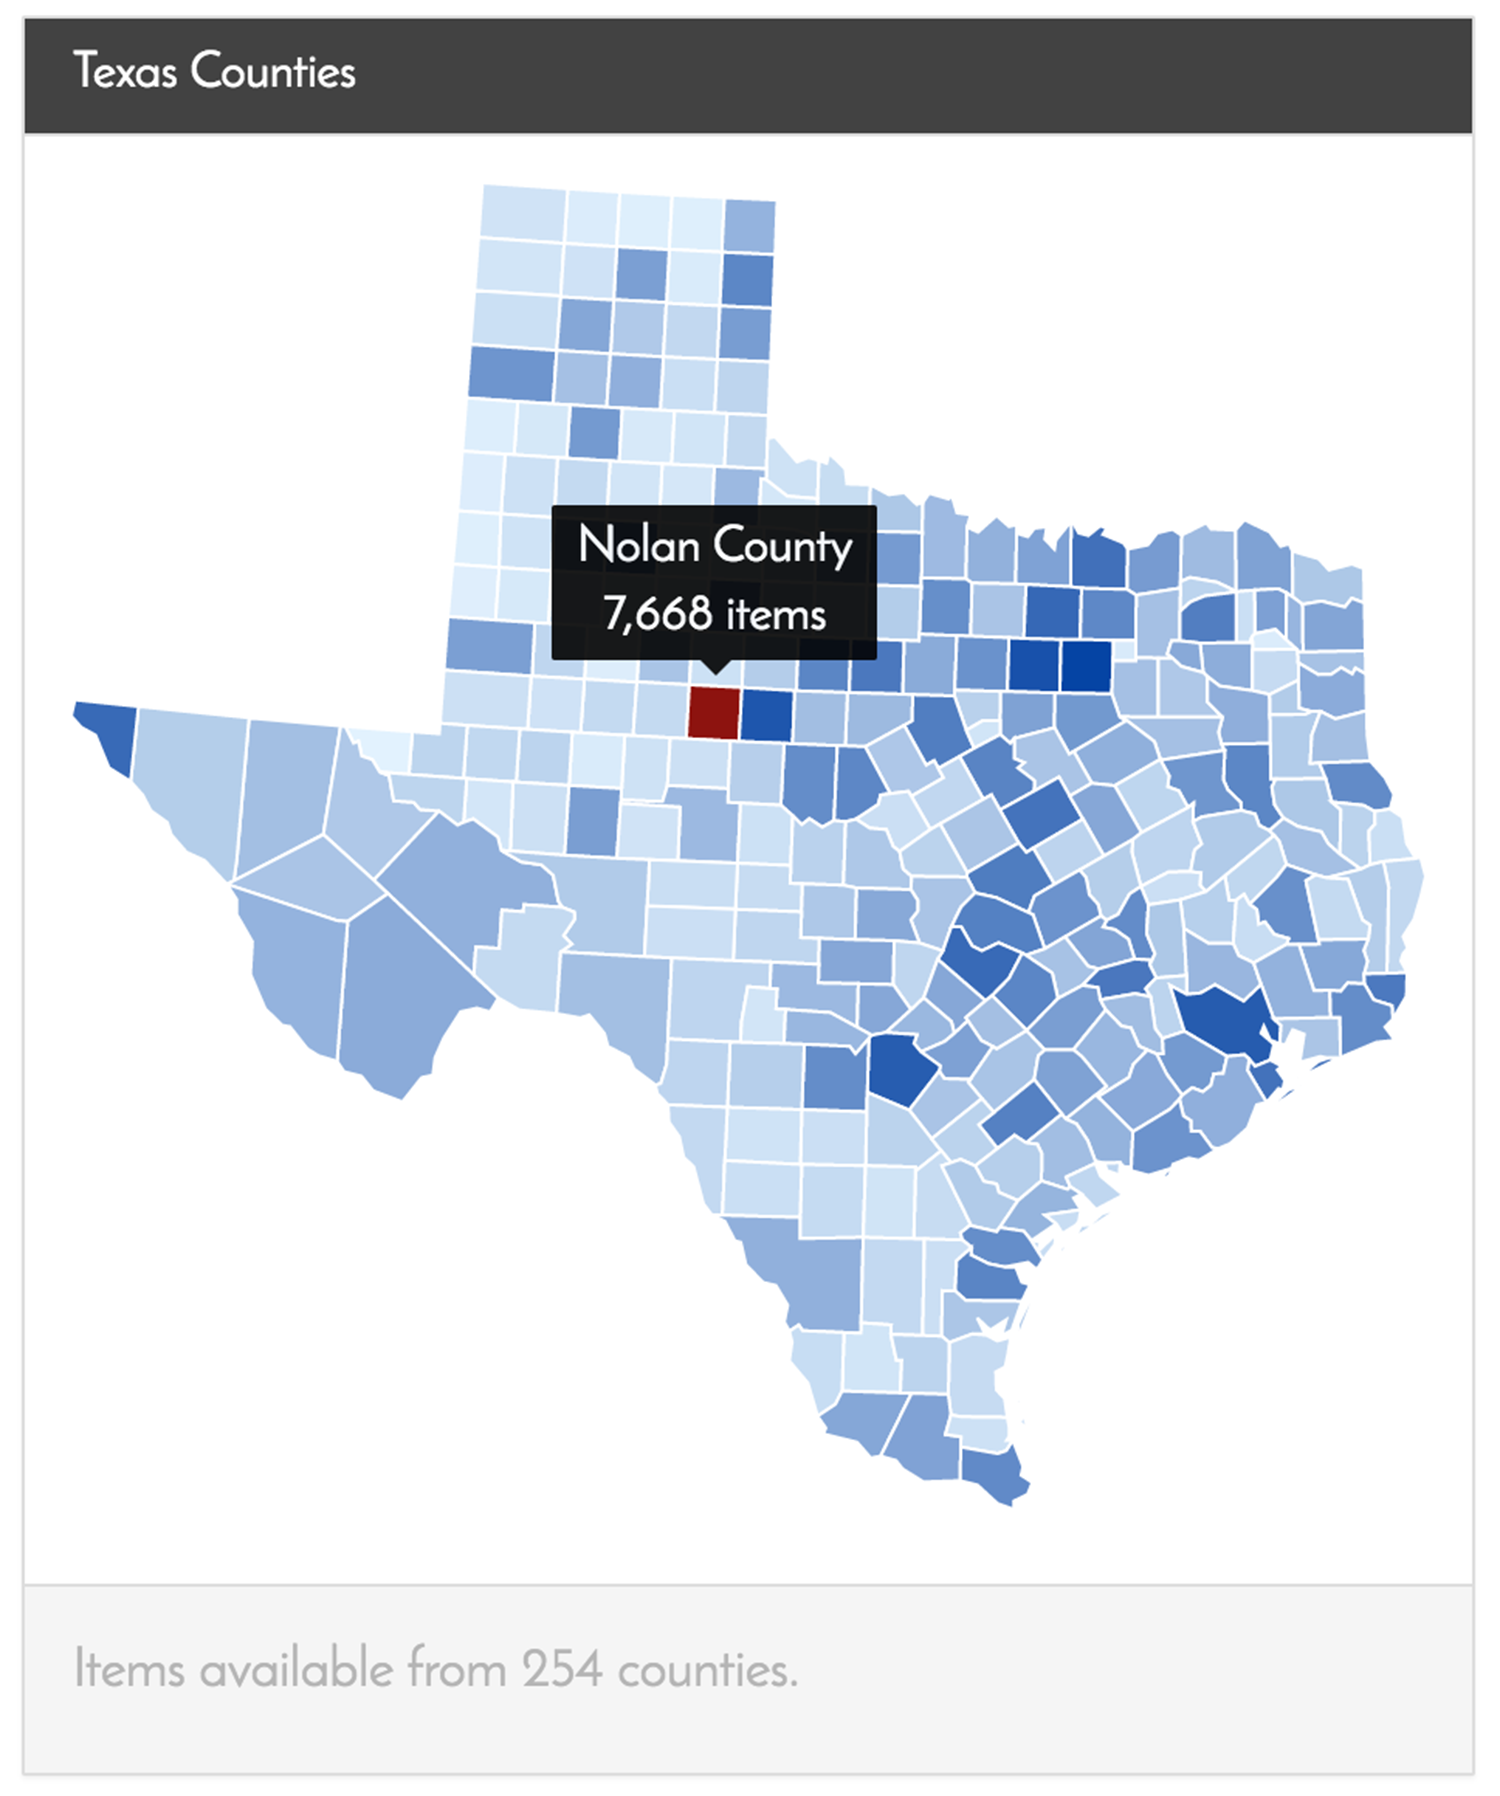 Figure 12: Portal to Texas History. Explore Locations. https://texashistory.unt.edu/explore/locations/
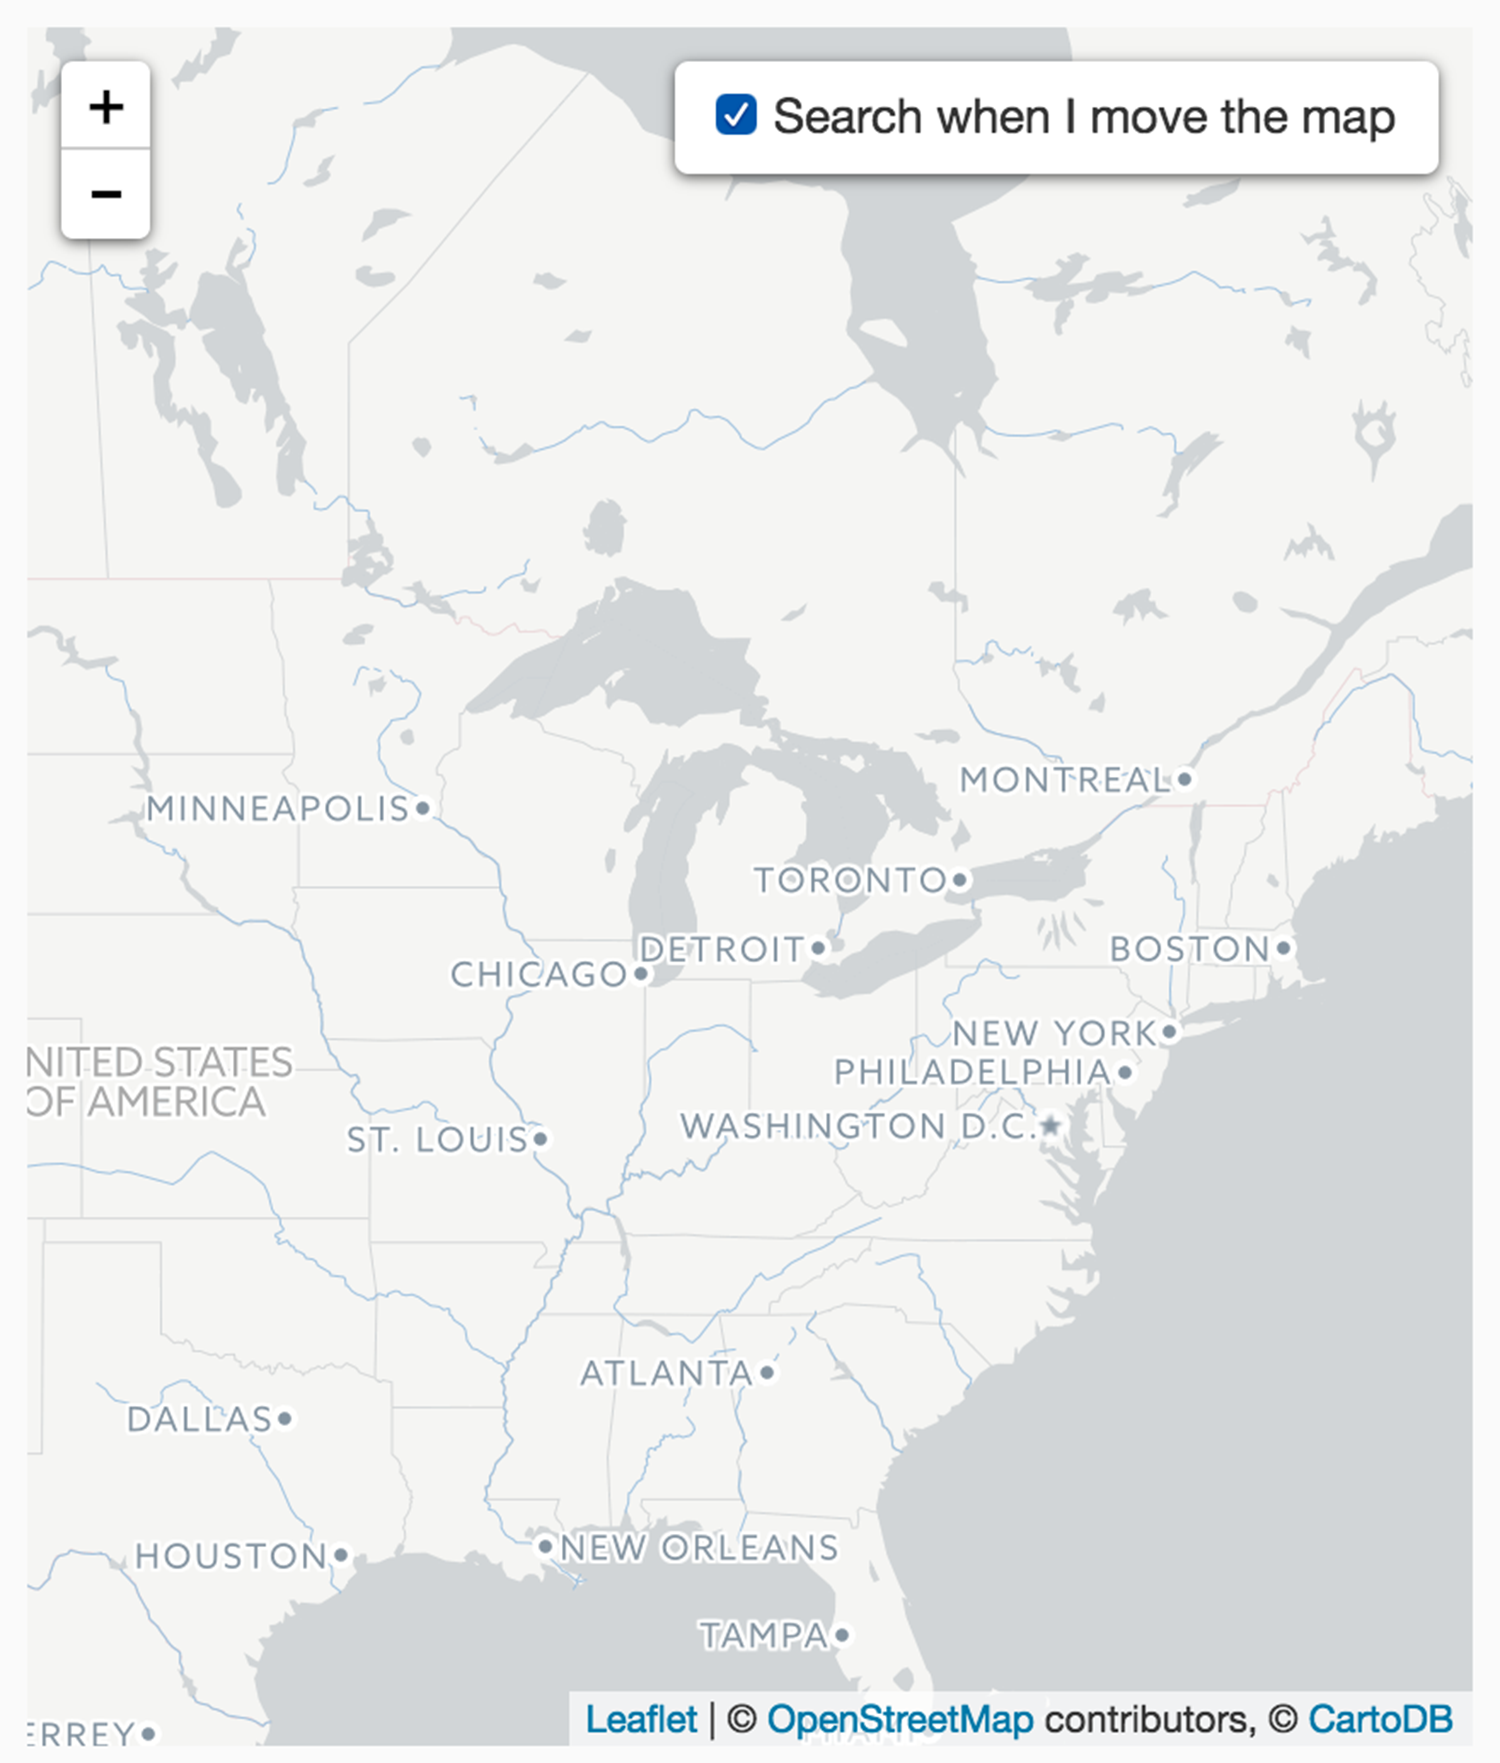 Figure 13: BTAA Geoportal search results page.
The BTAA Geoportal will continue to grow as the project adds more metadata records. We conducted our usability testing before adding many of these records. Notably, after completing the usability testing, the project added over a thousand metadata records for scanned maps from participating institutions’ library collections. The project also plans to add records for licensed geospatial data at some point in the future, which would require authentication for authorized users. These additions will likely impact the user experience of the BTAA Geoportal. To ascertain how implemented recommendations impact the usability of the interface, as well as to evaluate the inclusion of additional types of records, we plan to conduct another round of user testing in the future.
As noted in our literature review, we found a dearth of studies on usability of geoportals, particularly in the United States. We hope to see future articles addressing geoportal usability, as well as broader research into the user behavior of geospatial data users. While our study focused on the usability of our implementation of GeoBlacklight, it revealed broader topics to explore further related to the integrated map search and user suspicion of geospatial data quality, accuracy and provenance.
References
Adams, D. A., Nelson, R. R., & Todd, P. A. (1992). Perceived Usefulness, Ease of Use, and Usage of Information Technology: A Replication. MIS Quarterly, 16(2), 227. doi:10.2307/249577.
Aditya, T., & Kraak, M. J. (2005, June). Reengineering the Geoportal: Applying HCI and Geovisualization Disciplines. In 11th EC GI & GIS Workshop ESDI: Setting the Framework Sardinia, June 2005 (p. 92).
Baroudi, J. J., Olson, M. H., & Ives, B. (1986). An empirical study of the impact of user involvement on system usage and information satisfaction. Communications of the ACM,29(3), 232-238. doi:10.1145/5666.5669.
Barton, J. E., Goldie, X. H., & Pettit, C. J. (2015). Introducing a usability framework to support urban information discovery and analytics. Journal of Spatial Science, 60(2), 311-327.
Big Ten Academic Alliance Geoportal. https://geo.btaa.org/.
Campbell, N., & American Library Association. (2001). Usability assessment of library-related Web sites: Methods and case studies. Chicago, Ill: American Library Association.
De Araújo, V. O. H., de Carvalho Augusto, M. J., da Silva Py, H., & e Oliveira, R. A. A. C. The Usability of the National Spatial Data Infrastructure (INDE) Geoportal. Proceedings of the 27th of International Cartographic Conference. http://www.icc2015.org/abstract,855.html.
Digital Public Library of America. Map. https://dp.la/map.
Directive, I. N. S. P. I. R. E. (2007). Directive 2007/2/EC of the European Parliament and of the Council of 14 March 2007 establishing an Infrastructure for Spatial Information in the European Community (INSPIRE). Published in the official Journal on the 25th April. http://eur-lex.europa.eu/LexUriServ/LexUriServ.do?uri=OJ:L:2007:108:0001:0014:en:PDF
Fernández Wyttenbach, A., Moya Honduvilla, J., Poveda, B., & Angel, M. (2008). First approaches to the usability of Digital Map Libraries. e-Perimetron, 3(2), 63-76.
Stanford University Libraries. (May 29 2014) GeoBlacklight Concept Design v0.3.0. http://geoblacklight.org/documents/GeoBlacklight%20Concept%20Design%20v0.3.3.pdf.
Hardy, D. & Durante, K. (July 01, 2014). A Metadata Schema for Geospatial Resource Discovery Use Cases. Code4lib Journal, 25.
He, X., Persson, H., & Östman, A. (2012). Geoportal usability evaluation. International Journal, 7, 88-106.
Kellenberger, B., Iosifescu Enescu, I., Nicola, R., Iosifescu Enescu, C. M., Panchaud, N. H., Walt, R., … & Hurni, L. (2016). The wheel of design: assessing and refining the usability of geoportals. International Journal of Cartography, 2(1), 95-112.
Letnikova, G. (2004). Usability Testing of Academic Library Web Sites. Internet Reference Services Quarterly,8(4), 53-68. doi:10.1300/j136v08n04_04.
Nielsen, J. (1994a). Enhancing the explanatory power of usability heuristics. Proc. ACM CHI’94 Conf. (Boston, MA, April 24-28), 152-158.
Nivala, A. M., Brewster, S., & Sarjakoski, T. L. (2008). Usability evaluation of web mapping sites. The Cartographic Journal, 45(2), 129-138.
Portal to Texas History. Explore Locations. https://texashistory.unt.edu/explore/locations/
Resch, B., & Zimmer, B. (2013). User experience design in professional map-based geo-portals. ISPRS international journal of geo-information, 2(4), 1015-1037.
Saadé, R., & Bahli, B. (2005). The impact of cognitive absorption on perceived usefulness and perceived ease of use in on-line learning: an extension of the technology acceptance model. Information & Management,42(2), 317-327. doi:10.1016/j.im.2003.12.013
Wolff, R., & Parker, K. (2014). Usability Testing: Open GeoPortal 2.0. PLACE Project. 9. http://scholars.unh.edu/place/9
Appendix I: List of Participating Institutions (Year Joined)
University of Chicago (2017)
University of Illinois at Urbana-Champaign (2015)
Indiana University Bloomington (2016)
University of Iowa (2015)
University of Maryland (2015)
University of Michigan (2015)
Michigan State University (2015)
University of Minnesota (2015 – host institution)
Ohio State University (2017)
Pennsylvania State University (2015)
Purdue University (2015)
University of Wisconsin-Madison (2015)
Appendix II: Heuristic Evaluation Summary for the BTAA Geoportal
Heuristic evaluations were completed by 6 internal members using a standard template based on Nielsen’s (1994) usability heuristics for user interface design.
Minor issues defined as usability ratings above 70%
Major issue defined as usability rating between 61% to 75%
Catastrophic issue defined as usability ratings less than 60%
Appendix III: Test Tasks for Users with GIS Experience
Task 1: Find and download a map of Ann Arbor from the 1800s.
Task 2: You are researching the lakes within Minnesota. Find the approximate number of records that include information about lakes in Minnesota that are available.
Task 3: You are writing an article about Wisconsin Governor Scott Walker and want to include maps of who voted for him in the 2010 election. Find where to download this information.
Task 4: You want to make a simple map of all of the counties in Pennsylvania. Find where to download this information.
Task 5: You just moved to the city of Ypsilanti in Washtenaw County and you want to learn more about the area. Find the approximate number of records that are available.
Task 6: You are working on a project where you want to overlay roads with aerial imagery in Hennepin County, MN. Find the aerial imagery and how to access it, then find the roads data and where to download it.
Task 7: You are researching the concept of environmental justice and plan to analyze census population demographics and access to public parks for the states of Indiana. Find where to download this information.
Appendix IV: Test Tasks for Users without GIS Experience
Task 1: Find and download a map of Ann Arbor from the 1800s.
Task 2: You are researching the lakes within Minnesota. Find the approximate number of records that include information about lakes in Minnesota that are available.
Task 3: Your grandpa, Henry Jennings, family is selling their farm in Sperry Township, which is in Clayton County, Iowa. You think that they bought the property in 1910. Can you find a map of Sperry Township?
Task 4: You want to make a simple map of all of the counties in Pennsylvania. Find where to download this information.
Task 5: You just moved to the city of Ypsilanti in Washtenaw county and you want to learn more about the area. Find the approximate number of records that are available.
About the authors
Mara Blake is the Data Services Manager at the Sheridan Libraries and Museums at Johns Hopkins University. In this position, Blake leads the Data Management Services and Geographic Information Systems (GIS) services for the library, including the JHU Data Archive. Previously, Blake worked on the Big Ten Academic Alliance Geospatial Data Project as a Spatial and Numeric Data Librarian at the University of Michigan. Mara is committed to developing user-centered library data services.
Karen Majewicz is the Geospatial Project Metadata Coordinator and Project Manager for the Big Ten Academic Alliance Geospatial Data Project. She works at the John R. Borchert Map Library at the University of Minnesota – Twin Cities.
Amanda Tickner is a GIS/Makerspace/Urban Planning Librarian at Michigan State University and previously worked at the Research Hub in Davis Library at the University of North Carolina Chapel Hill. She currently serves as a representative of MSU to the Big Ten Academic Alliance Geospatial Data Project.
Jason Lam is a graduate student at the University of Michigan who specializes in Human Computer Interaction and Mental Health. He works as a research assistant at the School of Information where he is engaged in developing new technologies to make information more accessible.

Subscribe to comments: For this article | For all articles
Leave a Reply