by Brett Williams
Introduction
In an early library position, I was working with second-language learners aiming for higher education in the United States, Canada and the UK. In an attempt to explain the difference between what they needed to think through and what a computer search could accomplish, I coined this aphorism “Computers are dumb, people are smart. But computers are good at doing the same thing over and over again.”
This aphorism is a constant in my information literacy instruction and it informs how I teach search strategies and research. Using VOSviewer to map search results throws the power of a computer doing the ‘same dumb thing over and over again’ at a series of common search techniques of keyword, author and citation searching. The resulting maps are impressive and the interactive mapping allows a careful researcher to gain a comprehensive view of an author, a keyword search or a set of articles.
Literature Review
VOSviewer has been in active development since 2009 [1]. VOSViewer uses van Eck and Waltman’s VOS (Visualization of Similarities) algorithm to display the relationship between entities in a way in which both direct and indirect connections between entities result in placing those entities closer together on a map [2].
In the library science literature, bibliometrics is presented in the context of research data management, often as a service provided by research data management departments in large research universities [3]. Bibliometrics is also used as a tool for after-the-fact analysis of data gathered through other means, such as the content management system used for virtual reference transactions [4]. Zahedi et al. applied the text mining tools inside VOSviewer to identify common topics of interest to users of Mendely [5]. However, up to this point there does not appear to be any application of bibliometrics or citation mapping to searching during the reference interview.
VOSViewer supports mapping citation data extracted from Web of Science, Scopus, Dimensions and PubMed. The demonstrations and live links in this paper will use data solely from Dimensions, but the techniques and tools rely on generally applicable Boolean search strategies. Dimensions is a relatively new discovery layer developed by Digital Science, the developers of the ReadCube citation management software, integrating scholarly articles, book chapters, grant and funding material and allowing the export of bibleometric data. Dimensions can be found at app.dimensions.ai. Dimensions coverage and citation accuracy compares favorably to Google Scholar, Scopus and Web of Science [6][7].
Search Techniques
The 5W’s mnemonic is a helpful structure to use during the reference interview. It is used extensively in the reference interview techniques in this paper to organize and identify search strategies suitable for bibliometric mapping.
Table 1.
| Who | Identify and record key researchers, including links to their profile in Dimensions if available |
| When | Narrow the date range |
| What | Identify and record ‘Fields of Research’ inside Dimensions that correspond with the research request |
| Where | Identify and record key institutions and research groups with the patron |
| Why | Identify the broader purpose of the research request and the intended outcome for the paper |
Export
Figure 1.
Dimensions supports exporting the first 2500 results. For early stages of exploring a topic, simply using the relevance sort and mapping the first 2500 results can be extremely effective for identifying major topics, refining a search strategy and identifying major authors. A basic export is initiated by clicking “Save/Export” and then clicking “Export for bibliometric mapping.” An export of 2500 records will take between 30 seconds and 3 minutes to export depending on the load on the Dimensions servers.The export is a zipped CSV file with each publication listed along with its citations.

Figure 2.
While waiting for this export, continue the reference interview by identifying key authors under the “Researcher” limit, narrowing the date range under the ‘Publication year’ limit and identifying the categories used by Dimensions under the “Fields of Research” limit.
When the export is complete, you will get an email notification and the export will appear in the Dimensions Export Center. The downloaded file is a zipped CSV file.
Mapping
- Unzip the file and open VOSviewer
- You can launch VOSViewer from the website at http://www.vosviewer.com/
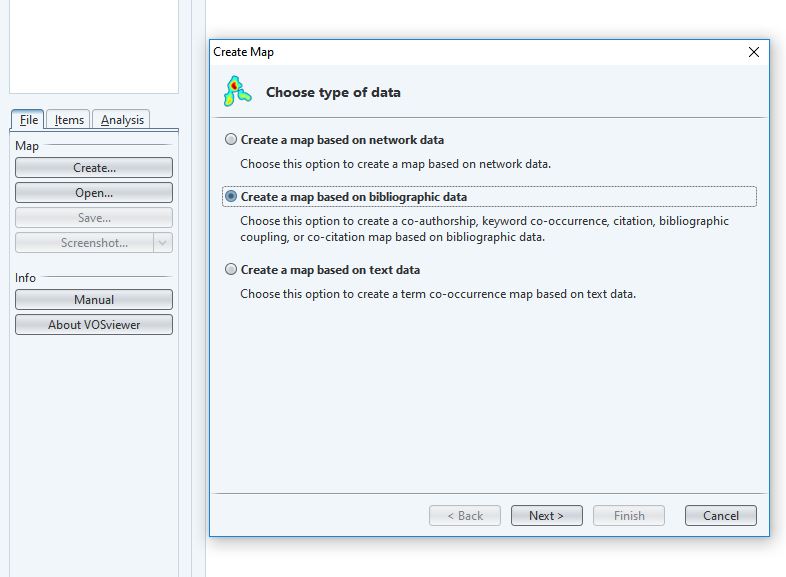
- Under File > Create > “Create a map based on bibliographic data”
Figure 3.
- Then “Read data from bibliographic database files” and choose the Dimensions tab, navigating to the location of the unzipped CSV file
Figure 4.
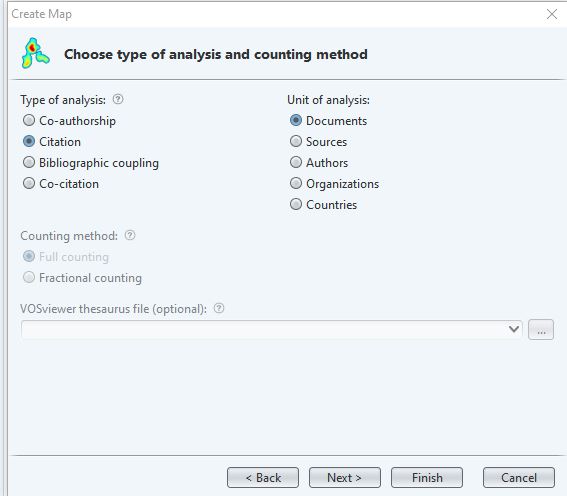
- The Type of analysis is ‘Citation’ and the Unit of analysis is ‘Documents’
Figure 5.
- Depending on the search, modify the following:
- Minimum number of citations
Figure 6.
-
- Number of documents

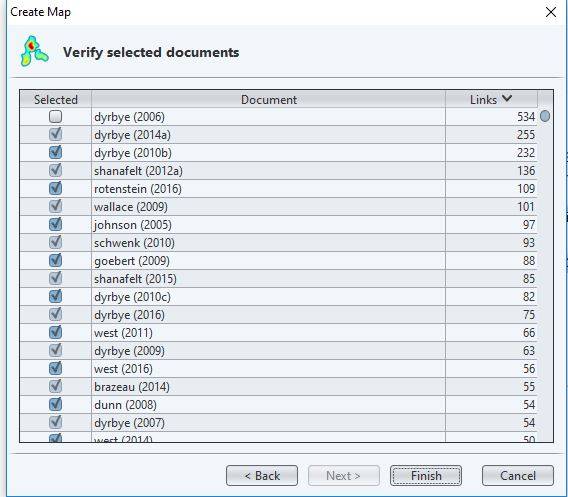
- You can verify and exclude any of the documents
Figure 8.
- If there are disconnected items, VOSviewer will alert you before mapping and give you the option of only displaying the largest cluster
1. Advanced Boolean Search – Sorted by Relevance
Tools
- Dimensions
- VOSViewer
Example Search String
(Burnout AND (Suicide OR “Suicidal Ideation” OR (suicid* OR parasuicid* OR self-harm*))) AND (surgeon* OR doctor* OR physician* OR clinician* OR anesthesiologists OR anesthetist* OR psychiatrist* OR oncologist* OR internist* OR geriatrician* OR cardiologist* OR dermatologist* OR Rheumatologist* OR nephrologist* OR neurologist* OR radiologist* OR respirologist* OR rheumatologist* OR paediatrician* OR Endocrinologist* OR pathologist* OR neurosurgeon* OR Gynecologist* OR Obstetrician* OR Ophthalmologist* OR urologist* OR Neuropathologist*)
Map

Figure 9.
Access to the original CSV file:
https://drive.google.com/drive/folders/1PPhJIQj4HTaeKgnZ0e6ecvGA6hl4PqW6?usp=sharing
Techniques
Identify citation clusters
VOSviewer colors clusters of citations using a set of colors selected using the menu on the right hand side. The largest clusters are colored with a dark red for the largest, green for the second largest, a dark blue for the third largest and yellow for the fourth largest cluster.
Scan for these four largest clusters immediately and pass your mouse over the largest bubbles to identify the key topics.
In the example map, the green cluster is largely about training therapists. The large red cluster is largely about medical students.
Figure 10.

Figure 11.
You can click on any bubble to go directly to the article referenced. Identifying these key clusters, and the most highly cited articles within them will allow you to fill out your 5W’s chart with the patron in a more comprehensive way. Pay close attention to finding highly cited articles, systematic reviews, and authors.
You may also wish to adjust the search based on the search strategy and parameters you set earlier.
Identify highly cited articles
Highly cited articles are indicated by the larger size of the bubble. In the green cluster at the bottom, the Beidas 2010 article in Figure 10 has 488 citations that match the criteria. The Dyrbye 2006b article in Figure 11 has 777 citations that match the criteria.
Look at the citations for these two articles, when looking at the search indicated in the example:
Beidas, Rinad S., and Philip C. Kendall. “Training Therapists in Evidence-Based Practice: A Critical Review of Studies From a Systems-Contextual Perspective.” Clinical Psychology: Science and Practice, vol. 17, no. 1, 2010, pp. 1–30. Wiley Online Library, doi:10.1111/j.1468-2850.2009.01187.x.
Dyrbye, Liselotte, et al. “Systematic Review of Depression, Anxiety, and Other Indicators of Psychological Distress Among U.S. and Canadian Medical Students.” Academic Medicine, vol. 81, no. 4, Apr. 2006, pp. 354–73.
Both are relevant, but clearly the focus on medical students is a strength of this search and the cluster around the Dyrbye article is something to look into.
Identifying connectors
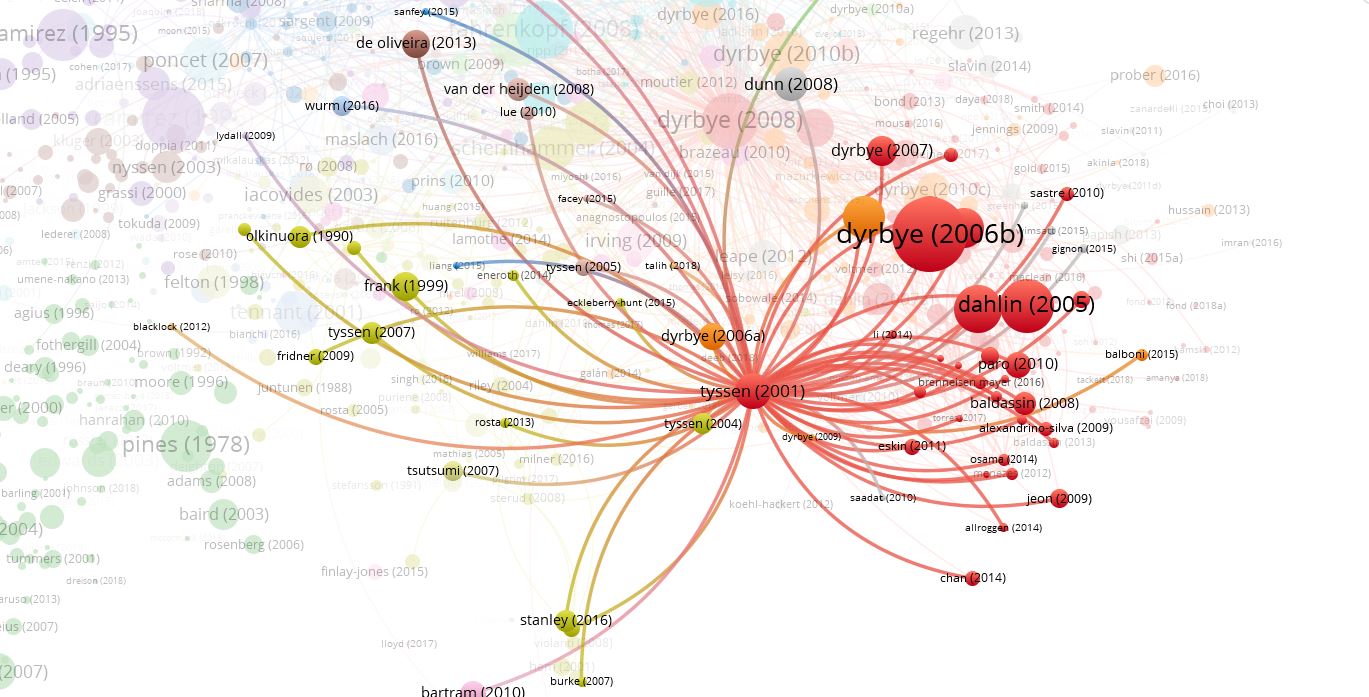
The Tyssen 2001 article is closely connected to both the red (medical students), orange (medical students) and yellow clusters (first responders). It is also highly cited with 169 citations.
Tyssen, Reidar, et al. “Suicidal Ideation among Medical Students and Young Physicians: A Nationwide and Prospective Study of Prevalence and Predictors.” Journal of Affective Disorders, vol. 64, no. 1, Apr. 2001, pp. 69–79. ScienceDirect, doi:10.1016/S0165-0327(00)00205-6.
Figure 12.
2. Key Papers & Citations
Tools
- Dimensions
- VOSviewer
Dimension VOSViewer Tools “Citation Link” for creating larger data sets: https://docs.google.com/spreadsheets/d/1f73EmJ-fhRnrDtHNCpl04tVBtLH_i5CGqP70QkQwM_w/edit?usp=sharing
Example Search
Exported and mapped bibliographies and citations for:
Donald, I., Cartwright, S., Taylor, P., Millet, C., Cooper, C., & Johnson, S. (2005). The experience of work?related stress across occupations. Journal of Managerial Psychology, 20(2), 178–187. https://doi.org/10.1108/02683940510579803.
Dyrbye, L. N., Massie, F. S., Eacker, A., Harper, W., Power, D., Durning, S. J., … Shanafelt, T. D. (2010). Relationship Between Burnout and Professional Conduct and Attitudes Among US Medical Students. JAMA, 304(11), 1173. https://doi.org/10.1001/jama.2010.1318.
Dyrbye, L. N., West, C. P., Satele, D., Boone, S., Tan, L., Sloan, J., & Shanafelt, T. D. (2014). Burnout Among U.S. Medical Students, Residents, and Early Career Physicians Relative to the General U.S. Population: Academic Medicine, 89(3), 443–451. https://doi.org/10.1097/ACM.0000000000000134.
Dyrbye, L., Thomas, M., & Shanafelt, T. (2006). Systematic Review of Depression, Anxiety, and Other Indicators of Psychological Distress Among U.S. and Canadian Medical Students. Academic Medicine, 81(4), 354–373. Retrieved from insights.ovid.com.
Map – Including Key Articles – Keeping Citations – Keeping Cited By
1 citation, top 1000 documents, Resolution 1:

Figure 13.
Map – Excluding Key Articles – Keeping Citations – Keeping Cited By
1 citation, top 1000 documents, Resolution 1:

Figure 14.
Techniques
One of the most effective search techniques when talking to graduate students and faculty has been building off of articles that they already know about. Inside the Five W’s model, this helps fill out many aspects including When (publication dates), Where (institutions where the authors have published, where studies were done), Who (Author and co-author searches), What (specific terminology) and Why (schools of thought, methodological tools, validated measurement surveys).
Using Dimensions you can export both the citations from a paper, and all of the papers that cite the paper. This technique works best with 3-5 ‘Key Articles.’
Search for a key article by DOI, using the DOI search in Dimension. With a single entry in the search results, “Export for Bibliometric mapping.” Then open the full records and scroll down to ‘Publication Citations.’ Click ‘See All,’ then export this view. Repeat this for each key article. This creates a set of files that can be easily identified by size.
Figure 15.
What exporting both the article with its references and the publication citations creates is a 360 degree view of the networks associated with each individual article, allowing you to map connections between them.
As the process of extracting the individual articles can get a little confusing, I’ve developed a tool to help keep track of larger groups of articles. To use, find the individual article pages and paste them under “Article URL.”
Individual article URL’s look like this, but may contain a longer search string:
https://app.dimensions.ai/details/publication/pub.1083855537
The page to export the citations will appear on the right and will have a URL like this:
https://app.dimensions.ai/discover/publication?subset_publication_citations=pub.1083855537
https://app.dimensions.ai/discover/publication?subset_publication_citations=pub.1083855537
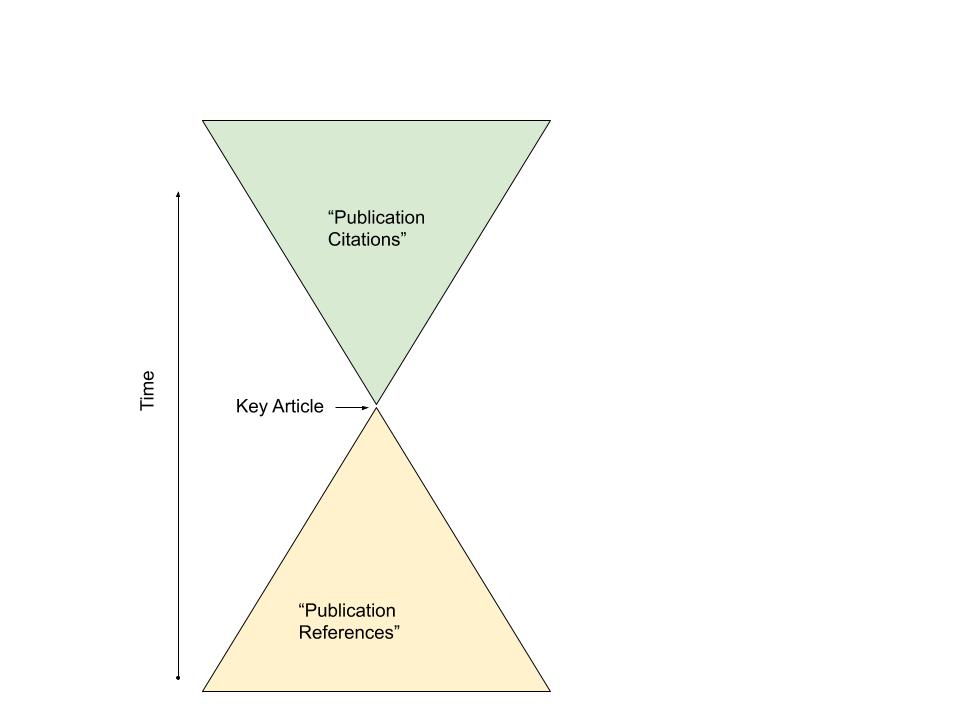
Figure 16.
Adjusting Resolution
One of the quick adjustments you can easily make to simplify a map is to adjust the resolution. Under the Analysis Tab in the Clustering section you can adjust how sensitive the clustering algorithm is. Lower numbers (0.1, 0.25, etc.) are less sensitive and will result in fewer, larger clusters. Higher numbers (1, 2, etc.) are more sensitive and will result in many, smaller clusters. Click ‘Update Clustering’ to apply the new resolution.
Adjusting resolution is particularly effective when you’ve already identified the importance of individual articles.
Mapping excluding only the ‘Key Articles’
You can also exclude the key articles you’ve identified already in the last selection before launching the map. This can be particularly effective if you know already that most of your articles will cite your key article. This emphasises the citations between the Publication Citations and Publication References without the extra, known noise of the citation of the known Key Article.
Figure 17.
3. Key Authors
Tools
- Dimensions
- VOSViewer
Example Search
- Burnout AND Physician against all publications by Liselotte N Dyrbye
- Burnout AND Physician against all publications by Tait D Shanafeldt
Map
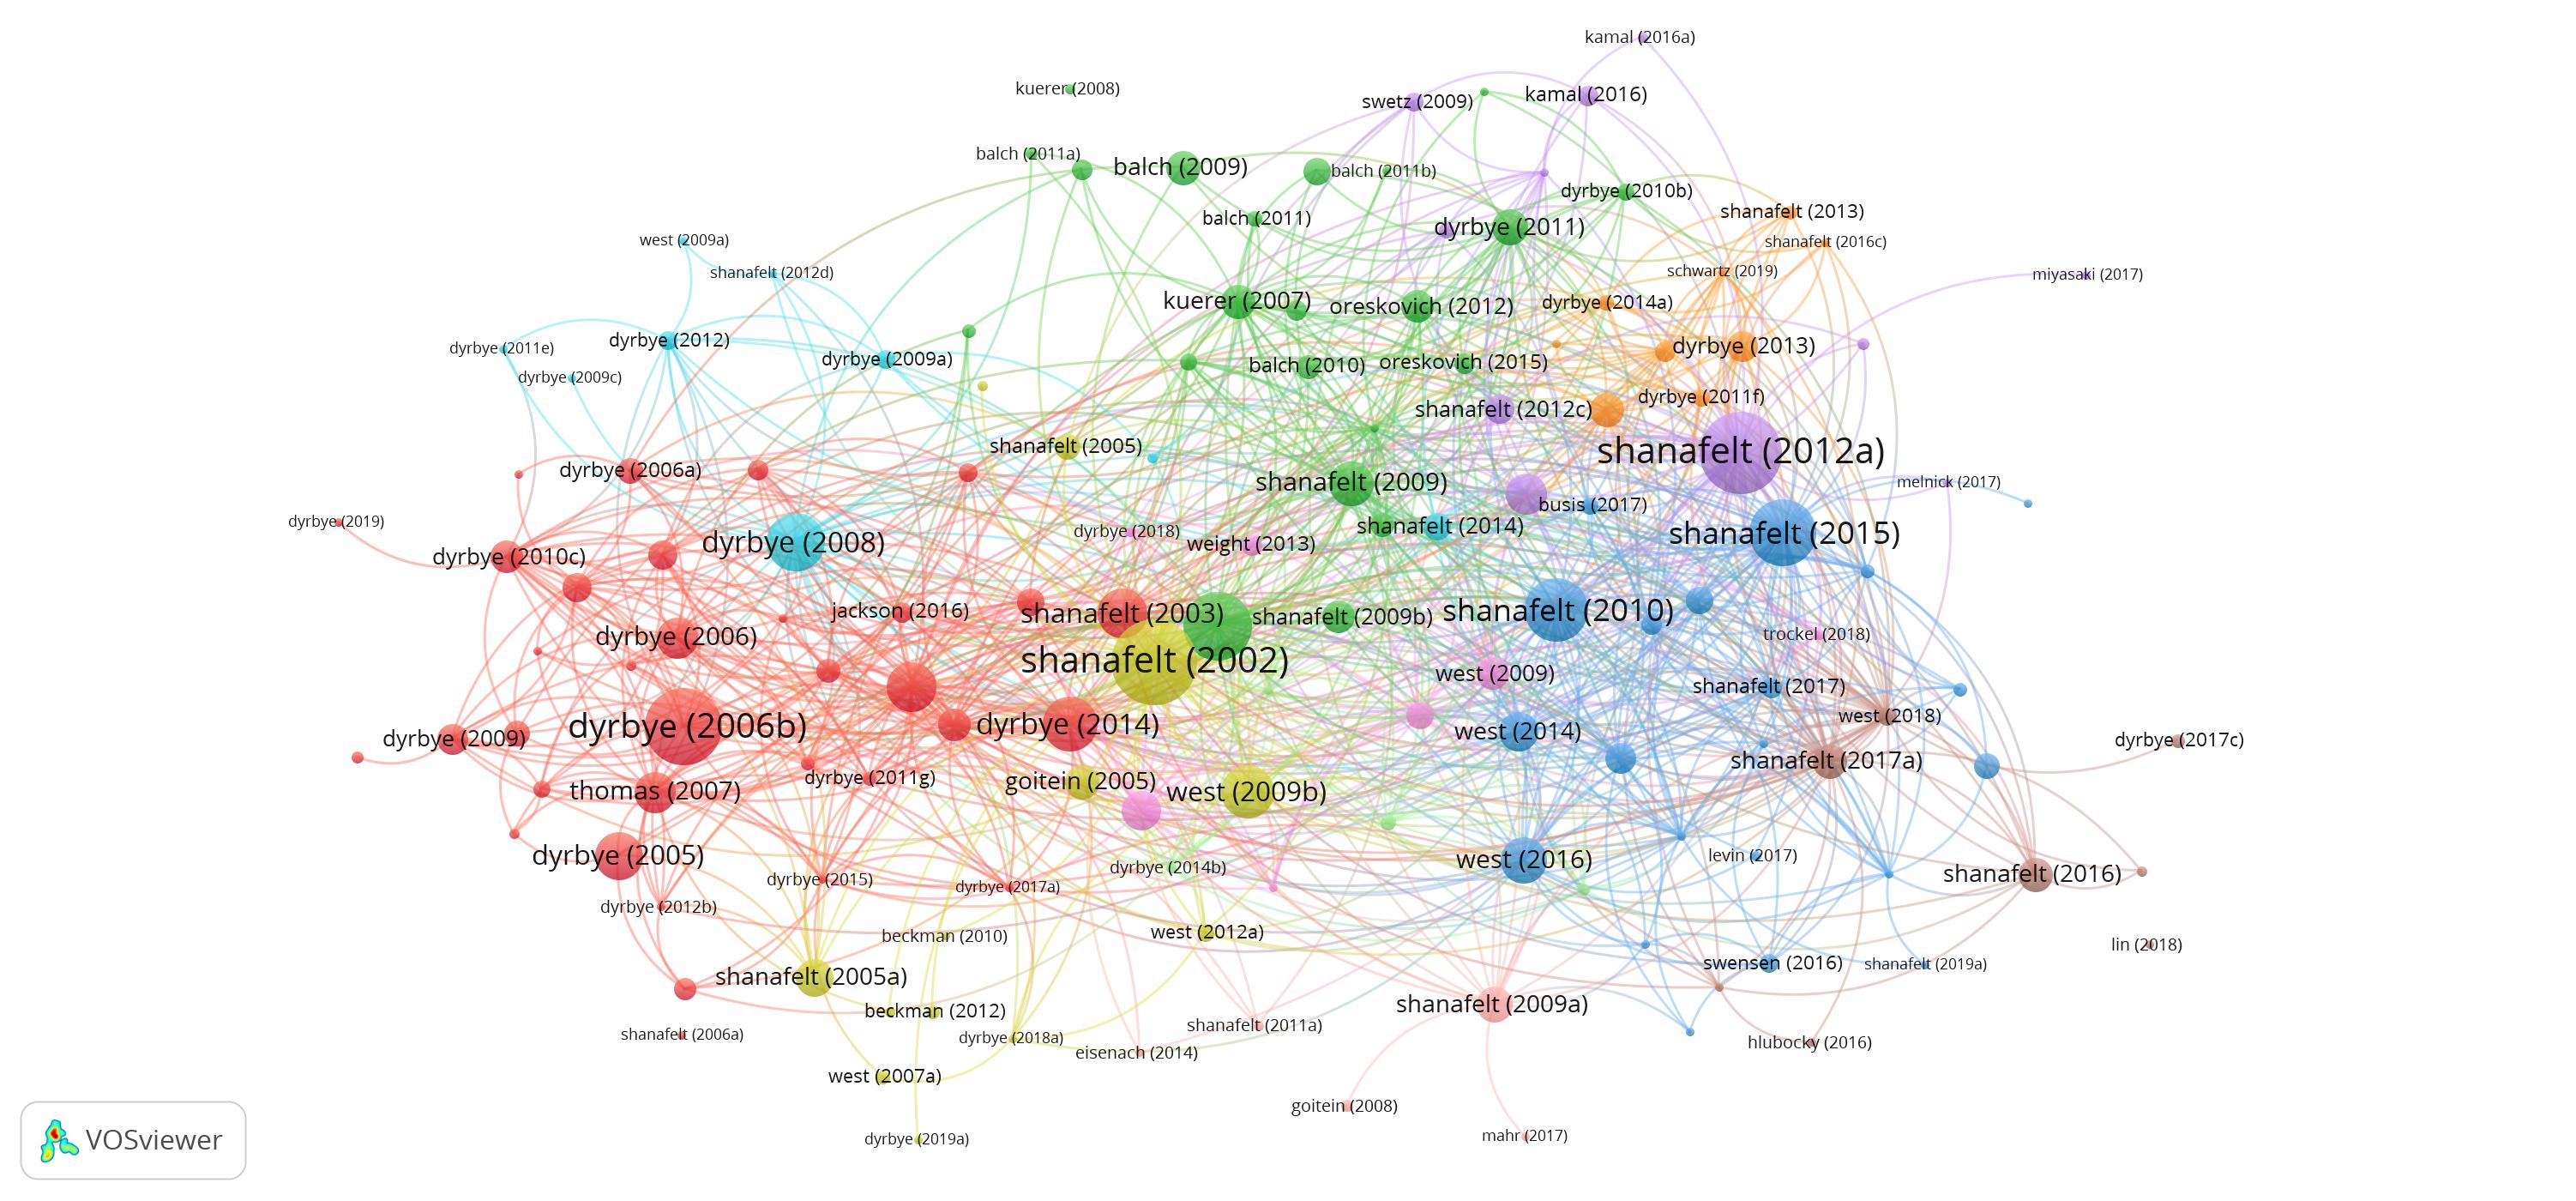
Figure 18.
Techniques
Reviewing Clusters
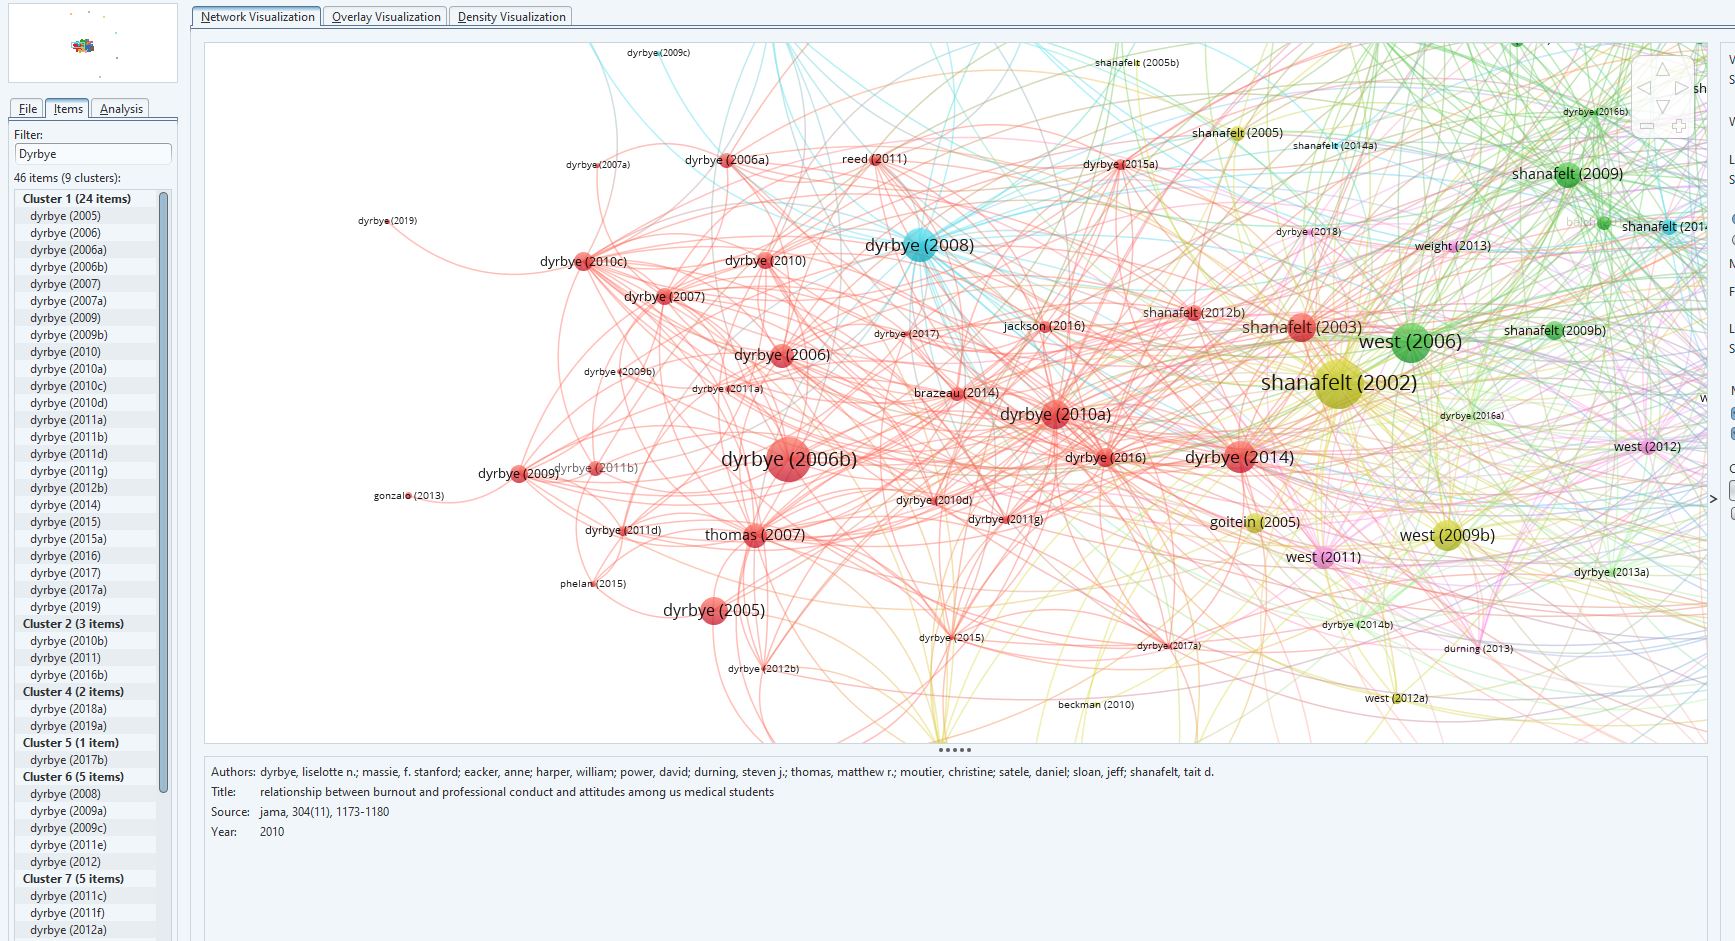
Under the ‘Items’ tab in the sidebar you can review each cluster with an alphabetical view of each paper included in the cluster. Cluster 1 is the red cluster. You can right click to jump directly to each individual bubble in the cluster.
Figure 19.
As you have already identified these scholar’s works as important and you have already filtered by keywords for the specific type of journal article you are looking for, it is often effective to review each item in the cluster for relevance.
Filtering by First Author
Built into the Items tab is an option to filter. Searching for a first author will show in which clusters that author’s work shows up.
Figure 20.
4. List of Papers By DOI (Google Sheets Tool)
Tools
- Zotero
- Zotero DOI Manager Plugin
- DimensionVOSviewer Tools spreadsheet under “DOI”
- Dimensions
- VOSViewer
Example Search
10.1001/archinternmed.2010.350 OR 10.1001/jama.2012.6183 OR 10.1001/jama.2019.4168 OR 10.1001/jamainternmed.2013.8519 OR 10.1001/jamainternmed.2016.3284 OR 10.1001/jamanetworkopen.2019.0932 OR 10.1001/jamaophthalmol.2016.5392 OR 10.1001/jamaophthalmol.2016.5399 OR 10.1002/hec.1344 OR 10.1002/hec.1378 OR 10.1002/hec.1663 OR 10.1002/hec.3572 OR 10.1002/jhm.2400 OR 10.1002/lary.27311 OR 10.1007/s10198-014-0582-8 OR 10.1007/s10198-016-0861-7 OR 10.1007/s11606-018-4462-2 OR 10.1007/s11606-018-4579-3 OR 10.1007/s11606-018-4632-2 OR 10.1007/s11606-019-04940-9 OR 10.1007/s12630-019-01321-y OR 10.1007/s13524-014-0320-y OR 10.1016/j.acra.2006.06.010 OR 10.1016/j.adaj.2017.01.005 OR 10.1016/j.ajo.2018.09.003 OR 10.1016/j.amjms.2017.12.001 OR 10.1016/j.fertnstert.2019.02.004 OR 10.1016/j.genm.2010.07.003 OR 10.1016/j.healthpol.2010.06.019 OR 10.1016/j.healthpol.2015.01.005 OR 10.1016/j.healthpol.2019.05.002 OR 10.1016/j.ijrobp.2018.09.042 OR 10.1016/j.jacc.2015.10.038 OR 10.1016/j.jamcollsurg.2017.03.018 OR 10.1016/j.jcjo.2014.02.007 OR 10.1016/j.jcjo.2014.03.005 OR 10.1016/j.jcjo.2016.04.013 OR 10.1016/j.jebo.2005.06.007 OR 10.1016/j.jhealeco.2011.05.005 OR 10.1016/j.joms.2018.07.010
10.1016/j.joms.2018.07.010 OR 10.1016/j.juro.2017.11.039 OR 10.1016/j.sapharm.2011.06.003 OR 10.1016/j.sapharm.2013.01.004 OR 10.1016/j.socscimed.2011.03.047 OR 10.1016/j.socscimed.2012.07.028 OR 10.1016/j.socscimed.2013.06.018 OR 10.1016/j.socscimed.2015.08.001 OR 10.1080/03630242.2012.674092 OR 10.1080/03630242.2012.674092 OR 10.1097/01.anes.0000264766.41297.ce OR 10.1097/01.aog.0000231720.64403.6f OR 10.1097/acm.0000000000001250 OR 10.1097/acm.0000000000001283 OR 10.1097/acm.0b013e3182a71519 OR 10.1097/ALN.0000000000000834 OR 10.1097/aog.0000000000002420 OR 10.1097/hmr.0000000000000069 OR 10.1097/MLR.0000000000000310 OR 10.1097/mlr.0b013e318268ac0c OR 10.1097/mpg.0000000000000637 OR 10.1097/sla.0000000000002920 OR 10.1097/sla.0000000000002928 OR 10.1111/1475-6773.13120 OR 10.1111/acem.13694 OR 10.1111/caje.12334 OR 10.1111/ceo.13523 OR 10.1111/j.1442-9071.2007.01480.x OR 10.1111/j.1572-0241.2008.01976.x OR 10.1111/j.1572-0241.2008.01988.x OR 10.1136/bmj.i2923 OR 10.1136/bmj.l1510 OR 10.1136/bmj.l2089 OR 10.1136/bmjopen-2018-023811 OR 10.1136/postgradmedj-2016-134094 OR 10.1177/0046958017709688 OR 10.1177/0950017015590760 OR 10.1177/1077558715589705 OR 10.1177/1077558718754573 OR 10.1177/1203475418762719
10.1186/1471-2296-13-94 OR 10.1186/1478-4491-12-32 OR 10.1186/s12913-017-2343-8 OR 10.1186/s12960-016-0162-3 OR 10.1186/s12960-017-0258-4 OR 10.1186/s13054-018-2139-1 OR 10.1186/s40697-016-0117-6 OR 10.1245/s10434-018-6450-5 OR 10.1371/journal.pone.0129197 OR 10.1377/hlthaff.2010.0597 OR 10.1377/hlthaff.2017.0014 OR 10.1513/annalsats.201804-252ar OR 10.2106/jbjs.17.00532 OR 10.2106/JBJS.17.00532 OR 10.2106/jbjs.17.01501 OR 10.2214/AJR.17.18256
Map
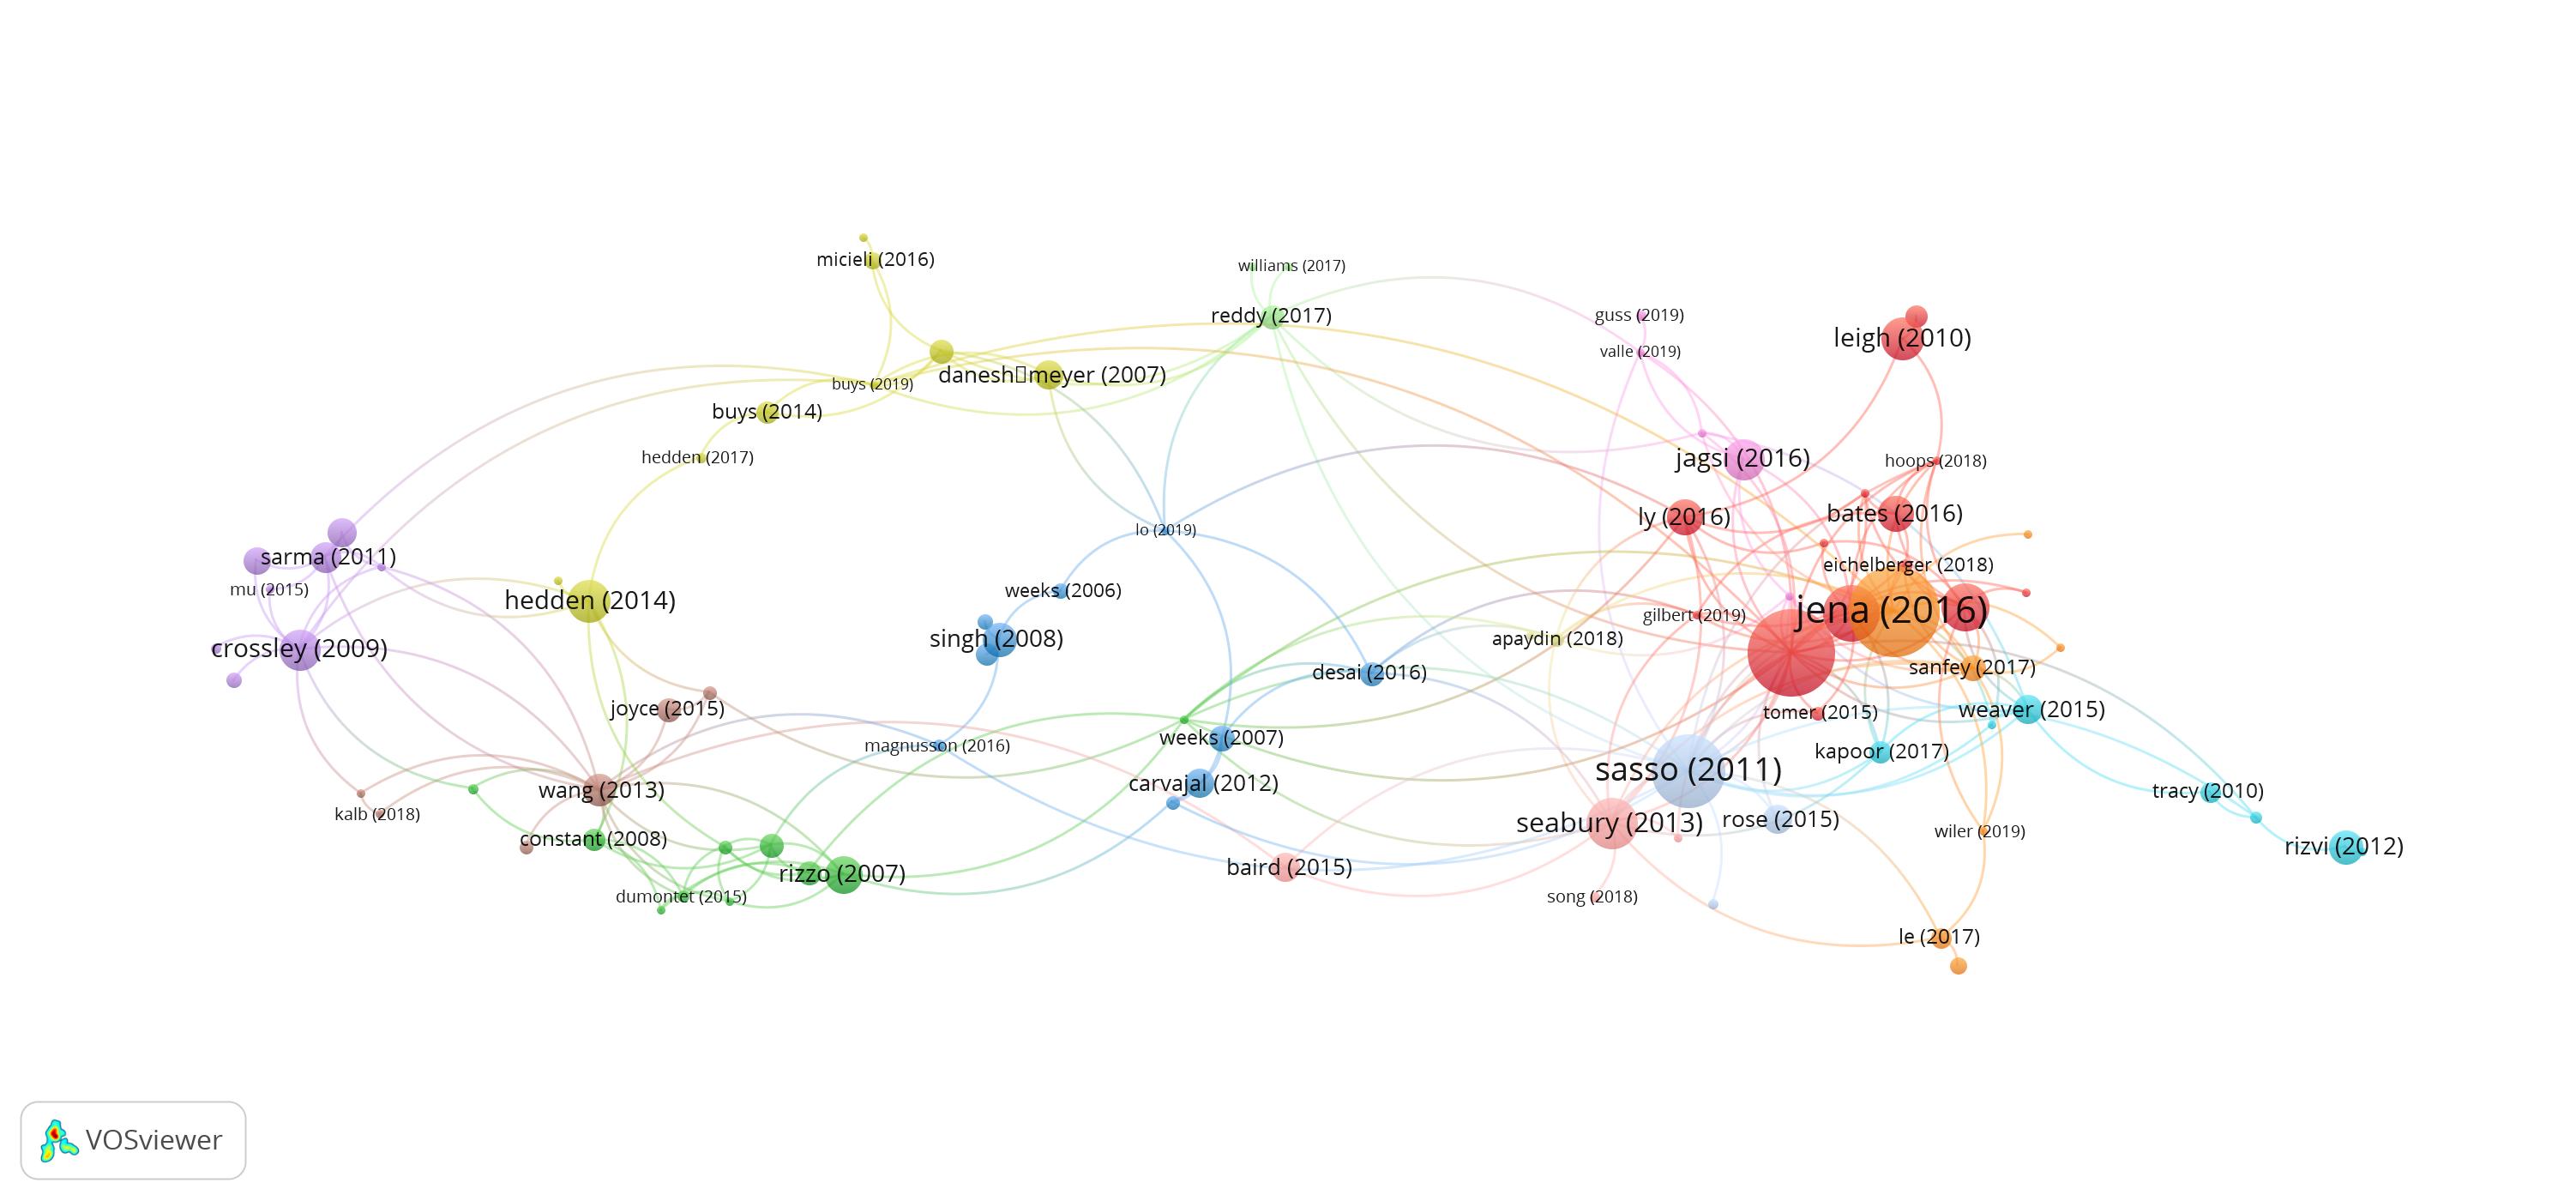
Figure 21.
Techniques
Collecting DOIs and Mapping
While collecting articles to meet a research request, Zotero offers several powerful tools for capturing accurate metadata. However, the most effective tool for managing DOIs is the Zotero DOI Manager. After the plugin is installed, make sure to change the setting for DOIs under Tools > Get DOIs for new items > Long DOIs.
To easily extract DOIs ingested into Zotero, select all of the items you wish to export, and choose the CSV format. This will create a file you can open in Excel or other spreadsheet software with a column of all of the DOIs from your selection.
Figure 22.
Dimensions allows you to search for articles by DOI and supports Boolean operators. However, the search starts to return inconsistent results after a search for about 45 DOIs. The search is also extremely sensitive to extra spaces or any small errors in forming the Boolean search string of DOI’s. To ease the creation of these long DOI search strings, I created a tool to create 40 DOI long perfect Boolean search strings for Dimensions. You can create a copy of this tool here: https://docs.google.com/spreadsheets/d/1f73EmJ-fhRnrDtHNCpl04tVBtLH_i5CGqP70QkQwM_w/edit?usp=sharing.
A map based on DOI’s is a pre-selected group of ‘Key Papers” exported along with their citations. If you have both the time and the justification, you can also apply the technique found in ‘Key Papers & Citations.” For a collection of 90 papers as in the example map, this is rarely justified.
Jump to Clusters
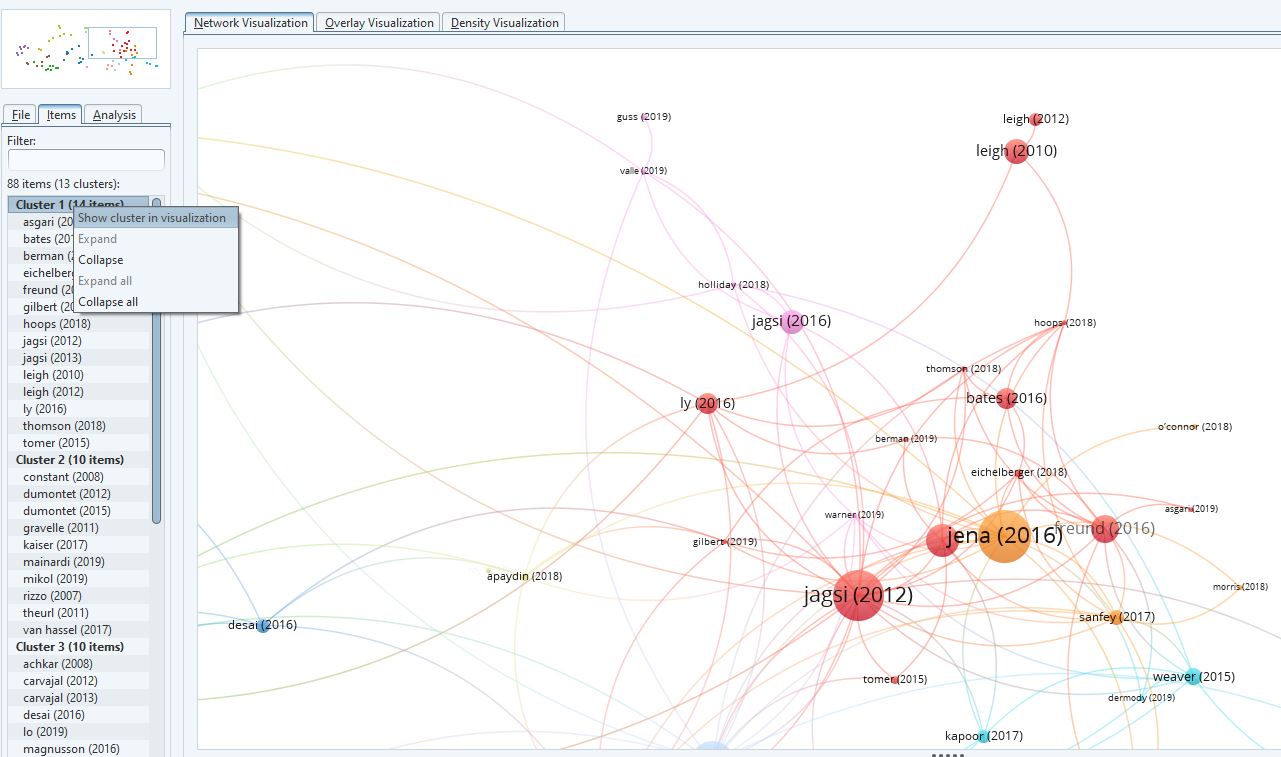
As the majority of the articles have already been collected as relevant articles, the most effective use of these maps is to very carefully look at newer and less cited articles in the clusters. In the ‘Items’ tab, right click on the cluster and choose “Show cluster in visualization.” This will jump you directly to the cluster.
Figure 23.
Using the mouse tooltip to highlight the Jagsi(2012) article results in five articles not included in the initial list of DOI’s already identified as key articles, including an update of the Jagsi(2012) article in 2013 and a specialized focus article on cardiologists, Jagsi(2016).

Figure 26.
5. List of Authors (Google Sheets Tool)
Tools
- Zotero
- DimensionVOSviewer Tools spreadsheet under “AuthorList”
- Dimensions
- VOSViewer
Example Search
Map

Figure 24.
Techniques
Clusters & Networks of Citations
In the general set of topics that have been used as examples in this paper, most of them have come from authors that publish in multiple areas. Sometimes it is useful to get a comprehensive view of what an author or cluster of authors have published in a selected area.
The example map above is a raw export of four authors who have published in the general area of burnout among physicians. However, most of these authors are also specialist physicians. The crossover between the clinical work of a specialist and their work on physician issues is not always obvious, and mapping their work provides an easy way to get a general overview of both aspects of their work.
The largest section of the above map that mostly refers to physician burnout is the large right hand cluster.
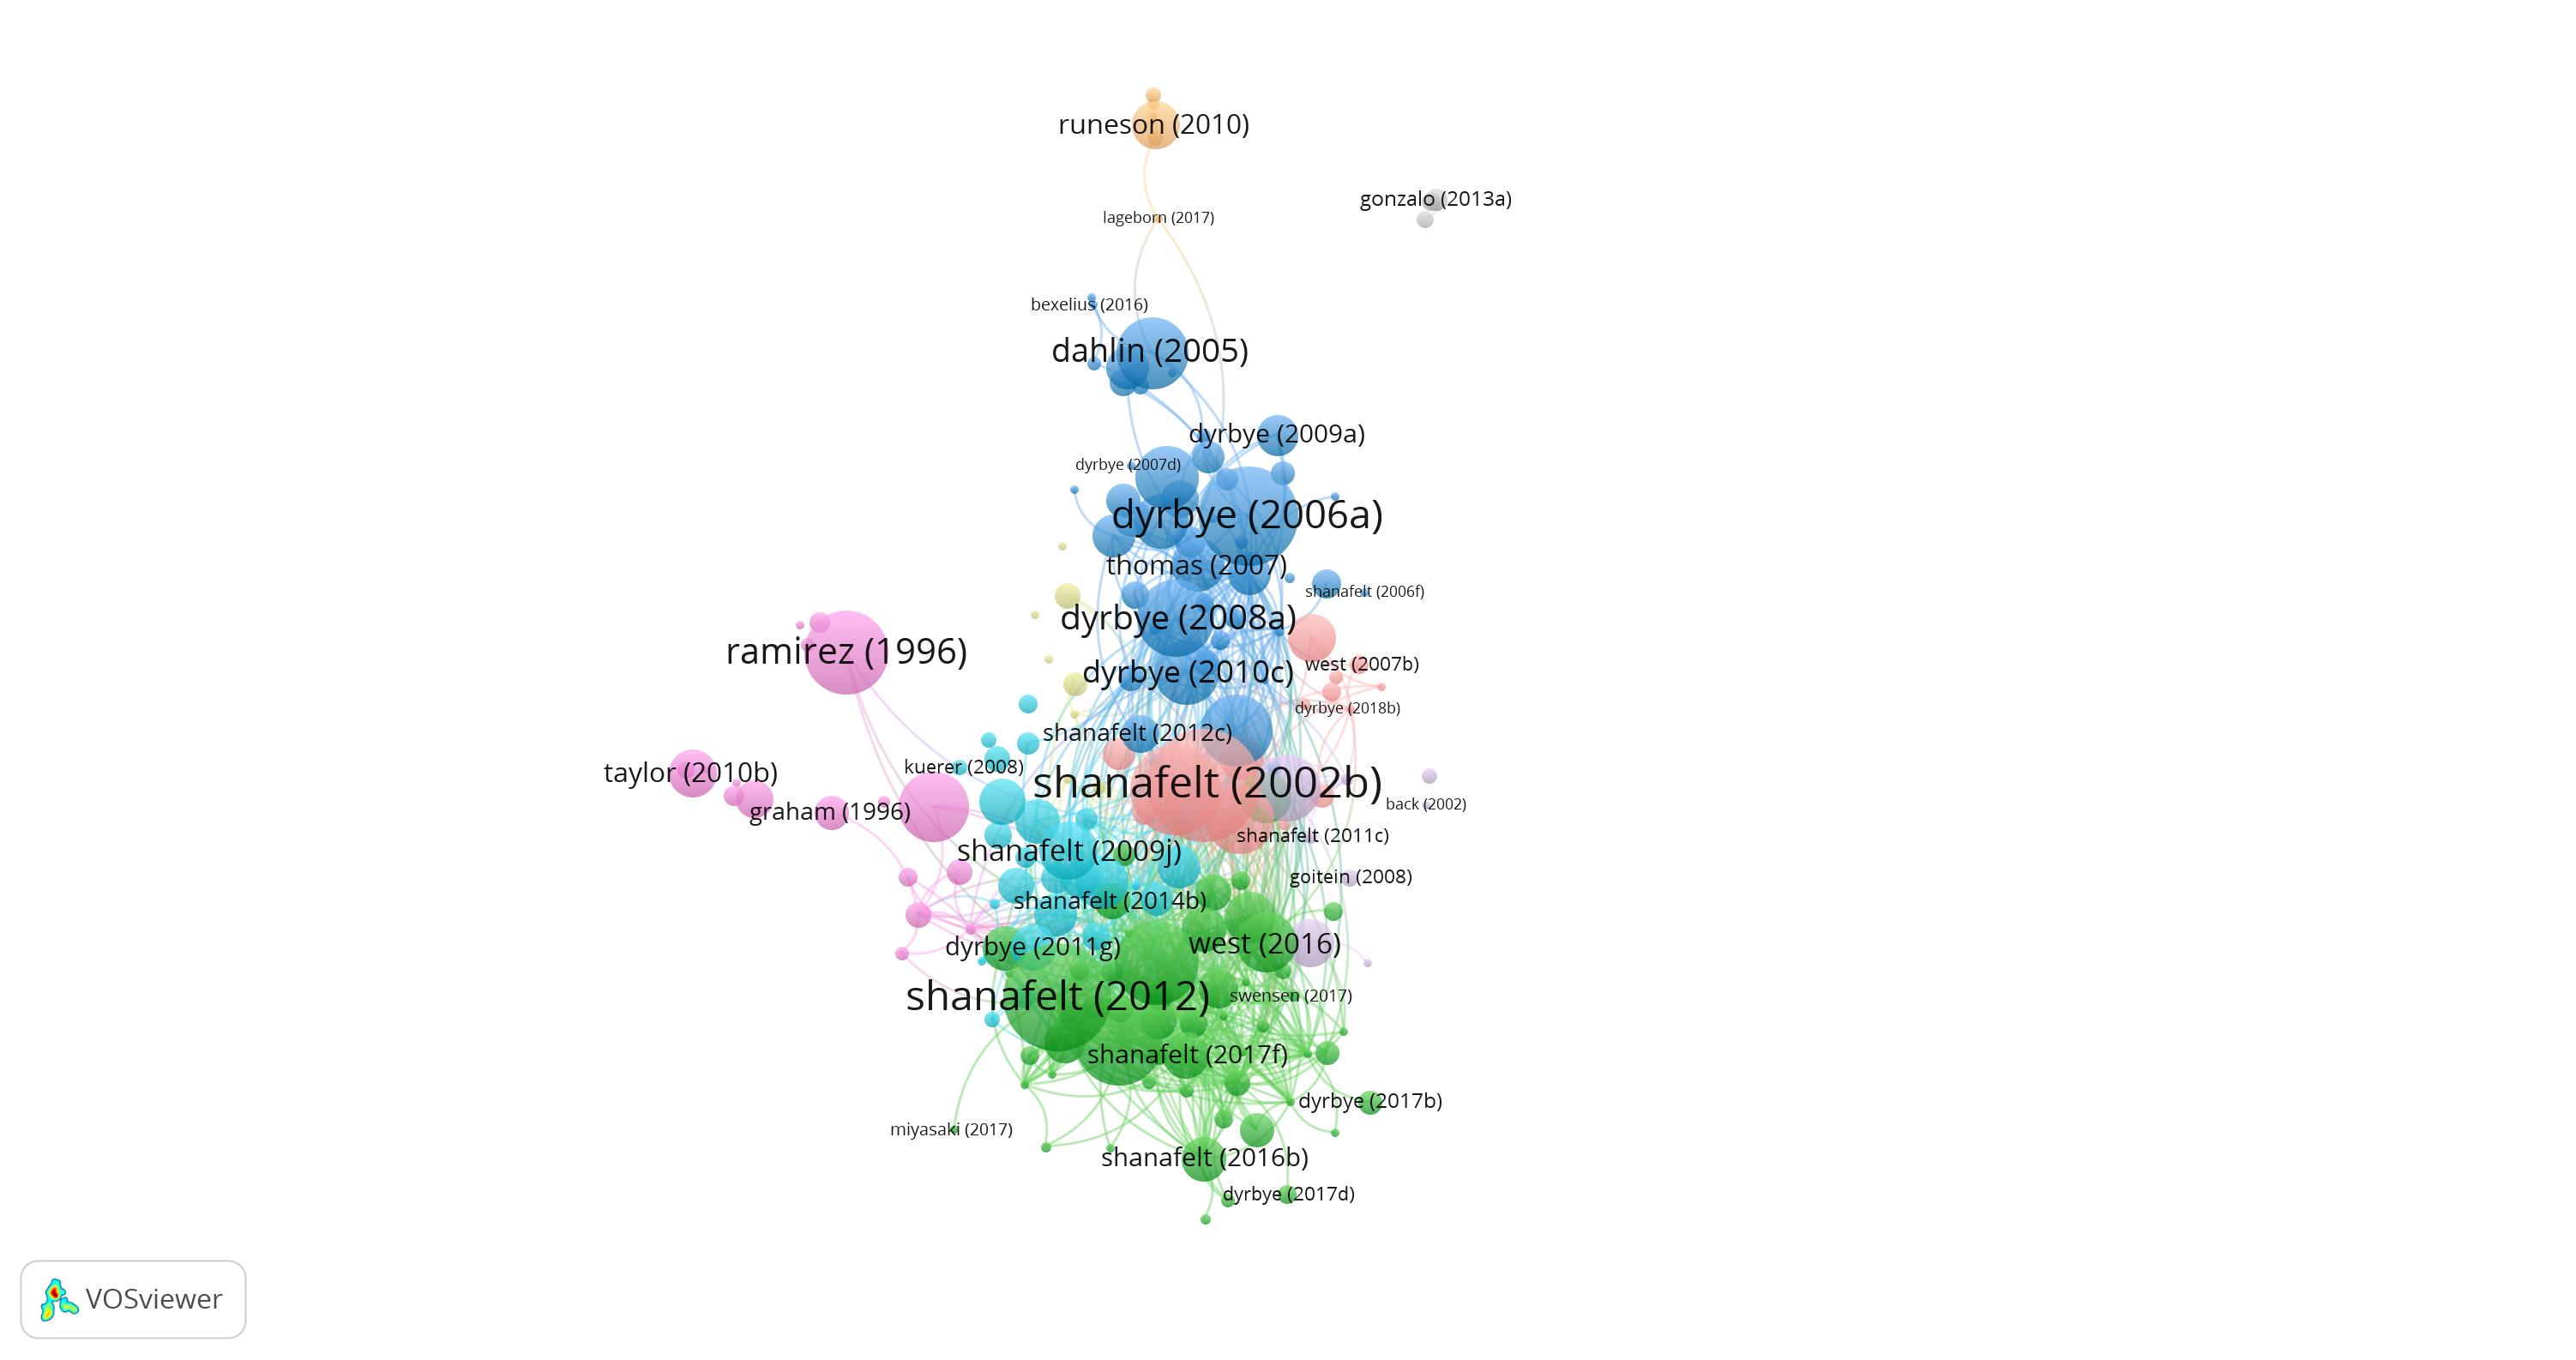
Figure 25.
The Tait Shanafelt (Stanford) and Lisolette Dyrbye (Mayo Clinic) papers in the (roughly) green/light blue and dark blue clusters above are all generally about burnout among physicians and are all generally based on samples in the United States.
Search against selected authors
The search link above is a search created by taking the author search created with the AuthorList tool and then doing a keyword search against it. This can be a particularly powerful tool when a reference interview identifies a large number of important authors. This technique is similar to the Key Authors search detailed above, but allows a much larger number of authors to be searched.
The pre-filtering involved in identifying important authors creates dense, highly connected maps and works best in getting a comprehensive view of an author’s complete publication history on a specific topic.
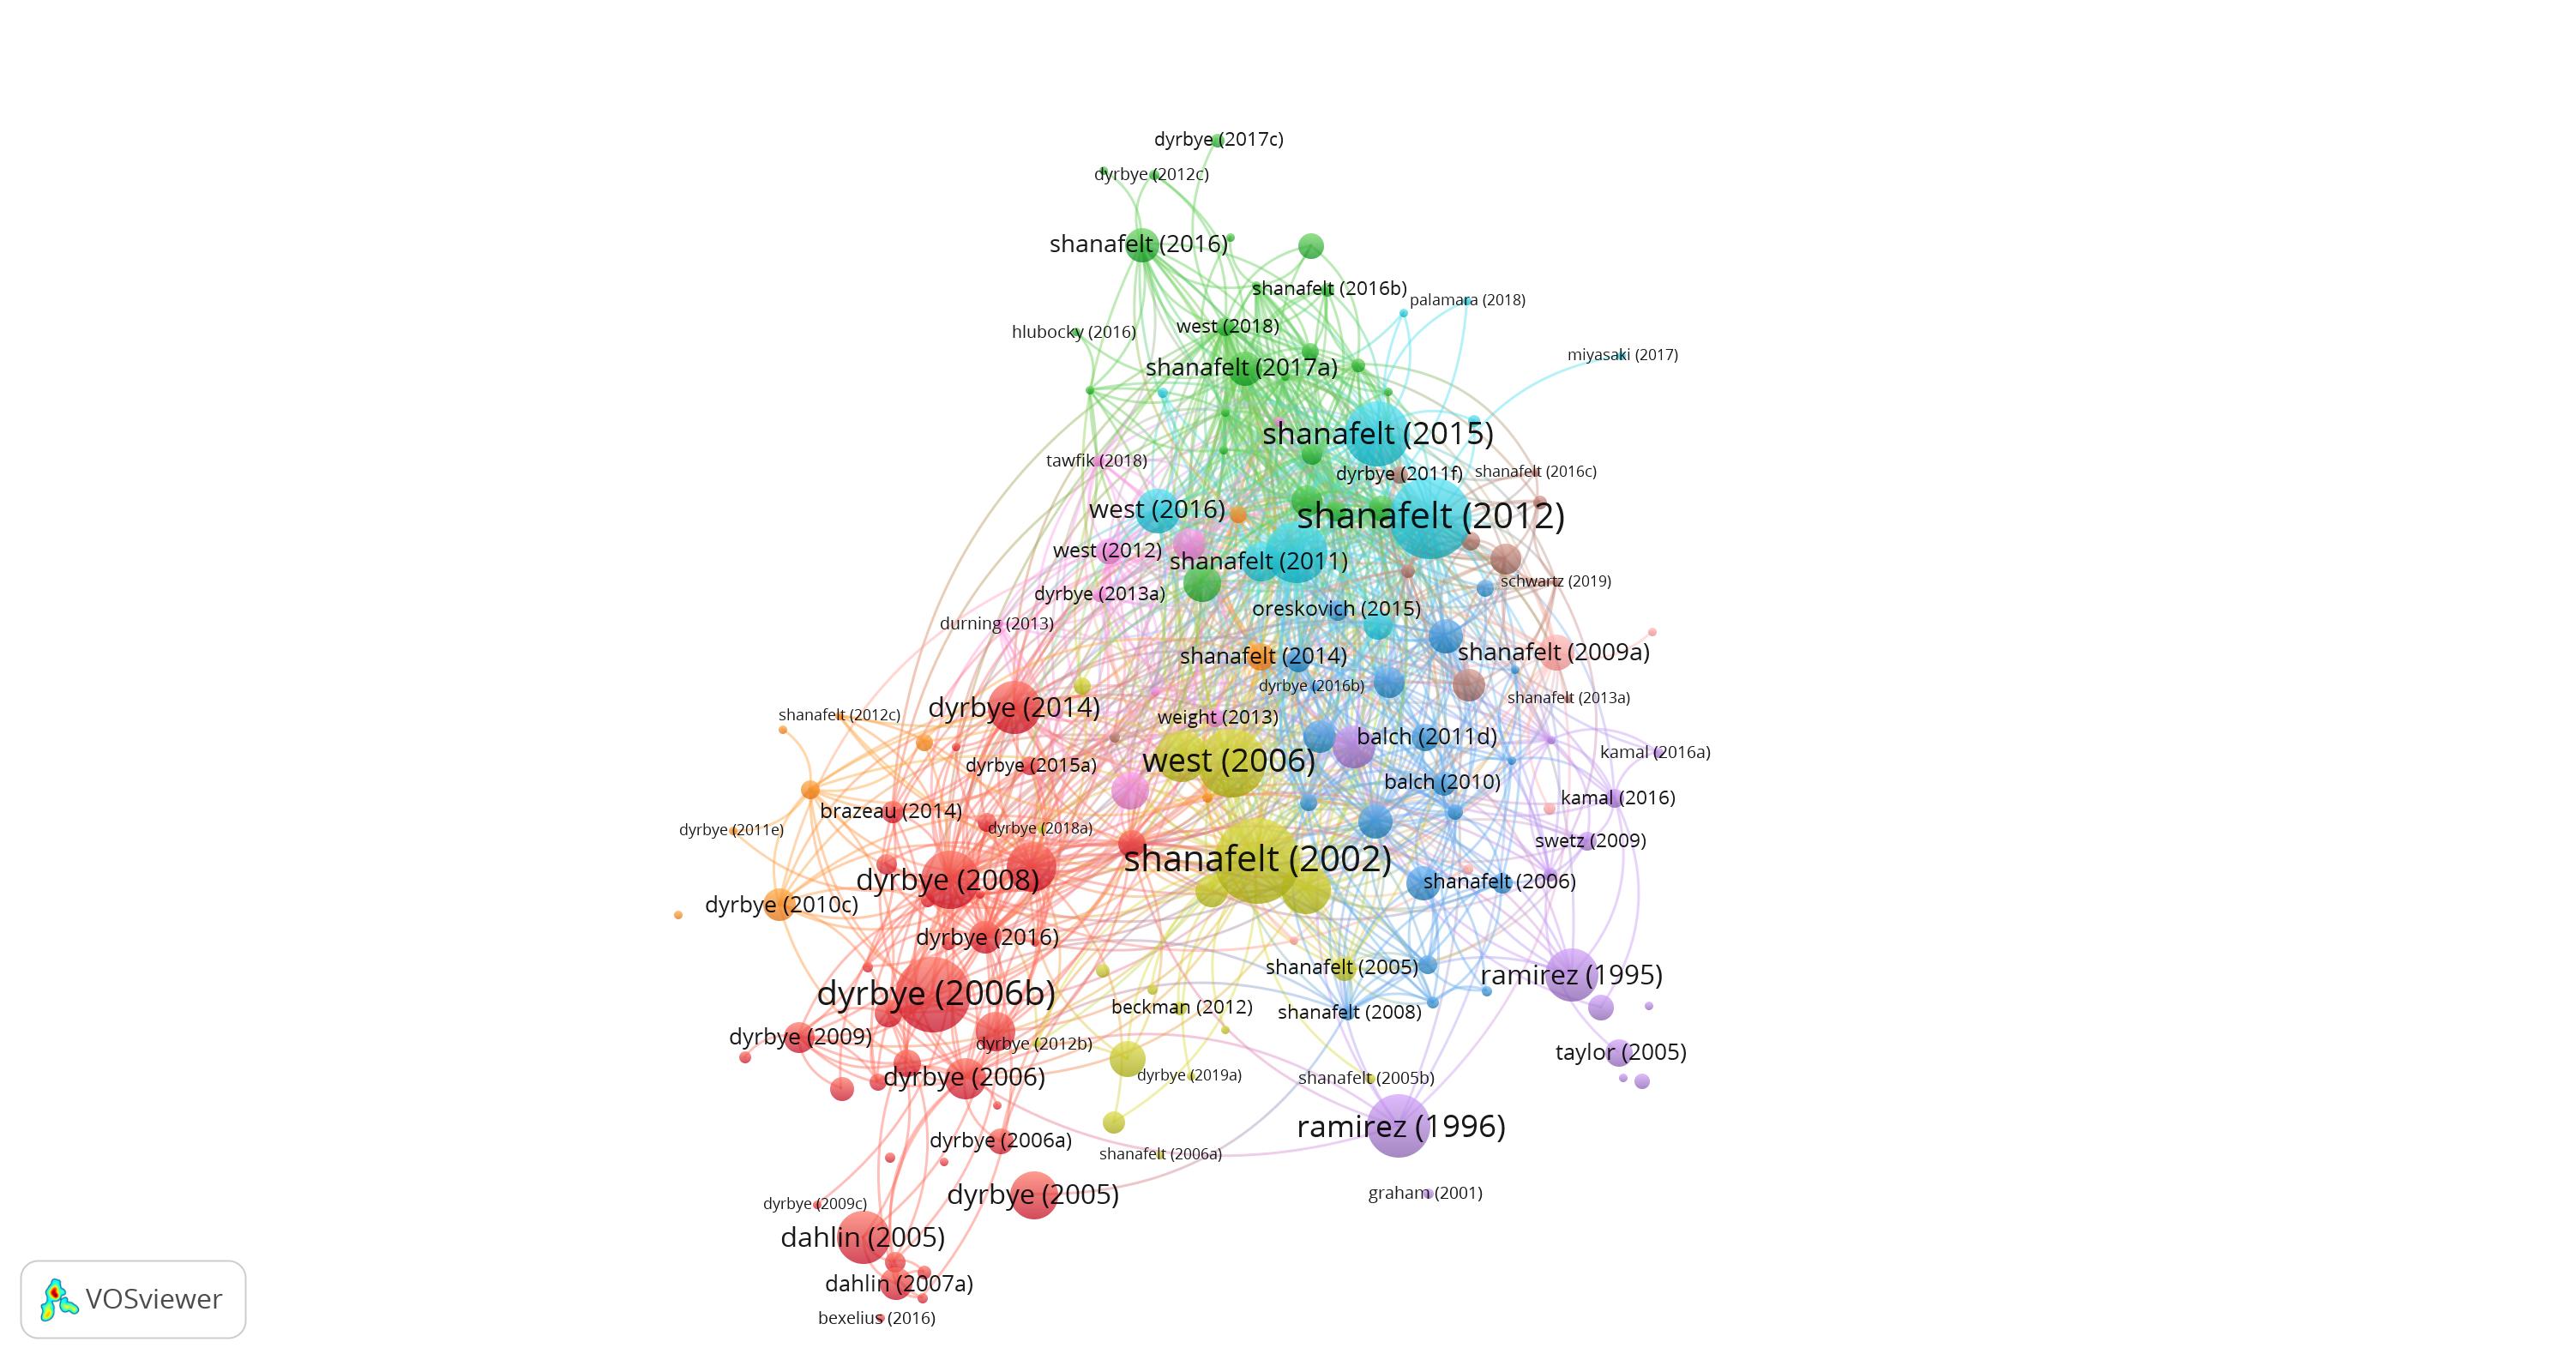
Figure 26.
Practical Integration in the Reference Interview
When working directly with patrons during a reference interview I have found that the most effective maps are the Advanced Boolean Search and Key Papers and Citations maps. Graduate students and PhD’s seem to immediately grasp the idea of mapping a search (Advanced Boolean Search) and mapping references and citations. The diagram of the two point-to-point triangles (see figure 16) is particularly effective in illustrating how the VOSViewer map works.
The time necessary to create the Key Papers and Citations map makes it less effective than the speed in which a properly set up Advanced Boolean Search map can be spun up.
List of Papers by DOI, List of Authors and Key Authors searches work best on followup.
Bibliography
[1] van Eck N, Waltman L. 2009. Software survey: VOSviewer, a computer program for bibliometric mapping. Scientometrics. 84(2):523–538. doi:10/cx2w6z. [accessed 2019 May 13]. https://akademiai.com/doi/abs/10.1007/s11192-009-0146-3.
[2] van Eck NJ, Waltman L. 2007. VOS: A New Method for Visualizing Similarities Between Objects. In: Decker R, Lenz H-J, editors. Advances in Data Analysis. Berlin, Heidelberg: Springer Berlin Heidelberg. p. 299–306. [accessed 2019 May 13]. http://link.springer.com/10.1007/978-3-540-70981-7_34.
[3] Corrall S, Kennan MA, Afzal W. 2013. Bibliometrics and Research Data Management Services: Emerging Trends in Library Support for Research. Libr Trends. 61(3):636–674. doi:10/f4zzh4. [accessed 2019 May 13]. https://muse.jhu.edu/article/508619.
[4] Shachaf P, Shaw D. 2008. Bibliometric analysis to identify core reference sources of virtual reference transactions. Libr Inf Sci Res. 30(4):291–297. doi:10/frdmmf. [accessed 2019 May 13]. https://linkinghub.elsevier.com/retrieve/pii/S0740818808000741.
[5] Zahedi Z, Van ENJP, CWTS, CWTS. 2015. Identifying topics of interest of Mendeley users using the text mining and overlay visualization functionality of VOS viewer. 20th International Conference in Science & Technology Indicators, 2-4, September, 2015, Lugano, Switzerland. Httpwwwsti2015usichposter-Sess. [accessed 2019 May 13]. https://openaccess.leidenuniv.nl/handle/1887/48264.
[6] Thelwall M. 2018. Dimensions: A competitor to Scopus and the Web of Science? J Informetr. 12(2):430–435. doi:10/gdqwvj. [accessed 2019 May 13]. http://www.sciencedirect.com/science/article/pii/S175115771830066X.
[7] Harzing A-W. 2019 May 8. Two new kids on the block: How do Crossref and Dimensions compare with Google Scholar, Microsoft Academic, Scopus and the Web of Science? Scientometrics. doi:10/gf24xf. [accessed 2019 May 13]. http://link.springer.com/10.1007/s11192-019-03114-y.
About the Author
Brett Williams (@brettlwilliams, brett.l.williams+C4L@gmail.com) is a Senior Research Analyst at the Ontario Medical Association in Toronto, Ontario where he acts as the Systems Librarian and a Reference and Instruction Librarian. He has been been munging library metadata since he first learned how to do an =IMPORTXML() in Google Sheets shortly after graduating from library school at McGill University in 2008.









Subscribe to comments: For this article | For all articles
Leave a Reply