by Christopher Brousseau, Justin Johnson, Curtis Thacker
Introduction
In 2019 Whitchurch and Merrill published a qualitative analysis of chat transcripts between librarians and patrons of Brigham Young University’s Harold B. Lee Library (Whitchurch and Merrill, 2019). Their dataset was created by coding 4,475 chat transcripts recorded during 2016. They coded into 25 categories – described below. Using this dataset, the BYU Library attempted to create a machine learning model that will programmatically code a chat transcript. Using the resulting model, we hope to programmatically code about 9 years or 70K additional transcripts. This larger dataset would allow for analysis of trends over time.
Background
Background on Machine Learning
“Machine Learning is the study of computer algorithms that improve automatically through experience” (Mitchell, 1997). A machine learning model is an algorithm that uses patterns in data and previous examples to learn to perform a task. Detecting a cat in an image and predicting how much a 3,000 square-foot house in Boston will be worth in 2025 are examples of tasks that can be performed by using machine learning.
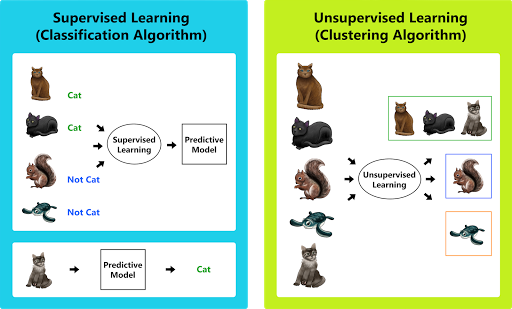
Figure 1. Supervised Learning (Classification/Regression) | Unsupervised Learning (Clustering)
There are two basic paradigms for machine learning models (hereafter called models), supervised and unsupervised learning. A supervised learning model uses patterns found in example data to find relationships between inputs and outputs such as whether a cat appears in a given picture. Unsupervised learning algorithms are used in pattern detection and descriptive modeling tasks.
Background on Text Classification
For our experiment, there are two tasks to accomplish, sentiment analysis and classification. Sentiment analysis is a classic Natural Language Processing (NLP) task which tries to predict the overall positivity or negativity of a statement or utterance. Our experiment required us to use text to provide a variety of labels for a block of natural language text.
NLP is a broad field in machine learning, spanning from text processing to speech recognition. One of the main focuses and most common tasks of NLP is creating what are called language models. Language models are essentially large records of computer-generated rules pertaining to a language, and there are many different types of language models. In order to minimize the amount of time it takes to train but maximize the accuracy and learning rate, we’ve opted to use a pre-trained language model for our task, and fine-tune or adapt it to our specific dataset. BERT (Devlin, 2019) is a sophisticated unsupervised machine-learned language model created by Google. Its purpose is to take natural language in plain text and represent it as a sequence of numbers that capture the nuance and meaning of the language. Doing this enables the creation of other models that perform tasks like sentiment analysis and translation. For all the tasks described in this paper, we used DilBERT (Sanh, 2020), a smaller version of BERT that doesn’t sacrifice accuracy or efficiency.
Other very common tasks in NLP are text processing, part-of-speech tagging, tokenization, and sentiment analysis; our model uses all of them except for part-of-speech tagging. Text processing or pre-processing involves cleaning data so that it can be used without introducing any unnecessary bias into the results. For example, in our dataset all of the customer interactions originally contain IP addresses and other personal data that isn’t relevant to the task we’re trying to complete. We don’t want to introduce bias into the results that we aren’t prepared to deal with like the idea that only a certain IP address ever asks questions about certain topics. Tokenization is the act of splitting up a text by tokens, in our case individual words. In other cases, those tokens could be morphemes or prefixes/infixes/suffixes, etc. Some language models are based on tokenization, such as the Bag of Words statistical model, which counts each unique token in order to draw important conclusions from the text. Others, while likewise based on tokenization, do not use only tokenization to draw conclusions, like the Term Frequency-Inverse Document Frequency model, which deems words that appear fewer times as being more important, but it’s safe to assume that where a language model exists, some form of tokenization is done. We did not use part-of-speech tagging in our model but it is often used to introduce bias for grammatical structure into language models, usually for models where grammar and syntax are important for accurate results, such as those models used for translation or summarization of text.
Back to the first task we completed, sentiment analysis combines several of the NLP methods above in order to get results. It’s a corpus-based method, meaning that it’s either needed to make our own corpus of “known” words or to piggy-back off of an already created corpus. In our case, we used both methods. We utilized BERT’s pre-trained word embeddings as the base of our corpus, and during fine-tuning whenever we came across a new word that wasn’t in the current corpus, we added a new entry to represent that word. These entries in the corpus are represented by vectors. The vectors, or word embeddings, take into account how frequently the word shows up, but are also based the word’s placement in a sentence along with its perceived semantic meaning. All of these are taken into account for determining the overall positivity/negativity of a given word. Once we have those vectors, to analyze sentiment, we add up each individual word’s “score.” From there, we determine how positive/negative the whole utterance is. We aren’t analyzing straight sentiment, although our model has learned to consider the overall sentiment of a chat as a statistically significant factor in determining the satisfaction of the patron.
Our second task is Classification which is predicting which of two or more categories (or classes) a given input fits into. For the related task of Binary Classification, prediction is limited to just two classes such as true or false, cat or dog, black or white, dead or alive, etc. We’ve opted for much more of a black-box model, as opposed to other more easily understandable models for classification. Instead of manually injecting bias by predetermining rules for the classification to follow, we allowed the language model BERT to follow its algorithm to “learn” how it should classify each input. This approach leaves us in a position where we will never be one hundred percent certain about everything that the model learned or which features it deemed especially important for determining the classifications it gives. The justification for this approach, even with what could be taken as a huge drawback is twofold:
1. As we previously stated, we do not want to inject any bias into the model that we aren’t prepared to deal with. That includes bias that we as researchers have about whether we ourselves would be satisfied with a particular interaction with librarians.
2. We have a dataset of human-labeled-and-verified examples, meaning that if our model gets a good score generalizing on that dataset, we are guaranteed a certain amount of confidence in its ability to generalize on data within this very limited space effectively.
An example: Say we were to analyze a chat starting with this question from a patron, “PATRON: When does the library close on Friday?” This question within our model will receive a neutral score, as it’s neither positively nor negatively worded. The remainder of the chat will determine the overall sentiment of said chat. If the librarian gives a polite and accurate answer, and the patron then says thank you at the end of the chat, the overall chat will be classified as weakly positive. If the librarian takes a long time to respond and ultimately gives inaccurate information, the model will still classify the chat as weakly positive if the patron at the end of the chat indicates that they are happy with the service. If they are unhappy with the service, and they indicate that at any point in the chat, it will be classified as negative.
Background on Library Chat
A review of the literature shows that libraries primarily improve their chat services in two ways: first, by making technological improvements to the service and second, by evaluating the service and improving it through training and support to library employees. A sentiment analysis tool would help in regard to the second method.
Evaluation of chat services is typically done using a qualitative analysis or evaluation of the chat service. This is done via a review of chat transcripts using an established rubric or dataset to evaluate all chats in the same manner. There are many publications that demonstrate the usefulness of this approach and describe the method of coding typically used for these evaluations. Of the studies reviewed, the following examples are included in more detail to show the methods used to evaluate chat. These evaluations are one review of the interactions based on established reference frameworks such as the ACRL framework (Hunter, 2019), and one study identifying answers through the evaluation of the questions being asked (Moore, 2017).
A 2009 study from the Library at the University of Guelph did an assessment of their virtual reference and instant messaging services by reviewing all transcripts from the past two years and categorizing them into five broad categories of the type of questions asked. The analysis was done by a team coding the interactions into categories that were directional, policy, ready reference, specific search, and research questions. In comparison, a study published in 2019 by a task force from Berkeley College reviewed 369 chats. They focused on coding chat interactions that were identified as needing research or writing help. The researchers analyzed each of the interactions according to the ACRL’s Framework for Information Literacy in Higher Education.
The examples included above show how libraries have typically conducted qualitative analysis of chat interactions by using teams or task forces of researchers using established rubrics and conducting coding of each transcript. These demonstrate the potential benefits that are available in creating a machine learning or sentiment analysis model to assist in this type of analysis. There has been some use of sentiment analysis within libraries already such as a study that evaluated LibQUAL+ surveys’ open-ended comments (Moore, 2017). In this LibQUAL+ study, the author created a sentiment model using manually-coded data for its dataset to identify positive and negative comments within the survey. He took 514 coded entries from five separate surveys to create a set of positive and negative word vectors for the open comment sections of the LibQUAL+ survey. He then ran the comments from those five surveys through his model to review the results. Expansion of work like this can be applied to other word-based interactions or transcripts such as chat. These are examples of how libraries can use an established dataset to create a qualitative analysis of chats through sentiment analysis.
Project Description
We performed supervised learning on 21 different tasks, one of which was fine-grained sentiment classification, the other 20 being binary classifications. We have synthesized, or used our model to create, some analyses similar in accuracy to Michael Whitchurch’s projects, but without needing human researchers. We analyzed and classified 77,000 chats in 21 hours. Whitchurch’s project analyzed 4475 chats with 3 people over the course of 1 year. This means that we analyzed 1720% of the project in 0.02% of the time, resulting in an almost 2000% increase in time efficiency. We specifically checked with Michael Whitchurch about presenting this number, and he agreed it was accurate considering the project and its circumstances. We expect this vast increase in speed to be valuable to anyone who would like to implement this project for themselves.
Our experiment makes use of three python code libraries: Pytorch (https://pytorch.org/), Transformers (https://huggingface.co/transformers/), and FastAI (https://docs.fast.ai/). We used the Transformers library to access DilBERT from HuggingFace. Using Transformers version 2.5.0, we have easy access to the three portions of the model we need most: the pre-trained model, tokenizer, and configuration. The DilBERT model has a maximum input sequence length of 512, which isn’t immediately compatible with FastAI’s architecture, which is built more for working with a Recurrent Neural Network (RNN) than a transformer model. Beyond that, it’s much shorter than many of the chats we were attempting to analyze. We had to implement a custom wrapper for the tokenizer to normalize the input and the max sequence length. This allowed us to make our model as flexible as possible.
In order to get our model to correctly process our data, we needed to first preprocess the text, then create a way to load it into the model. To properly load our data into the model, we rely on the FastAI DataBunch API, which gives us an easy way to not only load the data but also shuffle and test it without requiring too much configuration. You’ll remember from the brief explanation of APIs that they define standards for input and output for different types of data, and one of the reasons why this DataBunch API is helpful for us, is that it accepts so many different types of data, and presents the same types of output, meaning that our model is very flexible as to what types of data and what formats it can work with.
Based on this excerpt, https://github.com/huggingface/transformers#models-always-output-tuples (HuggingFace 2020), the creators of the models state that all of their Pytorch-based transformer models output tuples with some variation between all models. Because a goal of ours is flexibility between models, we don’t consider those variations especially helpful, and adjusting our whole architecture for each and every possible model would not be useful for our purposes. With this in mind, we created another custom wrapper that funnels the output to only the most important probabilities for our results (logits), no matter which pretrained transformer model we choose to put through it.
In the last part of the setup, you’ll remember that we are working with the 21 data categories defined in Michael Whitchurch’s experiment. Some of these are binary classification, while others are multiclass, meaning that for testing, we need to be able to seamlessly transition between the two tasks. Thanks to Transformers, we have easy access to these features in the form of the config for each model.
The model is now set up correctly. Because of all of the work we put into custom wrappers, our program works not only with DilBERT, but also BERT, RoBERTA, and XLNet (all large pre-trained language models). We are training on the data collected and labeled by Michael Whitchurch and predicting all of the same categories. We are using AdamW as an optimizer, and again FastAI allows us to bundle our model up nicely with the Learner API.
FastAI allows us to visualize our data immediately and easily after every epoch. To analyze the results, ClassificationInterpretation is a useful API to implement, allowing you to generate confusion matrices quickly and effectively. After that, we are able to predict any of the classes we trained on in our model, along with saving our model to use within larger systems and output our predictions as files. Saving the model is especially important, as it significantly reduces prediction time, as we don’t need to retrain anything.
Dataset
Our dataset consists of 4476 chats collected in 2016. This data was collected through the Harold B. Lee library’s chat system and analyzed by Michael Whitchurch’s team and detailed in his publication. It contains 21 categories of questions that Whitchurch found to be useful in determining a couple of things: are patrons generally being satisfied by the chat experience, and how do trained library professionals compare to students when interacting meaningfully through the chat. We extended the first of these questions to our project, utilizing the same categories present in the original. The data originally came in an unusable format for our model. In order to clean it up, we first replaced all personal information that came with the chats to protect our users’ privacy. Now, instead of displaying StudentID@IPAddress: and LibraryID@IPAddress:, it displays PATRON and LIBRARY. The next step in cleaning was replacing all of the text answers for the categories with numbers, so instead of TRUE or FALSE, it was 1 or 0. Once our data was cleaned, we were ready to begin training and testing. Something worth noting is that despite all of the effort put into cleaning the dataset, there were still several biases that inhibited the model from performing at what we would call a “perfect level,” all of which have already been discussed earlier.
Here’s a breakdown of the data on question types and how they are portioned throughout the entire experiment:
Table 1. Question Type Breakdown
| Question Type | Total | Percentage |
| Research/Reference | 2936 | 65.6% |
| Policy/Procedure | 124 | 20.4% |
| Tech/Troubles | 397 | 8.9% |
| Directional | 314 | 2.8% |
Lastly, here’s a breakdown of each of the 21 categories tested in detail:
Table 2. Category Breakdown
| Label | Scale | Meaning | |
| 1 | Patron Satisfaction | 1-5 | Overall satisfaction of the patron |
| 2 | Unanswered | True/False | Whether or not a librarian or student answered the chat |
| 3 | Check Original Chat | True/False | Whether a given chat was the original contact, or if another chat needed to be referenced |
| 4 | Premature exit | True/False | Whether the patron left before the question was answered |
| 5 | Cite source(s) | True/False | Whether a patron was citing a source from the library |
| 6 | Guided to source | True/False | Whether the patron was successfully guided to the source |
| 7 | No source | True/False | Whether the source actually existed at the library |
| 8 | Unnecessary | True/False | Whether the source citation was actually necessary |
| 9 | Research/Reference | True/False | Question type – Research question |
| 10 | Directional | True/False | Question type – Directions to something on campus/in the library |
| 11 | Tech/Troubleshooting | True/False | Question type – Help with using or debugging technology |
| 12 | Policy/Procedure | True/False | Question type – Help understanding what the rules are and why they’re in place |
| 13 | Inappropriate | True/False | Whether the patron behaved inappropriately or used the chat for an unintended purpose |
| 14 | Student-to-student | True/False | Whether the patron (a student) was connected to a student employee through the chat |
| 15 | Greeting | True/False | Whether a greeting was expressed at the beginning of the chat |
| 16 | Follow-up | True/False | Whether any follow-up is required based on the chat |
| 17 | Closing | True/False | Whether a closing statement (e.g. Bye) was expressed at the end of the chat. |
| 18 | Campus question | True/False | Whether a question is about a campus schedule or activity |
| 19 | Perceived inaccurate | True/False | Whether the answer given by the librarian is completely accurate |
| 20 | Perceived incomplete | True/False | Whether the question needed more information than answer given by the librarian contained |
| 21 | Employee Inappropriate | True/False | Whether at any time the employee behaved inappropriately during the chat, or if they used the chat outside of its intended purpose |
Results
Our project was largely a success, and we expect that anyone who implements this model will experience the same significant margin of improvement over more traditional methods of analysis. This project was very useful for our purpose, which in this case was providing a means for quick and accurate analysis of customer interactions. This analysis provides a bunch of meaningful data for a variety of purposes including employee training and HR management, customer satisfaction and quality assurance, and overall efficiency. This data can be used as the basis for a custom chatbot specific to a company’s data and market, or as a helpful start to building better-customized training for employees. Its main usage, however, is beginning a library’s journey towards analyzing their patron chat interactions.
In building a custom dataset for fine-tuning on your own data, at least a couple thousand examples of labeled data are needed, be those chats, reviews, or just general email interactions. Our model accepts CSV, XLSX, or TSV formats. You should only have to run through training one time to get accuracy in the high 80’s or low 90’s with a good dataset.
Table 3. Satisfaction confusion matrix X – Predicted Y – Actual
| Dissatisfied/Frustrated | Neither | Satisfied | Above and Beyond | |
| Dissatisfied | ~2% | <1% | <1% | 0% |
| Neither | 0% | 8% | 4% | 0% |
| Satisfied | 0% | ~2% | 82% | 0% |
| A&B | 0% | 0% | <1% | ~2% |
Table 4. Employee Appropriateness confusion matrix X – Predicted Y – Actual
| Appropriate | Inappropriate | |
| Appropriate | 100% | 0% |
| Inappropriate | 0% | 0% |
Table 5. Training data for Satisfaction
| Epoch | Training Loss | Validation Loss | Accuracy | Error Rate | Time Elapsed |
| 0 | 0.357155 | 0.375009 | 0.891374 | 0.108626 | 00:39 |
| 1 | 0.320672 | 0.391226 | 0.891374 | 0.108626 | 00:41 |
| 2 | 0.232104 | 0.412163 | 0.900958 | 0.099042 | 00:37 |
Table 6. Category BreakdownTraining data for Employee Appropriateness
| Epoch | Training Loss | Validation Loss | Accuracy | Error Rate | Time Elapsed |
| 0 | 0.000000 | 0.000000 | 1.0 | 0.000000 | 00:25 |
| 1 | 0.000000 | 0.000000 | 1.0 | 0.000000 | 00:29 |
| 2 | 0.000000 | 0.000000 | 1.0 | 0.000000 | 00:23 |
With the results, we can look at trends over the last few years based on the criteria we used. We can identify potential issues based on the results and use these for the purpose of evaluation or improved training. Being able to fine tune the results can also help in identifying some of the underlying issues that might be present in the service being provided. Fixing these issues is an opportunity to improve a service by understanding better how the interactions have progressed. An example of this is using the satisfaction rating to see if there have been any trends in our ratings in chat interactions and identify potential issues that might be present within the service being provided. Looking at graph 1, you can see that our number of satisfied chats have been decreasing the last three years. While our total number of chats have decreased as well, this alone does not account for the decrease. Comparing ‘Neither’ and ‘Dissatisfied’, we can see that these two categories have stayed roughly the same across the three years. In comparison, the ‘Satisfied’ category is seeing a marked decrease. Identifying this trend can help in finding areas for improvement in our chat services. This can be done through improvements to the service and to training of the employees who handle all the chat interactions. With the results available we can spot the trends and do more in-depth analysis to improve our service.
Two other categories we can look at for potential value are the unanswered group and the wait time. Using these results, we can track how long it is taking for chats to be answered and identify the number that go unanswered. These are areas we can achieve focused improvement through training by working to answer chats and make sure that they do not go unanswered more quickly. For example, in 2018 we had 1422 chats have a wait time of 1 minute or longer and had 739 go unanswered. These are areas we need to focus on in conducting training with employees to address these issues. We can provide better customer service and these results give us the opportunity to establish reliable benchmarks that we can track and use in annual evaluations and in developing focused training.
These are just examples of some of the benefits available within the results we were able to get from the text classification model we developed for our chat interactions.
Conclusion
Having started out with an initial dataset and a goal to programmatically implement an analysis based on the dataset, the BYU library was able to create a sentiment analysis chat tool. The tool gave us the ability to quickly and accurately analyze all saved library chat transcripts based on the initial dataset created by Michael Whitchurch. The data obtained was highly accurate and useful for the purpose of analyzing the chat interactions. So, while we accomplished our stated goal, further development and growth is needed. First, expansion of the dataset to eliminate or correct any bias is needed. This will help to refine the results and improve accuracy. Expansion of the dataset will also help in better tuning the chat analysis tool to meet the needs of supervisors in evaluating chat interactions. Second, working with library staff to identify how best to use the tool and what role it will play in chat analysis and evaluation in the future. This is an equally important step, and it will help provide direction for future development and show how best to use the tool. For example, while our current dataset can give some good baselines on evaluating chat interactions between staff and patrons, it might be better refined to be used in future training and evaluations. With these future modifications implemented to correct bias and bring the tool more into line with user needs, we feel the product will be a viable chat evaluation tool for libraries to analyze chat interactions.
About the Authors
Christopher Brousseau is an NLP Research Scientist at Lifepod, where he creates, analyzes, and manages automatic speech recognition and text processing functionalities for their chatbot system. chrisbrousseau304@gmail.com
Justin Johnson is the Collections Access Librarian at the BYU Lee Library, which includes managing the main help desk and chat. Justin_johnson@byu.edu
Curtis Thacker the former Director of the Research & Development, and Discovery Systems teams at Brigham Young University’s (BYU) Harold B. Lee Library. His research interests include machine learning, open source software, empirical software engineering. In addition to a M.S. in computer science from BYU, Curtis has worked in libraries for 13 years. curtis.thacker@byu.edu
Bibliography
Devlin J, Chang MW, Lee K, Toutanova, K. 2019. BERT: Pre-training of Deep Bidirectional Transformers for Language Understanding. arXiv.org[Internet]. [cited 2020 June 27]. Available from https://arxiv.org/pdf/1810.04805.pdf.
Howard J, Ruder S. 2018. Universal Language Model Fine-tuning for Text Classification. Association for Computational Linguistics [Internet]. [cited 2020 Jun 27]; 29(5):328-339. Available from: https://www.aclweb.org/anthology/P18-1031/
Hunter J, Kannegiser S, Kiebler J, Meky D. 2019. Chat reference: evaluating customer service and IL instruction. Reference Services Review. 47(2):134-150. Available at http://jlisnet.com/vol-7-no-2-december-2019-abstract-2-jlis.
Mitchell T. Machine Learning [Internet]. McGraw Hill. 1997[cited 2020 June 27]. Available from http://www.cs.cmu.edu/afs/cs.cmu.edu/user/mitchell/ftp/mlbook.html.
Moore M. 2017. Constructing a sentiment analysis model for LibQUAL+ comments. Performance Measurement and Metrics 18(1):78-87.
Rourke L, Lupien P. 2009. Learning from Chatting: How Our Virtual Reference Questions Are Giving Us Answers. Evidence Based Library and Information Practices 5(2):63-74.
Sanh V, Debut L, Chaumond J, Wolf T. 2020. DistilBERT, a distilled version of BERT: smaller, faster, cheaper and lighter. arXiv.org[Internet]. [cited 2020 June 27]. Available from https://arxiv.org/pdf/1910.01108.pdf.
Whitchurch MJ, Merrill, E. 2019. Chat Response Competency: Library Professionals vs. Undergraduate Student Employees. Journal of Library and Information Sciences Dec 2019 7(2):10-23.
Appendix I: Custom Transformer Process
Custom Transformer Tokenizer Class:
class TransformersBaseTokenizer(BaseTokenizer):
    """Wrapper around PreTrainedTokenizer to be compatible with fast.ai"""
    def __init__(self, pretrained_tokenizer: PreTrainedTokenizer,
                 model_type = 'bert', **kwargs):
        self._pretrained_tokenizer = pretrained_tokenizer
        self.max_seq_len = pretrained_tokenizer.max_len
        self.model_type = model_type

    def __call__(self, *args, **kwargs):
        return self

    def tokenizer(self, t:str) -> List[str]:
        """Limits the maximum sequence length and add the special tokens"""
        CLS = self._pretrained_tokenizer.cls_token
        SEP = self._pretrained_tokenizer.sep_token
        if self.model_type in ['roberta']:
            tokens = self._pretrained_tokenizer.tokenize(t, add_prefix_space=True)[:self.max_seq_len - 2]
        else:
            tokens = self._pretrained_tokenizer.tokenize(t)[:self.max_seq_len - 2]
        return [CLS] + tokens + [SEP]
The Basic DataBunch API from FastAI, this is the portion that we did:
databunch = (TextList.from_df(train, cols='Phrase', processor=transformer_processor)
             .split_by_rand_pct(0.1,seed=seed)
             .label_from_df(cols= 'Sentiment')
             .add_test(test)
             .databunch(bs=bs, pad_first=pad_first, pad_idx=pad_idx))
Custom Transformer Wrapper Class:
# defining our model architecture
class CustomTransformerModel(nn.Module):
    def __init__(self, transformer_model: PreTrainedModel):
        super(CustomTransformerModel,self).__init__()
        self.transformer = transformer_model

    def forward(self, input_ids, attention_mask=None):
        logits = self.transformer(input_ids,
                                attention_mask = attention_mask)[0]
        return logits
Transformer Config for our Model:
config = config_class.from_pretrained(pretrained_model_name)
config.num_labels = 5
The FastAI Learner API that combines everything we’ve created together:
learner = Learner(databunch,
                  custom_transformer_model,
                  opt_func = CustomAdamW,
                  metrics=[accuracy, error_rate])
Training Loop:
learner.save('untrain')
learner.load('untrain');
learner.freeze_to(-1)
learner.lr_find()
learner.fit_one_cycle(1,max_lr=2e-03,moms=(0.8,0.7))
learner.save('first_cycle')
learner.load('first_cycle');
learner.freeze_to(-2)
lr = 1e-5
learner.fit_one_cycle(1, max_lr=slice(lr*0.95**num_groups, lr), moms=(0.8, 0.9))
learner.save('second_cycle')
learner.load('second_cycle');
learner.freeze_to(-3)
learner.fit_one_cycle(1, max_lr=slice(lr*0.95**num_groups, lr), moms=(0.8, 0.9))
learner.save('third_cycle')
learner.load('third_cycle');
learner.unfreeze()
learner.fit_one_cycle(2, max_lr=slice(lr*0.95**num_groups, lr), moms=(0.8, 0.9))
Appendix II: Custom Transformer Model Architecture
CustomTransformerModel(
  (transformer): DistilBertForSequenceClassification(
    (distilbert): DistilBertModel(
      (embeddings): Embeddings(
        (word_embeddings): Embedding(30522, 768, padding_idx=0)
        (position_embeddings): Embedding(512, 768)
        (LayerNorm): LayerNorm((768,), eps=1e-12, elementwise_affine=True)
          (dropout): Dropout(p=0.1, inplace=False)
      )
      (transformer): Transformer(
        (layer): ModuleList(
          (0): TransformerBlock(
            (dropout): Dropout(p=0.1, inplace=False)
            (attention): MultiHeadSelfAttention(
              (dropout): Dropout(p=0.1, inplace=False)
            )
            (sa_layer_norm): LayerNorm((768,), eps=1e-12, elementwise_affine=True)
            (ffn): FFN(
              (dropout): Dropout(p=0.1, inplace=False)
            )
            (output_layer_norm): LayerNorm((768,), eps=1e-12, elementwise_affine=True)
          )
          (1): TransformerBlock(
            (dropout): Dropout(p=0.1, inplace=False)
            (attention): MultiHeadSelfAttention(
              (dropout): Dropout(p=0.1, inplace=False)
            )
            (sa_layer_norm): LayerNorm((768,), eps=1e-12, elementwise_affine=True)
            (ffn): FFN(
              (dropout): Dropout(p=0.1, inplace=False)
            )
            (output_layer_norm): LayerNorm((768,), eps=1e-12, elementwise_affine=True)
          )
          (2): TransformerBlock(
            (dropout): Dropout(p=0.1, inplace=False)
            (attention): MultiHeadSelfAttention(
              (dropout): Dropout(p=0.1, inplace=False)
            )
            (sa_layer_norm): LayerNorm((768,), eps=1e-12, elementwise_affine=True)
            (ffn): FFN(
              (dropout): Dropout(p=0.1, inplace=False)
            )
            (output_layer_norm): LayerNorm((768,), eps=1e-12, elementwise_affine=True)
          )
          (3): TransformerBlock(
            (dropout): Dropout(p=0.1, inplace=False)
            (attention): MultiHeadSelfAttention(
              (dropout): Dropout(p=0.1, inplace=False)
            )
            (sa_layer_norm): LayerNorm((768,), eps=1e-12, elementwise_affine=True)
            (ffn): FFN(
              (dropout): Dropout(p=0.1, inplace=False)
            )
            (output_layer_norm): LayerNorm((768,), eps=1e-12, elementwise_affine=True)
          )
          (4): TransformerBlock(
            (dropout): Dropout(p=0.1, inplace=False)
            (attention): MultiHeadSelfAttention(
              (dropout): Dropout(p=0.1, inplace=False)
            )
            (sa_layer_norm): LayerNorm((768,), eps=1e-12, elementwise_affine=True)
            (ffn): FFN(
              (dropout): Dropout(p=0.1, inplace=False)
            )
            (output_layer_norm): LayerNorm((768,), eps=1e-12, elementwise_affine=True)
          )
          (5): TransformerBlock(
            (dropout): Dropout(p=0.1, inplace=False)
            (attention): MultiHeadSelfAttention(
            )
            (sa_layer_norm): LayerNorm((768,), eps=1e-12, elementwise_affine=True)
            (ffn): FFN(
              (dropout): Dropout(p=0.1, inplace=False)
            )
            (output_layer_norm): LayerNorm((768,), eps=1e-12, elementwise_affine=True)
          )
        )
      )
    )
    (pre_classifier): Linear(in_features=768, out_features=768, bias=True)
    (classifier): Linear(in_features=768, out_features=5, bias=True)
    (dropout): Dropout(p=0.2, inplace=False)
  )
)
Appendix III: Methodology
Based on the Universal Language Model Fine-Tuning for Text Classification (ULMFiT) method of transfer learning in NLP, we have achieved a state-of-the-art system that can still be visibly improved. ULMFiT was developed by Jeremy Howard, a co-founder of fast.ai, which he uses to demonstrate state-of-the-art results using models trained on 100x less data than the originals, making it a very flexible and powerful algorithm. Some of the key techniques involved in ULMFiT namely Discriminative Learning Rates, Gradual Unfreezing, and Slanted Triangular Learning Rates have been essential to the reported level of results, and explained below.
The network architecture utilized is a standard DistilBERT layered neural network as pioneered by HuggingFace NLP. We wrote a custom transformer wrapper to make it more flexible for testing and development, allowing us to substitute different base transformer language models (such as XLNet and RoBERTa) in the easiest way possible.Throughout this testing we learned that in order to optimize our network for the shortest amount of time, DistilBERT was the best choice, because it is the smallest. The network is initialized in layers in the following sequence:
1 – Pre-trained embedding layer
2 – Distilbert Transformer layer 1
3 – Distilbert Transformer layer 2
4 – Distilbert Transformer layer 3
5 – Distilbert Transformer layer 4
6 – Distilbert Transformer layer 5
7 – Distilbert Transformer layer 6
8 – Pre-Classifier layer
9 – Classifier
So on to what we’ve done differently. Discriminative Learning Rates propose a theory that to improve a model, a different learning rate should be used for different layers, with the highest learning rate at the very end of the model (pre-classifier layer). When learning with Stochastic Gradient Descent, the equation changes slightly:
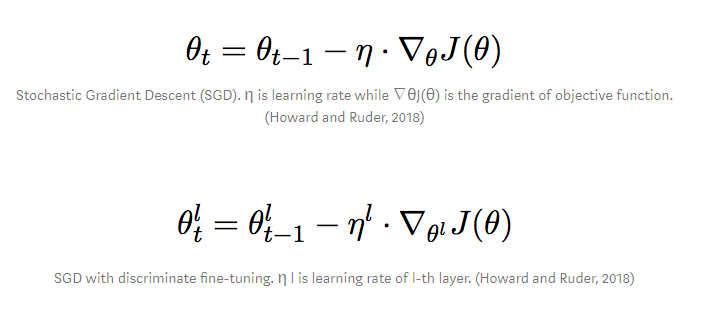
Figure 2. Images credited to Howard and Ruder (Howard et al. 2018).
Slanted Triangular Learning Rates build off of the first idea by increasing the dynamic learning rate at the beginning of training, then decaying it linearly to form a sort of triangle graphically:
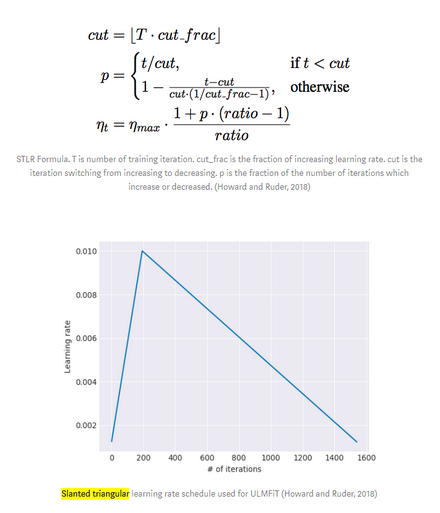
Figure 3. Image credited to Howard and Ruder (Howard et al. 2018).
Gradual Unfreezing bring the first two ideas home, by starting the training with the entire model frozen except for the very last layer (thus having the highest learning rate) during the first epoch of training, then drop the learning rate slightly and do the second round of training with everything frozen but the last 2 layers, then the last 3 layers, then with the lowest learning rate, we unfreeze the entire model and train for 2-5 epochs, with the learning rate decreasing each time.
This basic methodology has allowed us to achieve state-of-the-art results on 21 categories, with only 4475 labelled examples in our training set. This dataset is relatively small, making this achievement that much more impressive. With that in mind, our results could be much more useful for the purposes of BYU Library if we put some more effort into cleaning our current dataset, augmenting outlier examples, and add more data into it.

Daniel van Strien, 2021-02-12
This was a lovely paper. I really liked that you avoided using a ‘black box’ commercial solution for a domain that is probably quite different from commercial chat services.
I had whether you have (or considered) using any additional metatada related to the chat message. For example, do you have information on time, day of the week of the chat?
I haven’t worked with library chat systems but wonder if they follow some patterns i.e. more questions about when the library closes come later in the day and some times of year may have more questions related to dissertations. If this information is given to the model it may be able to use it to help make predictions without having to hand craft these rules.
There are some example of doing this with the ULMFIT approach https://www.novetta.com/2019/03/introducing_me_ulmfit/
I’d be curious to hear about any thoughts on this and whether you think it might be a possible approach.
thanks again for the wonderful paper :)