By Michael J. Bennett
I. Introduction
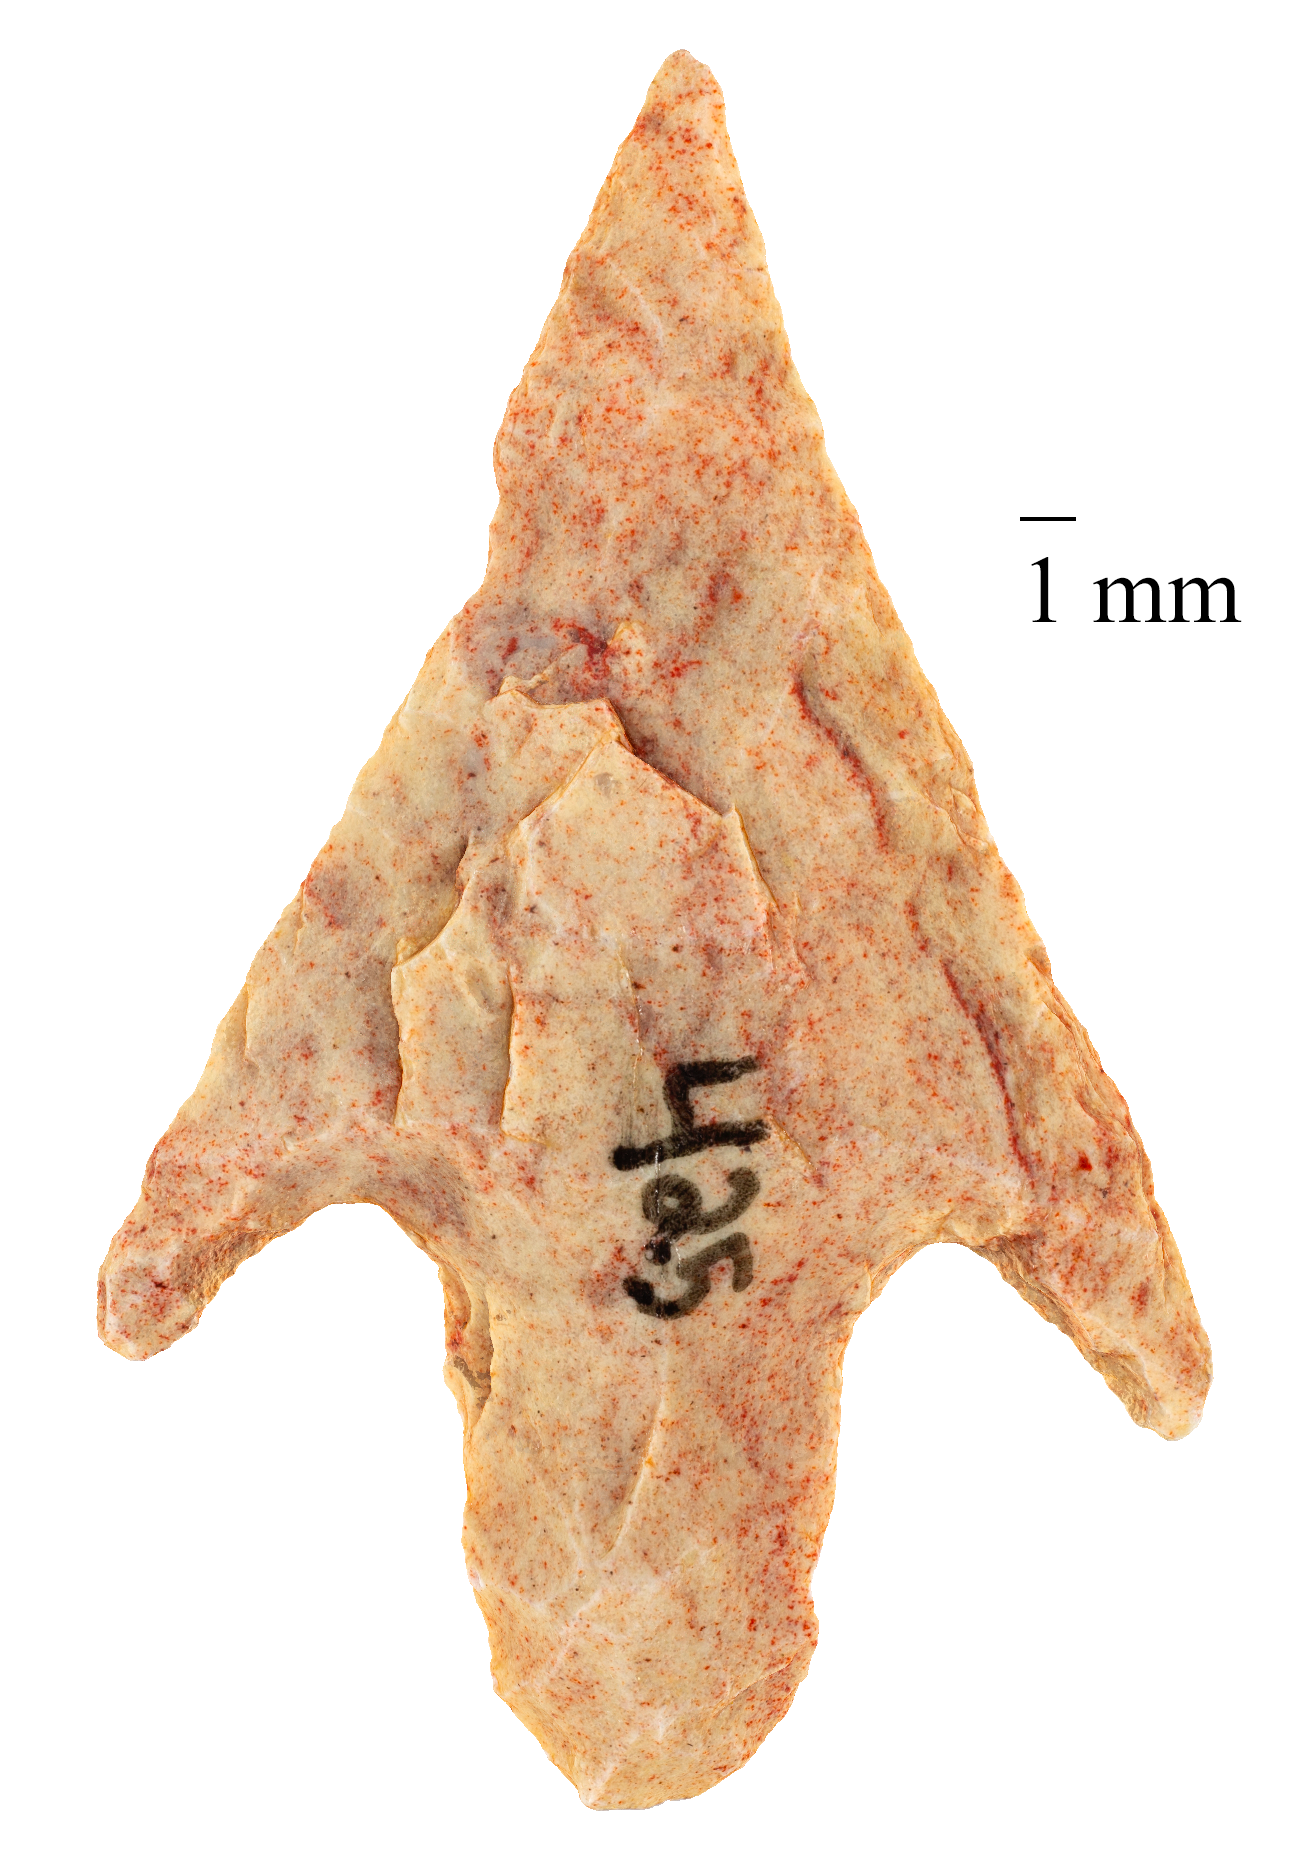
Figure 1. Artifact 2005.002.007 Bag 5a Point 425, Max height 30.13mm. Max width 18.95mm. GSD 9.52 μm/pix, https://skfb.ly/6X9Tx From the Caldwell Collection of North African Points, https://skfb.ly/6Vr9D
As libraries, archives, and museums continue to explore and implement the digital capture and rendering of their 3D collection objects, it is important to understand and anticipate both the near-term and future uses of the resulting data sets from such activities. Novel repurposed data needs can, in turn, form a dynamic feedback loop to help guide appropriate levels of original acquisition fidelity as analysis methods of rendered outputs advance through time.
Unlike the 2D imaging ecosystem, guidelines and terminology for assessing the accuracy and resulting quality of image-based 3D reconstructions lack normalized use. Standardized performance measurements like the fundamental 2D imaging resolution metric, SFR (ISO 12233, 15529), have yet to be similarly codified in the 3D domain (Webb, 2020) (Saidi, 2020). Though this gap and the challenges of evaluating data in three dimensions are real, there exist measurements from other areas of remote sensing that can have direct application with objects from cultural heritage.
Alongside these issues of metrology and geometric accuracy and precision, there remain the more qualitative aspects of captured and processed 3D visual information that can be texture mapped on top of fine polygonal information. In fields such as archaeology and anthropology, visual cues found in both the millimeter and submillimeter levels can shed new investigative light on things like the taxonomic classification of artifacts and are critical to rapidly evolving movements in teaching, learning, and scholarship in the digital and online realms.
II. Background
During Spring 2020, the author conducted initial experiments with small objects and extreme close-range photogrammetry through focus stacking to create 3D recordings with full object views (Bennett, 2020a). These tests were made to better determine whether this technique could help alleviate the problems of blurring and the loss of spatial resolution that close focus and narrow depth of field present photogrammetric 3D reconstructions. Focus stacking involves the acquisition of a bracket of images with varying focal points. These are subsequently focus stacked through computational means into final rendered images that possess an increased depth of field. In addition, the author’s early examination explored similar methods to those described by Gallo et al (2014) and their work on partial 3D object views with the idea of extending these foundational techniques towards more comprehensive, full 3D object views of small lithics.
Overall, these initial efforts showed promise and subsequently led to the forming of an interdisciplinary, cross-campus working group made up of faculty from the University of Connecticut’s Anthropology Department, and staff from the Connecticut State Museum of Natural History, Office of the State Archaeologist, and the UConn Library. Its goal was to run 10 – 20 stone artifacts from the State Museum’s Caldwell Collection of North African Points through the extreme close-range photogrammetric workflow that the author had begun to refine in the Spring.
With the sudden reliance on digital and virtual collections brought on by COVID-19 lockdowns, it was felt that members of the Anthropology department and archaeology educators and scholars at large might find new pedagogic and research use of such new high quality assets. Concurrent with these deliverables, the author also wished to explore the boundaries of extreme close-focus 2D image capture in the context of feasible and consistent photogrammetric reconstructions. In this way it was hoped that a better understanding could be achieved on the relationships among acquisition quality, downstream geometric accuracy, discernible visual detail, and general production time and data archiving costs.
As the initial photogrammetry/focus stacking experiments were conducted at the author’s home studio during the early days of the COVID-19 shutdown, efforts towards the working group’s aims could be seamlessly continued there and gradually improved upon as time went on. Key iterative changes made beyond the early Spring experimentation phase included upgrading to a faster and higher capacity 13 inch Apple Macbook Pro (macOS 10.15.7, 32GB RAM, 2.3 GHz Quad-Core Intel Core i7, 4TB SSD). Also, Helicon Focus Pro v7.6.4 substituted for Photoshop to complete needed focus stacking from the large focus-bracketed image stacks. Helicon Focus’ ability to split and batch process multiple stacks to go along with its selectable rendering methods made it well suited to more elegantly complement the large image sets that resulted from the increasingly close-range photogrammetry that evolved as the project progressed.
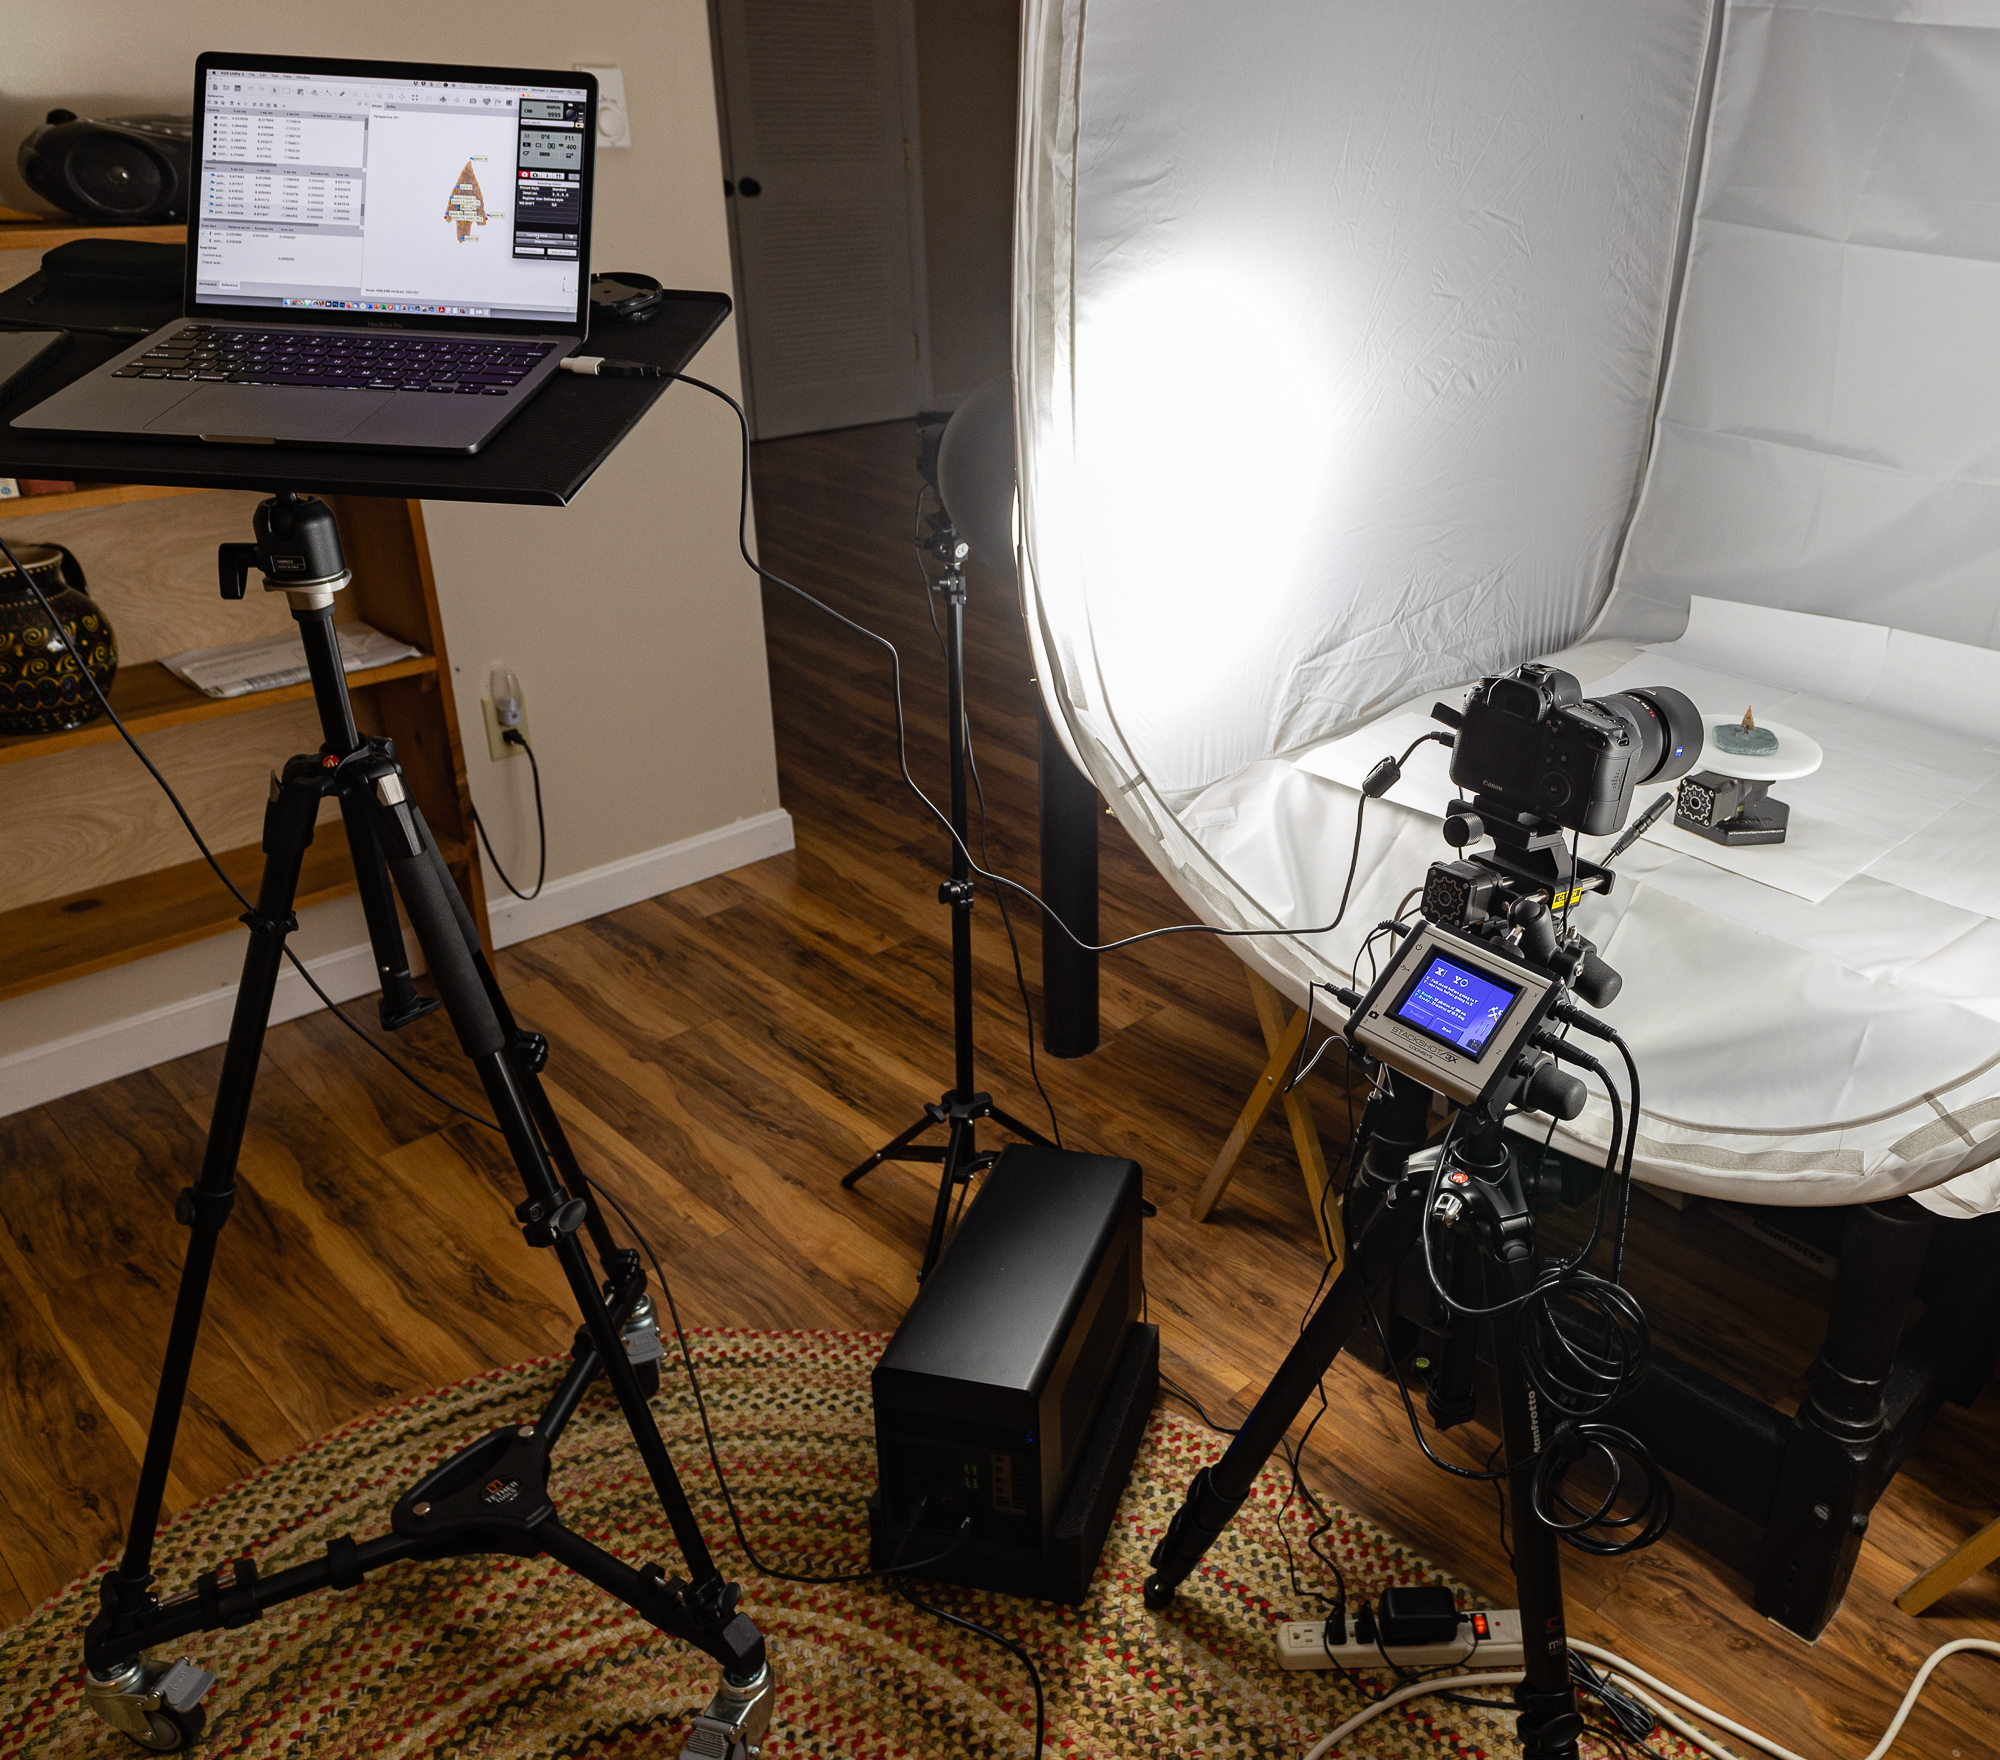
Figure 2. Photogrammetry/focus stacking rig.
The original surplus tripod was also swapped out for a Manfrotto 057 carbon fiber unit with geared column. This greatly assisted in the raising and lowering of the heavy camera, Cognisys focus rail, and Manfrotto 3-way geared pan and tilt head combination between successive look angles on the stone points as they were photographed. A programmable Cognisys turntable was also eventually added. Finally, an AMD Radeon Pro WX 8200 Graphics Card and Razer Core X Thunderbolt 3 Graphics Expansion Chassis were also slotted into the existing hardware chain to better optimize both Agisoft’s Metashape Pro and Helicon Focus’ abilities to leverage available GPU power (Figure 2). The AMD WX 8200 card was judged to be a good balance of size and speed (8GB, 512 GB/s bandwidth) paired with the computational stability of the AMD Pro series’ overall design. Also, when not in use in the external enclosure, this graphics card could easily be swapped into the UConn Library’s Digital Production Lab’s automated 3D capture workstation (Bennett, 2018) once operations there returned to pre-pandemic levels.
III. Rendered Data and Performance Metrics
With few exceptions, the majority of the study’s stone points were captured using four total look angles (two per object orientation). A Canon EOS 6D DSLR camera with 35.8mm x 23.9mm, 5,472 x 3,648px CMOS sensor was alternately used with either a Zeiss Milvus 50mm f/2M ZE or Zeiss Milvus 100mm f/2M ZE macro lens. In addition, the 100mm Zeiss lens was fitted with two stacked Canon EF 12 II extension tubes to further shorten its minimum focus distance. Both of these lenses are manual-focus-only and have long and heavy focus throws which are very stable once set. As a result, they are well-suited for subsequent Structure from Motion (SfM) camera calibration, alignment, and sparse point cloud generation which are foundational to overall high quality photogrammetric data creation (“Structure from Motion,” 2021).
A kneadable eraser base was used to mount objects in either up or down orientation on top of the turntable (Figure 2) as described by Porter, et al (2016). Based upon the size and shape of a given object, focus brackets of 8 to 48 images per camera position were employed to increase depth of field in order to keep the object in focus at each position throughout a given 360° circuit. Turntable rotation was 10° per camera position (and focus bracket). These image groups were then focus-stacked in Helicon Focus Pro v7.6.4 using its depth map rendering method and split stack batch process. Helicon Focus’ depth map algorithm was deemed optimally suited among the software’s methods due to its ability to better mitigate direct reflections and glare that often appeared on lithics based upon their rock type and given angles to camera and lights.
Final processed images were then imported into Agisoft Metashape Pro v1.6.4 where they were aligned (Cultural Heritage Imaging | Photogrammetry, 2021; Mallison, 2015; Schroer et al., 2014), and masked following the “up/down” workflow established by Porter (2016). Dense point clouds were initially generated with Metashape’s High Quality parameter for the first nine models captured using the Zeiss 50mm lens. However, after installation of the AMD external graphics card into the hardware chain, the remaining lithics were shot with the Zeiss 100mm lens and processed with the Ultra High Quality dense cloud parameter. A typical final image network can be seen in Figure 3.
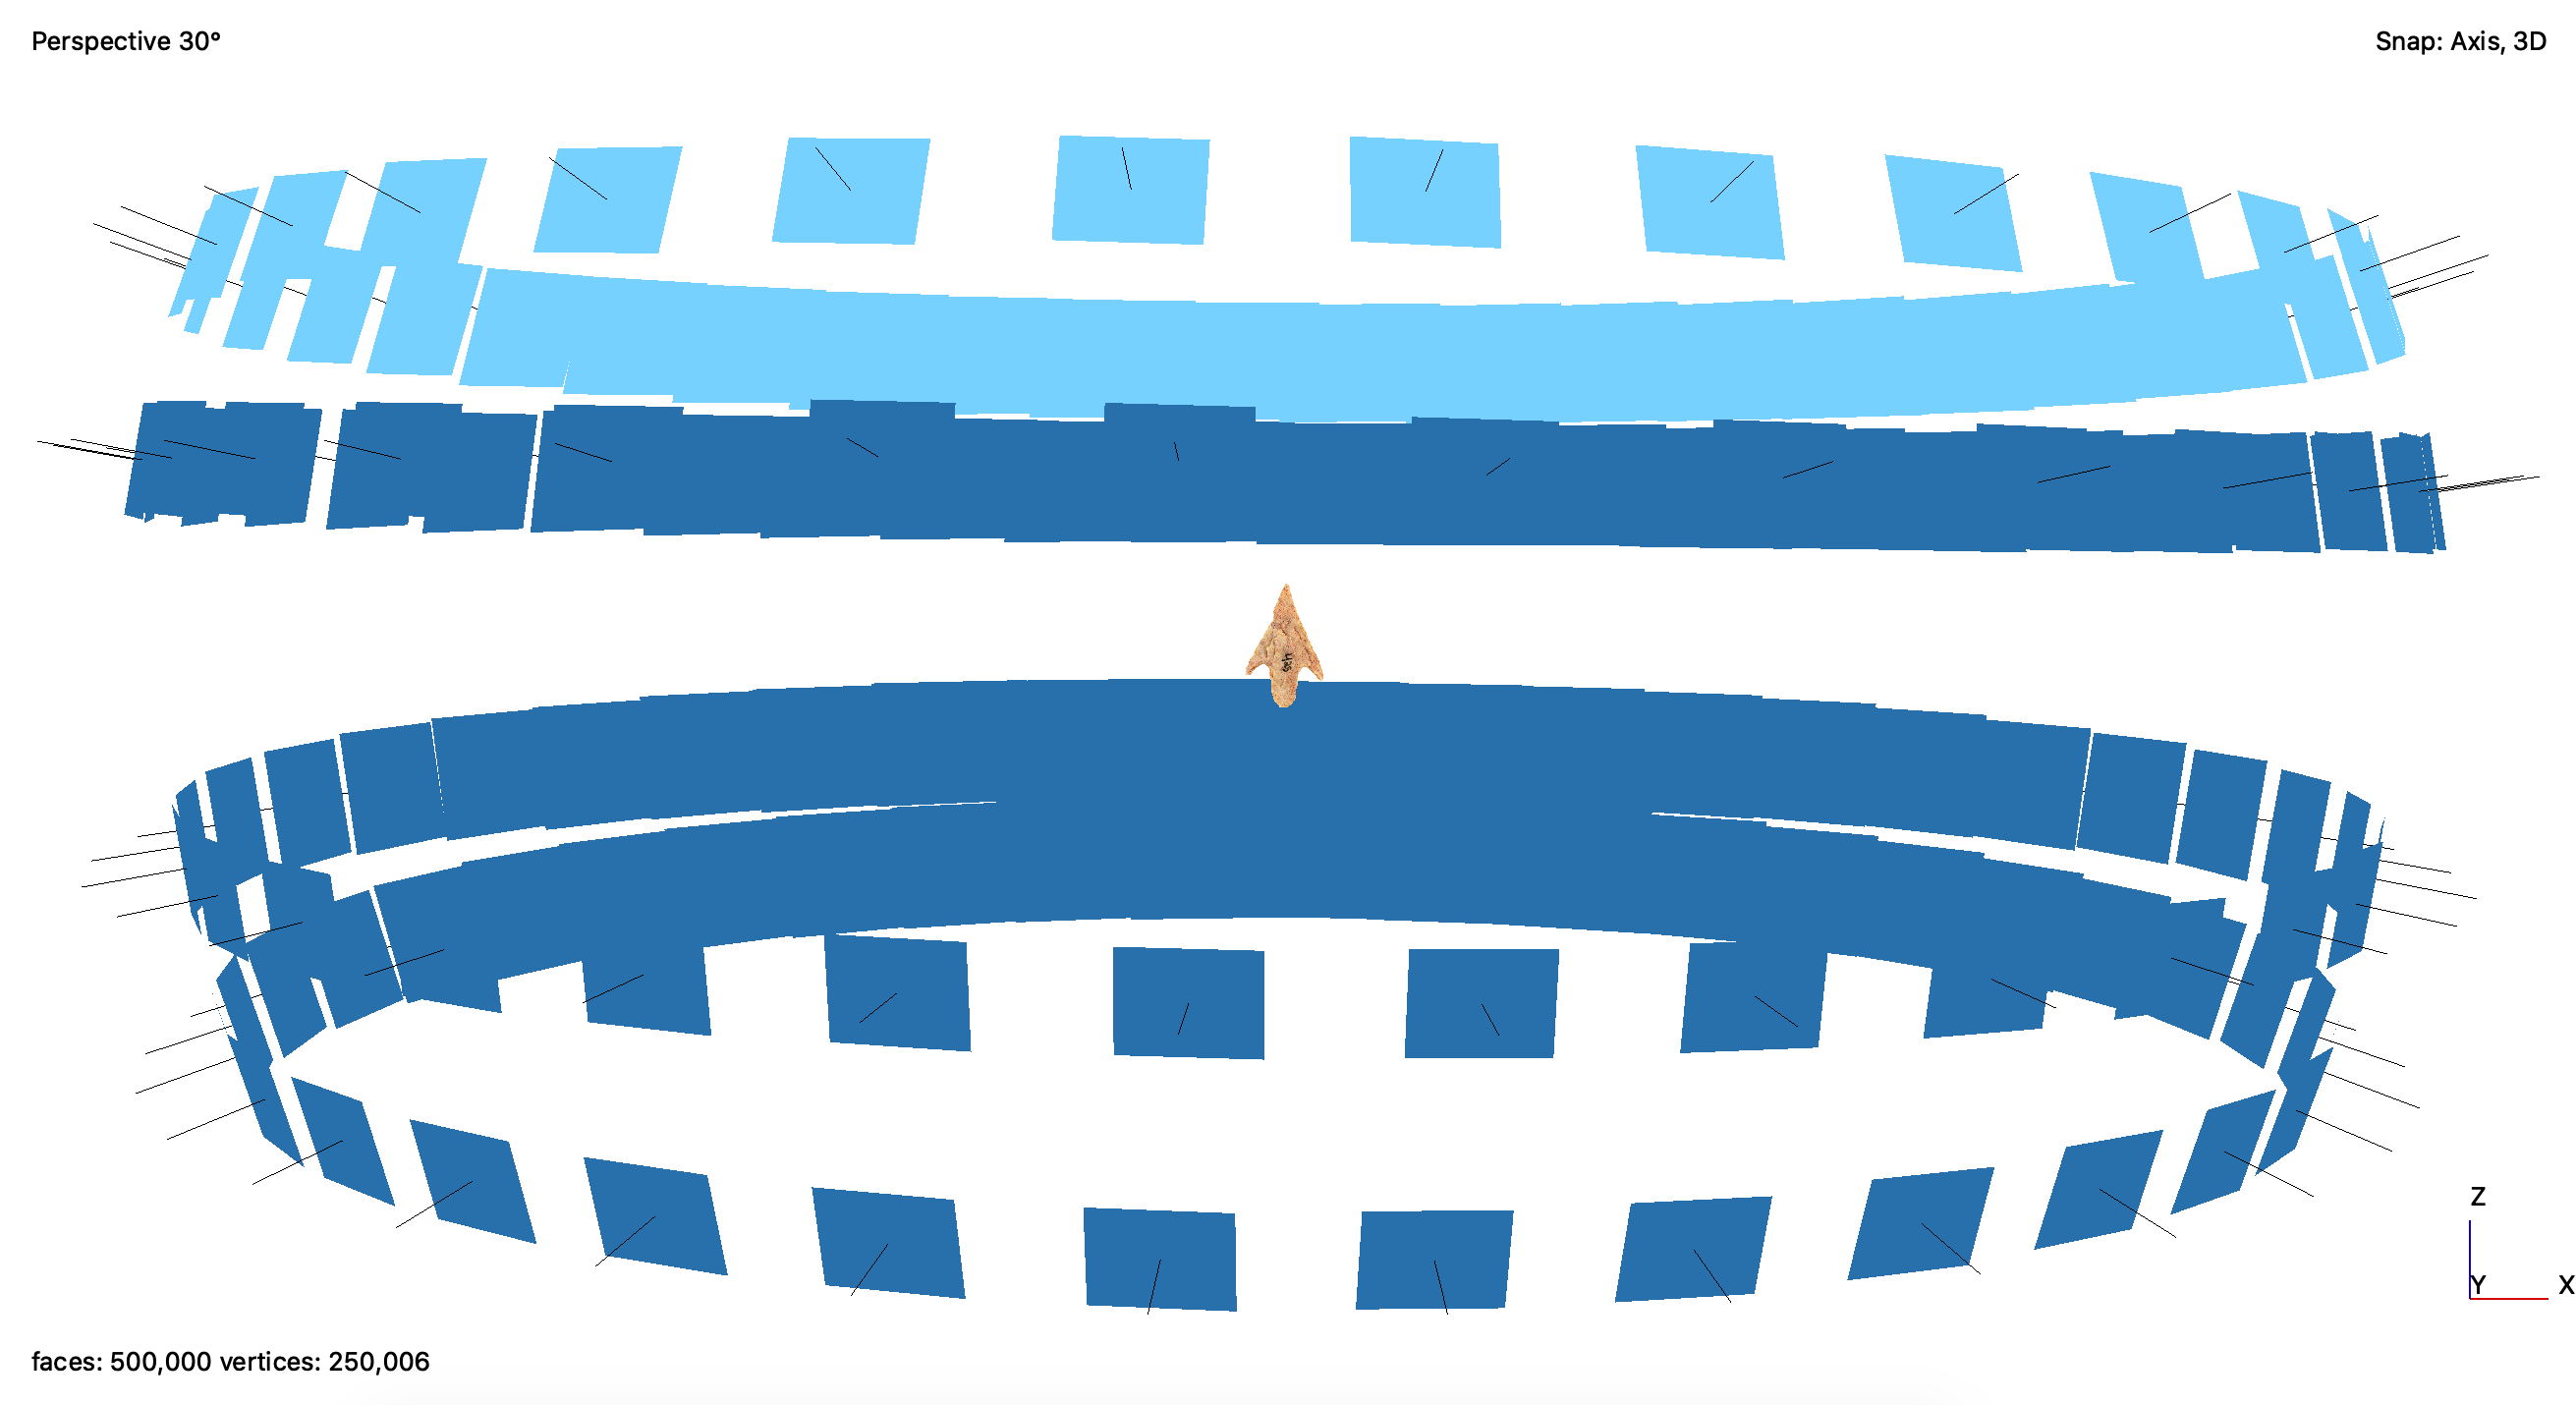
Figure 3. Final image network for the stone artifact 2005.002.007 Bag 5a Point 425, from the Caldwell Collection of North African Points.
Ground sampling distance (GSD) is the resolution of a surface model which is governed by the area on the real-world subject represented by the pixels in the images from which the surface model was generated (Cultural Heritage Imaging | Photogrammetry, 2021). GSD can also be thought of as the size of an object or feature in object space represented by a single pixel in the image space. It can be estimated from the camera distance from the object, the focal length of the lens, and the pixel size of the camera.
GSD can also be used to understand the parameters required for recording the smallest detail that needs to be resolved through image-based 3D reconstructions (Andrews et al., 2015; Matthews, 2008; Remondino et al., 2013; Verhoeven, 2018, 2019; Webb, 2020). In many ways it is analogous to the 2D imaging world’s idea of sampling frequency. However, on their own, neither sampling frequency nor GSD completely describe 2D or 3D systems’ performance, since no system operates at 100% efficiency. Instead these measurements more accurately describe a given system’s potential.
Spatial frequency response (SFR) is used in 2D to describe an imaging system’s ability to maintain the relative contrast of features within a given spatial proximity (ISO 12233, ISO 16067-1, ISO 16067-2, ISO 15524). SFR takes into consideration the effects that levels of optical “blur” from imaging optics, hardware, imaging processing software, and environmental factors can have on captured images (Williams, 2010). As a result, SFR can more clearly determine a 2D imaging system’s overall capacity for quality. But is there a similar comprehensive metric to gauge the measurement performance of image-based 3D reconstructions?
For cultural heritage recording, the registration of individual 3D point clouds is generally achieved using the object’s own geometry (natural points, distinctive surface features) (Luhmann et al., 2014; “Structure from Motion,” 2021). More specifically Metashape Pro employs a combination of proprietary SfM algorithms that are similar in nature to Scale-Invariant Transform (SIFT) for such initial feature detection (“Scale-Invariant Feature Transform,” 2021; Semyonov, 2011).
For a given sparse point cloud, the program can in turn calculate its root mean square (RMS) reprojection error. The RMS reprojection error is the distance between the point on the image where a reconstructed 3D point can be projected and the original projection of that 3D point detected on the photo and used as a basis for the 3D point reconstruction procedure (Agisoft Metashape User Manual – Professional Edition, Version 1.6, 2020). Though an insightful indicator of initial camera alignment accuracy, RMS reproduction error does not factor in subsequent photogrammetric processing where inaccuracies of dense point cloud creation, mesh generation, and texture mapping can potentially occur. In turn, its use is naturally limited.
Unlike 2D digitization with its maturing performance metrics and test targets (Rieger, 2016; van Dormolen, 2012), image-based 3D reconstruction for cultural heritage lacks standardized test objects, analysis protocols, and reliable reference data which make accuracy assessment challenging (Webb, 2020). However, rules of thumb on determining the smallest resolvable detail of acquired 3D geometry have been posited based upon Nyquist–Shannon sampling theorem (“Nyquist–Shannon Sampling Theorem,” 2021), experimentation in remote sensing, and known optical aberrations present in imaging systems. For example, in aerial photography applications, Verhoeven (2018, 2019) has suggested that GSD should be at least three times smaller than the required limiting spatial resolution. With regard to image-based 3D reconstructions, Remondino et al (2013) have similarly advised that GSD should be at least 2-3 times smaller than the smallest geometric detail to be captured.
In turn, the author has multiplied the GSD value for each of the study’s reconstructed stone objects by 3 to roughly estimate their smallest resolvable detail in mm (Table 1). It should be noted that image-based reconstructions can vary in quality across 3D surfaces due to problems that photogrammetric processing algorithms can suffer as a result of an object’s physical properties. These properties can include occlusions, reflectance, translucence, and low frequency features. However, the estimated figures presented here, which range from 0.02577mm to 0.06870mm among sampled objects, do provide an initial glimpse into the effectiveness that focus stacking can have on the creation of resulting photogrammetric geometries.
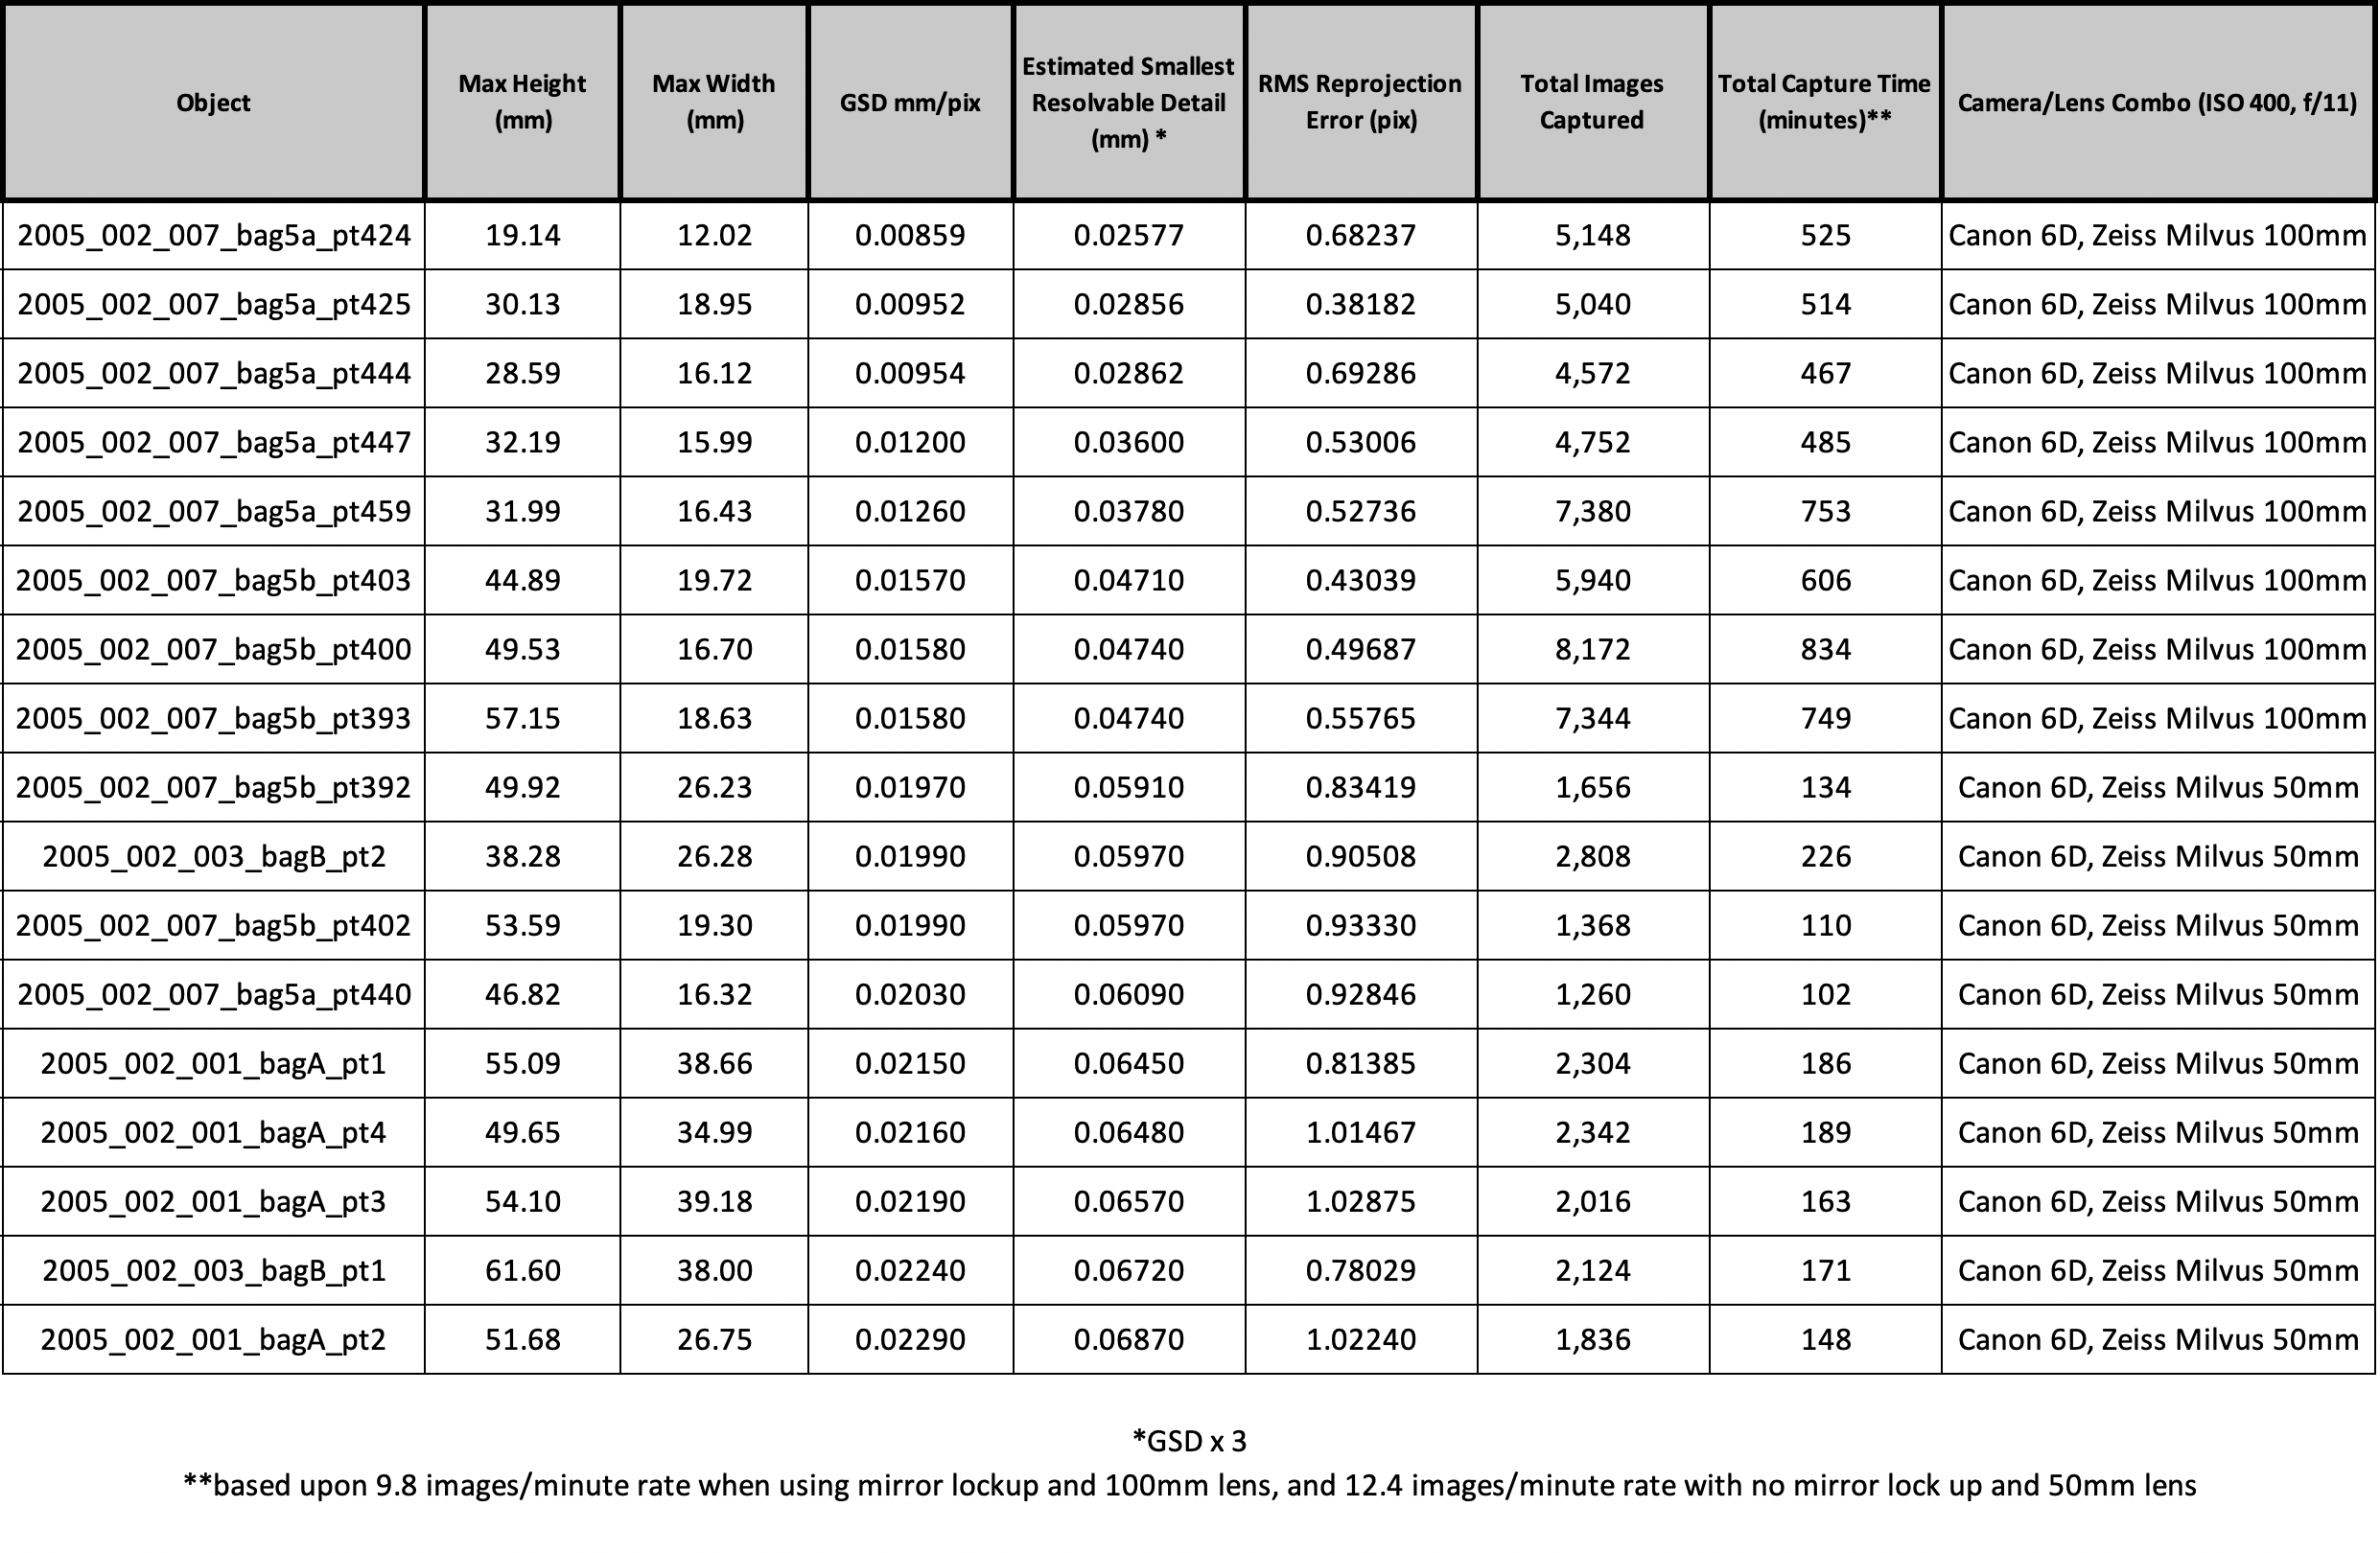
Table 1. Stone artifact metrics sorted by Ground Sampling Distance (GSD).
Such accuracy, however, does come with certain costs. These include very large image data sets and lengthy capture times (Table 1). Nevertheless both capture and focus stacking/photogrammetry pipelines have been designed by the author to be largely automated through programmable hardware and optimized software that are geared for large batch processing. As an illustration, beyond mounting an object, adjusting the camera look angle, and programming the focus rail to an appropriate focus bracket range, subsequent photographic acquisition can be done completely unattended (Bennett, 2020a).
At the time of writing, the complete data sets of each of the study’s objects are in the process of being archived in the Connecticut Digital Archive open repository (Caldwell Collection of North African Points Data Sets, 2021).
IV. Measurement and Visual Analysis
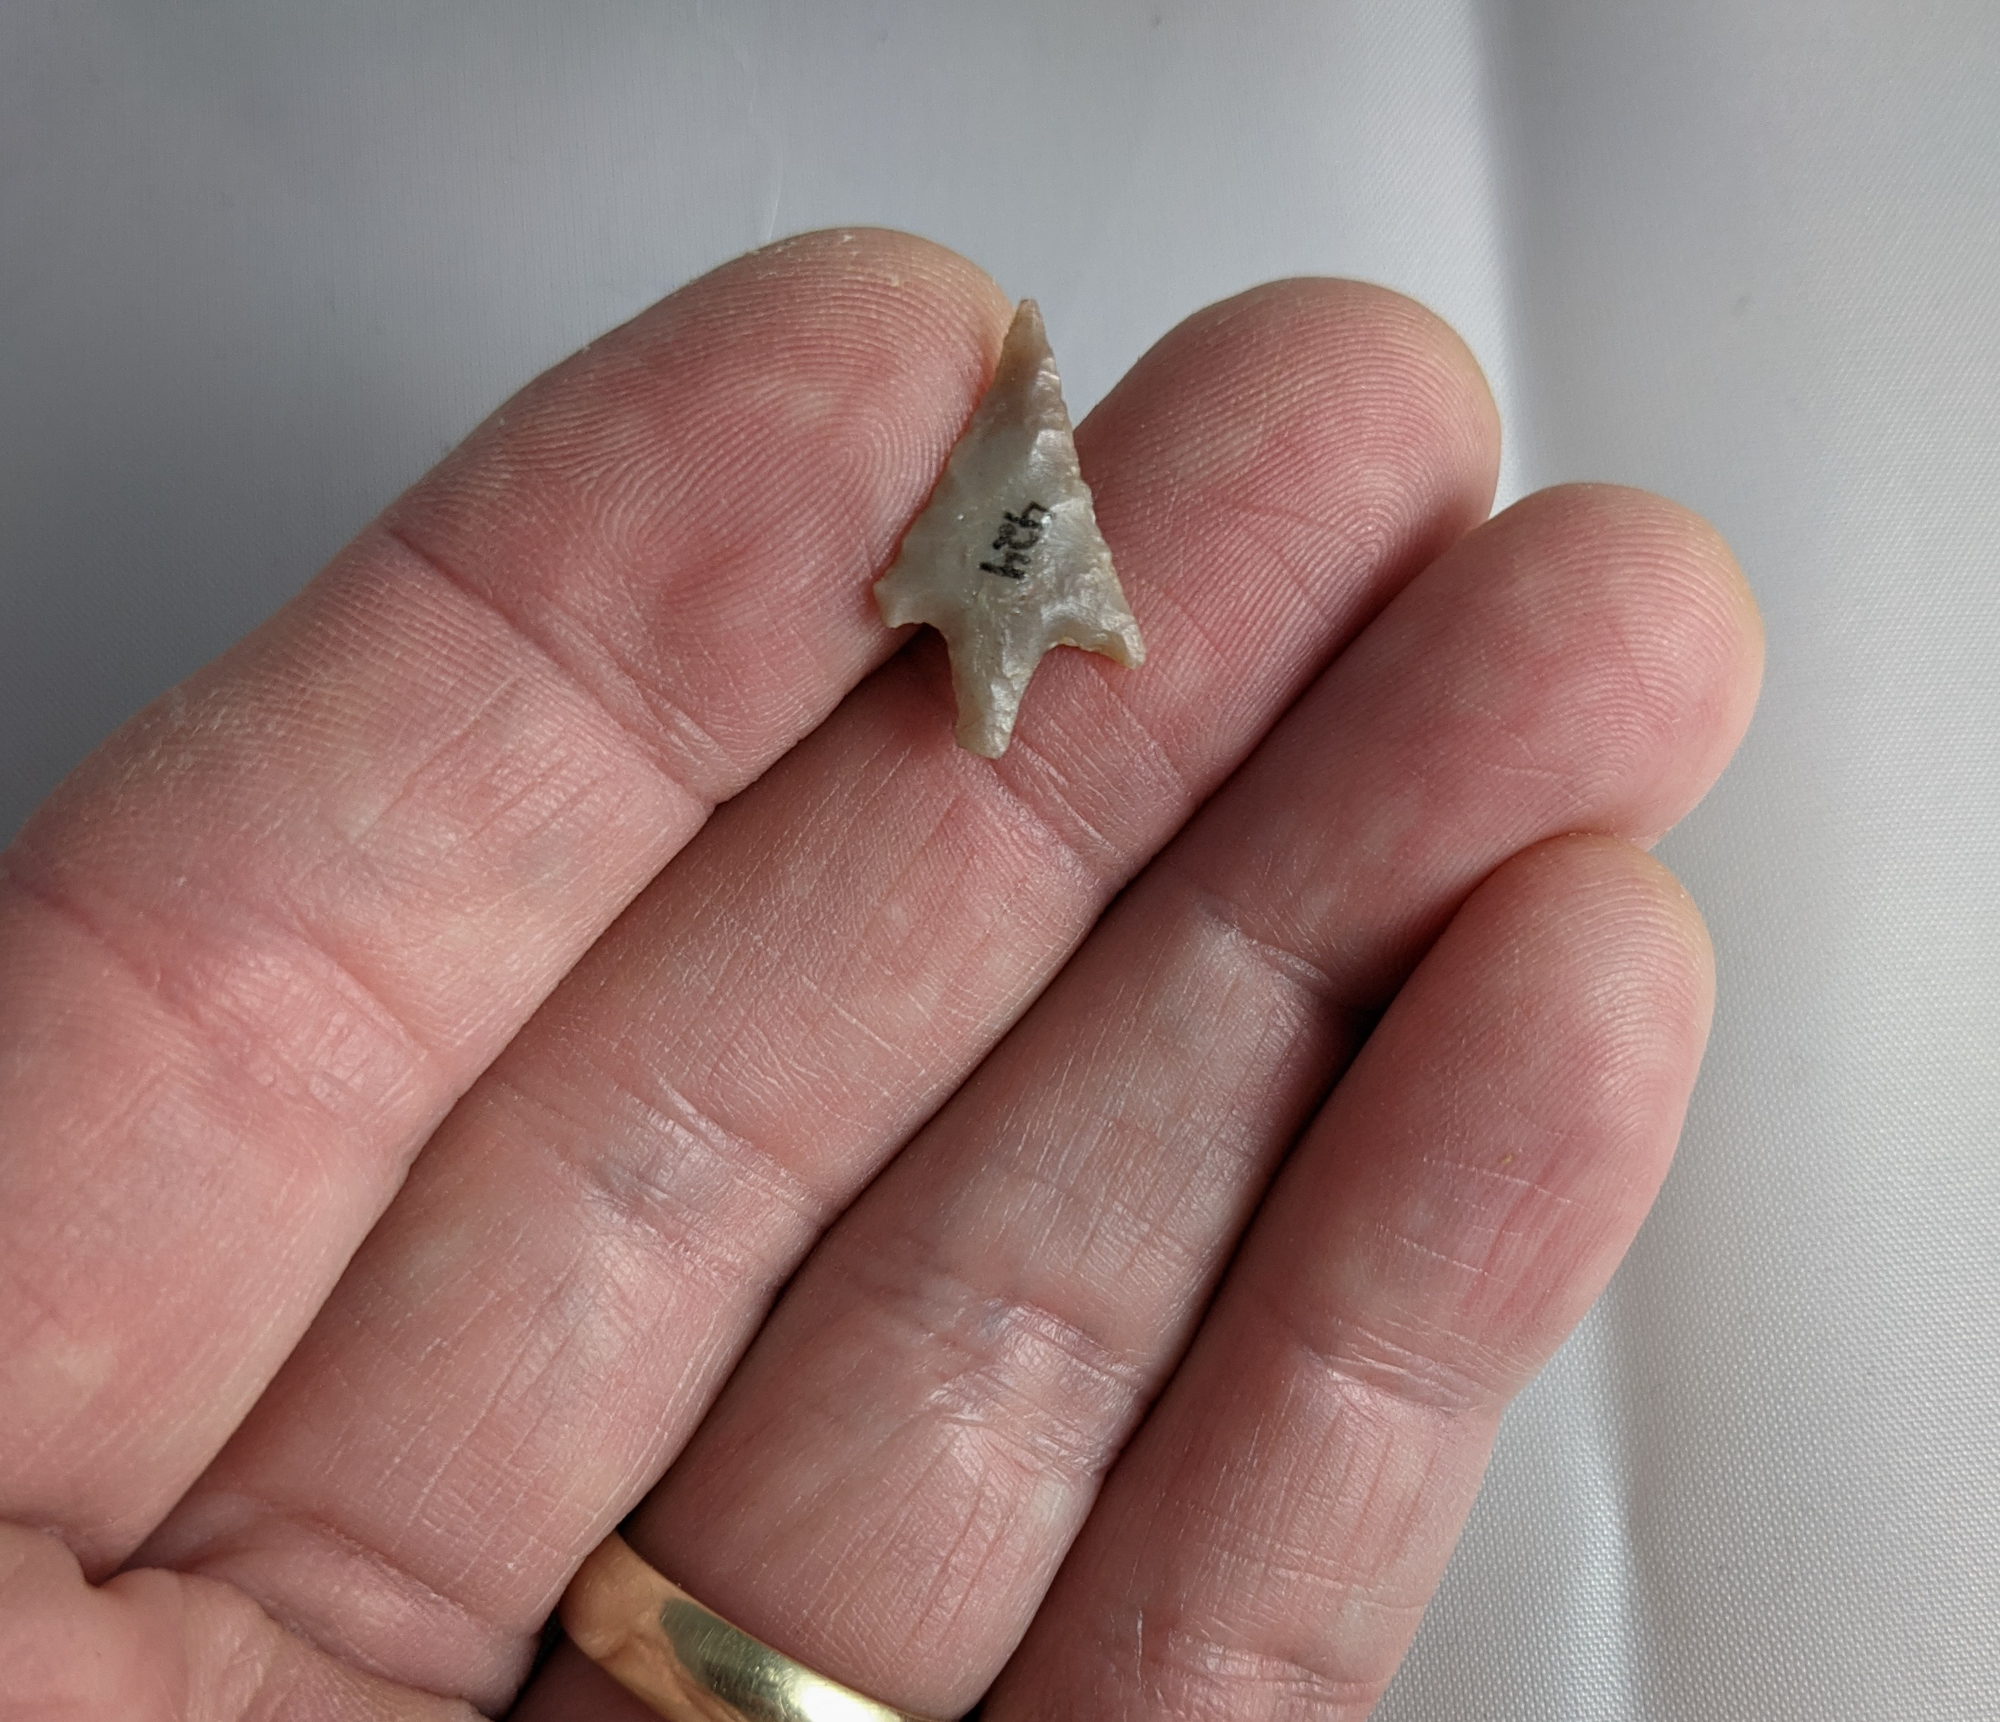
Figure 4. Artifact 2005.002.007 Bag 5a Point 424, from the Caldwell Collection of North African Points. Max height 19.14mm. Max width 12.02mm.
Common measurements of archaeological artifacts include maximum height and width (Banning, 2006). Mostly done with hand-held tools either in situ or in a lab environment, similar measurements can be digitally conducted with high precision using scaled, image-based 3D reconstructions and open source software (Bennett, 2020b).
Meshlab is one such application (Cignoni et al., 2020). Figure 5 illustrates a simple maximum height and width measurement of the Euclidean geometry of a sample 3D surrogate within the program.
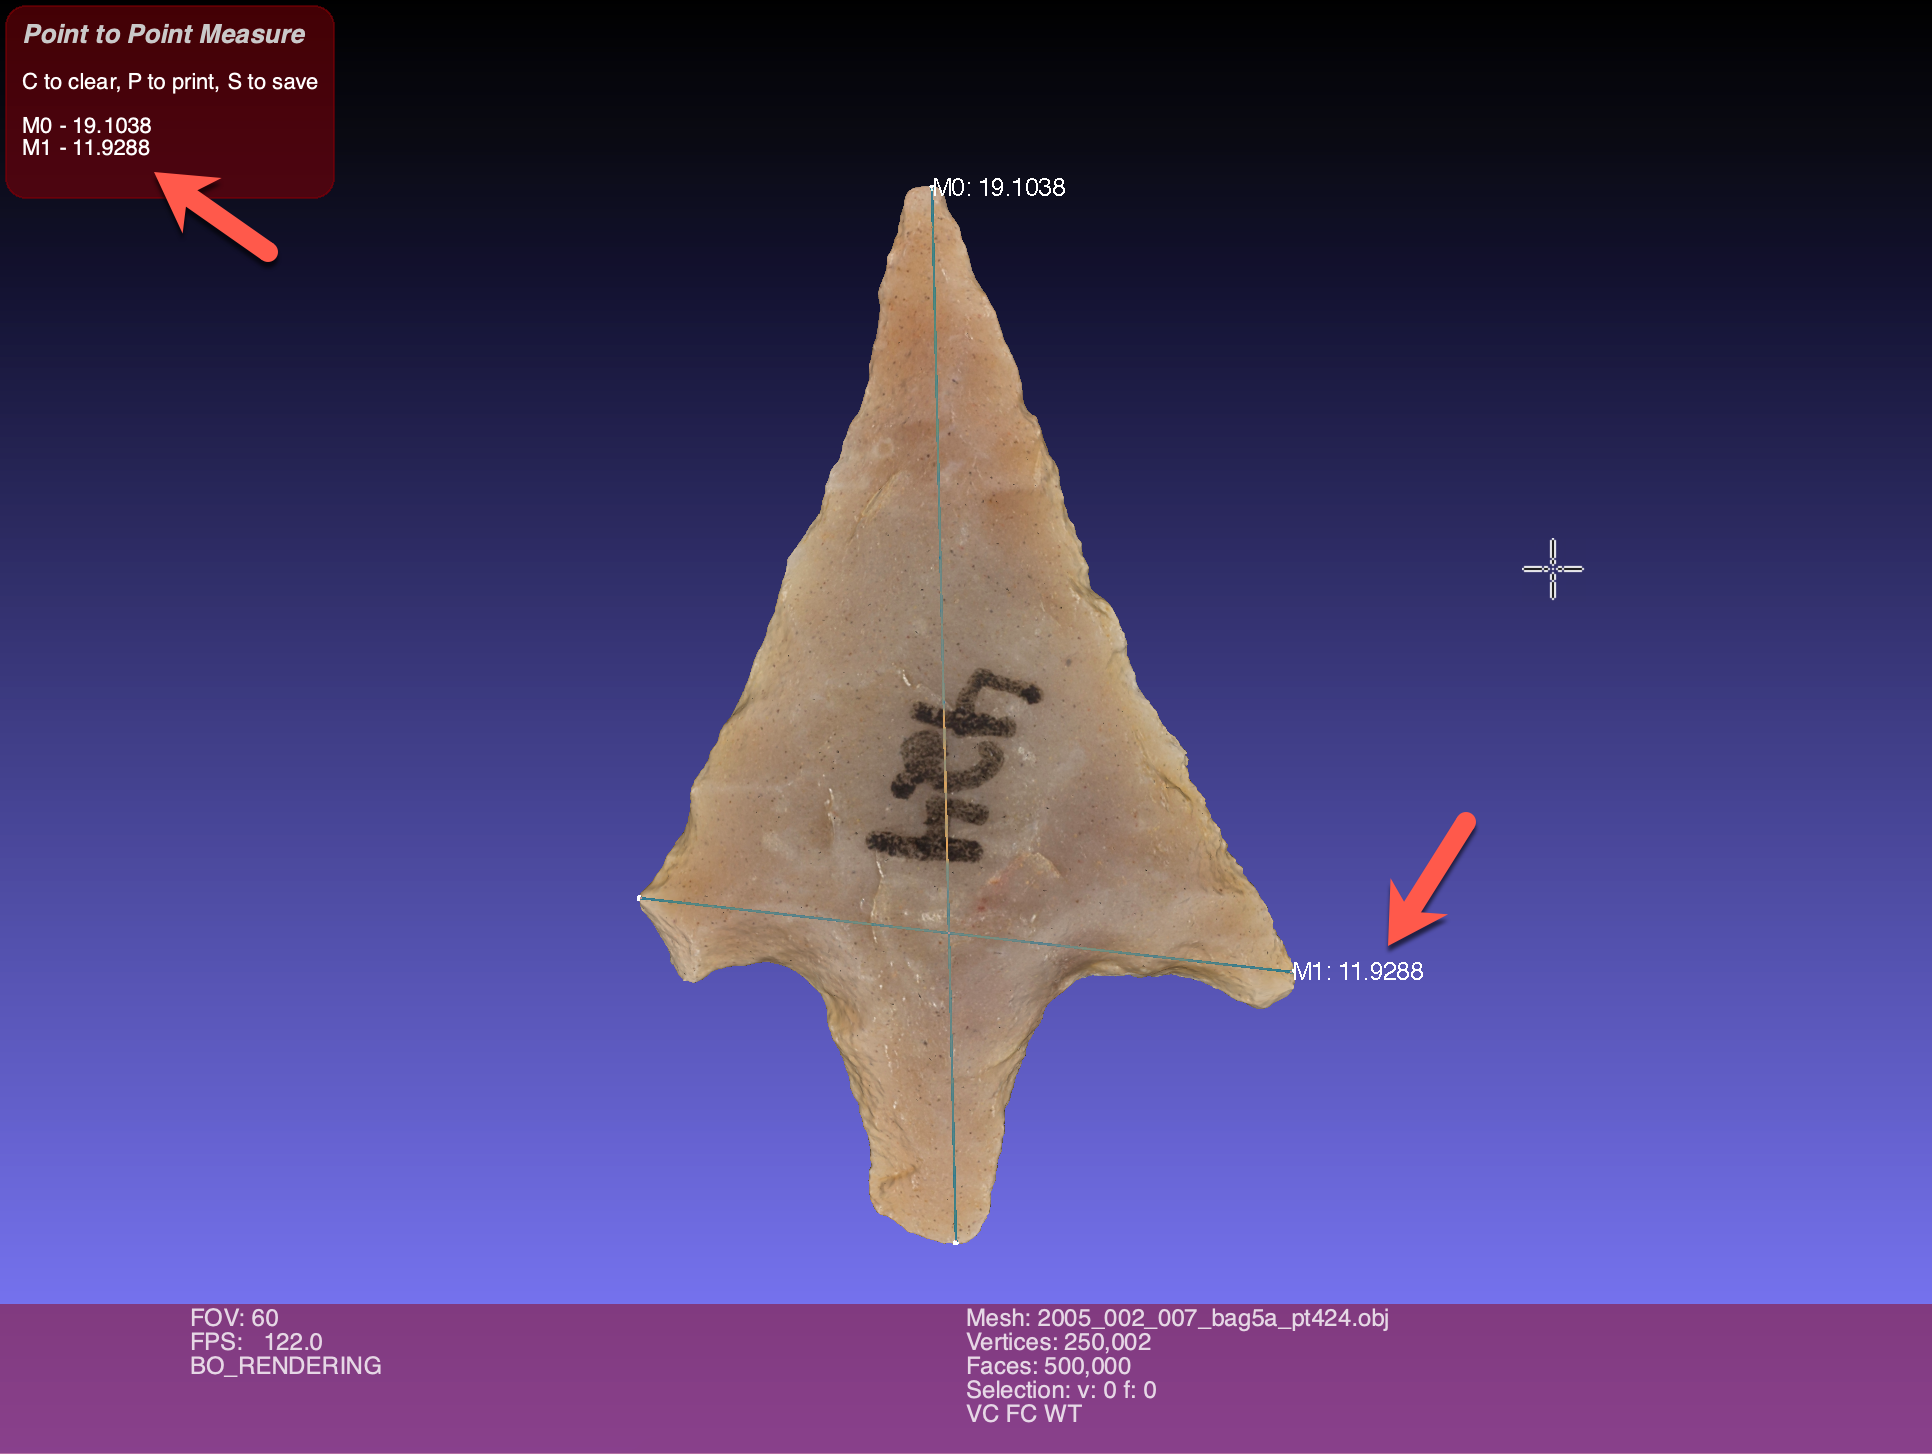
Figure 5. Maximum height and width measurements in millimeters of artifact 2005.002.007 Bag 5a Point 424 using Meshlab.
Angle measurements (Figure 6) are also possible through virtual protractor tools such as OnScreenProtractor (Straffi, 2016).
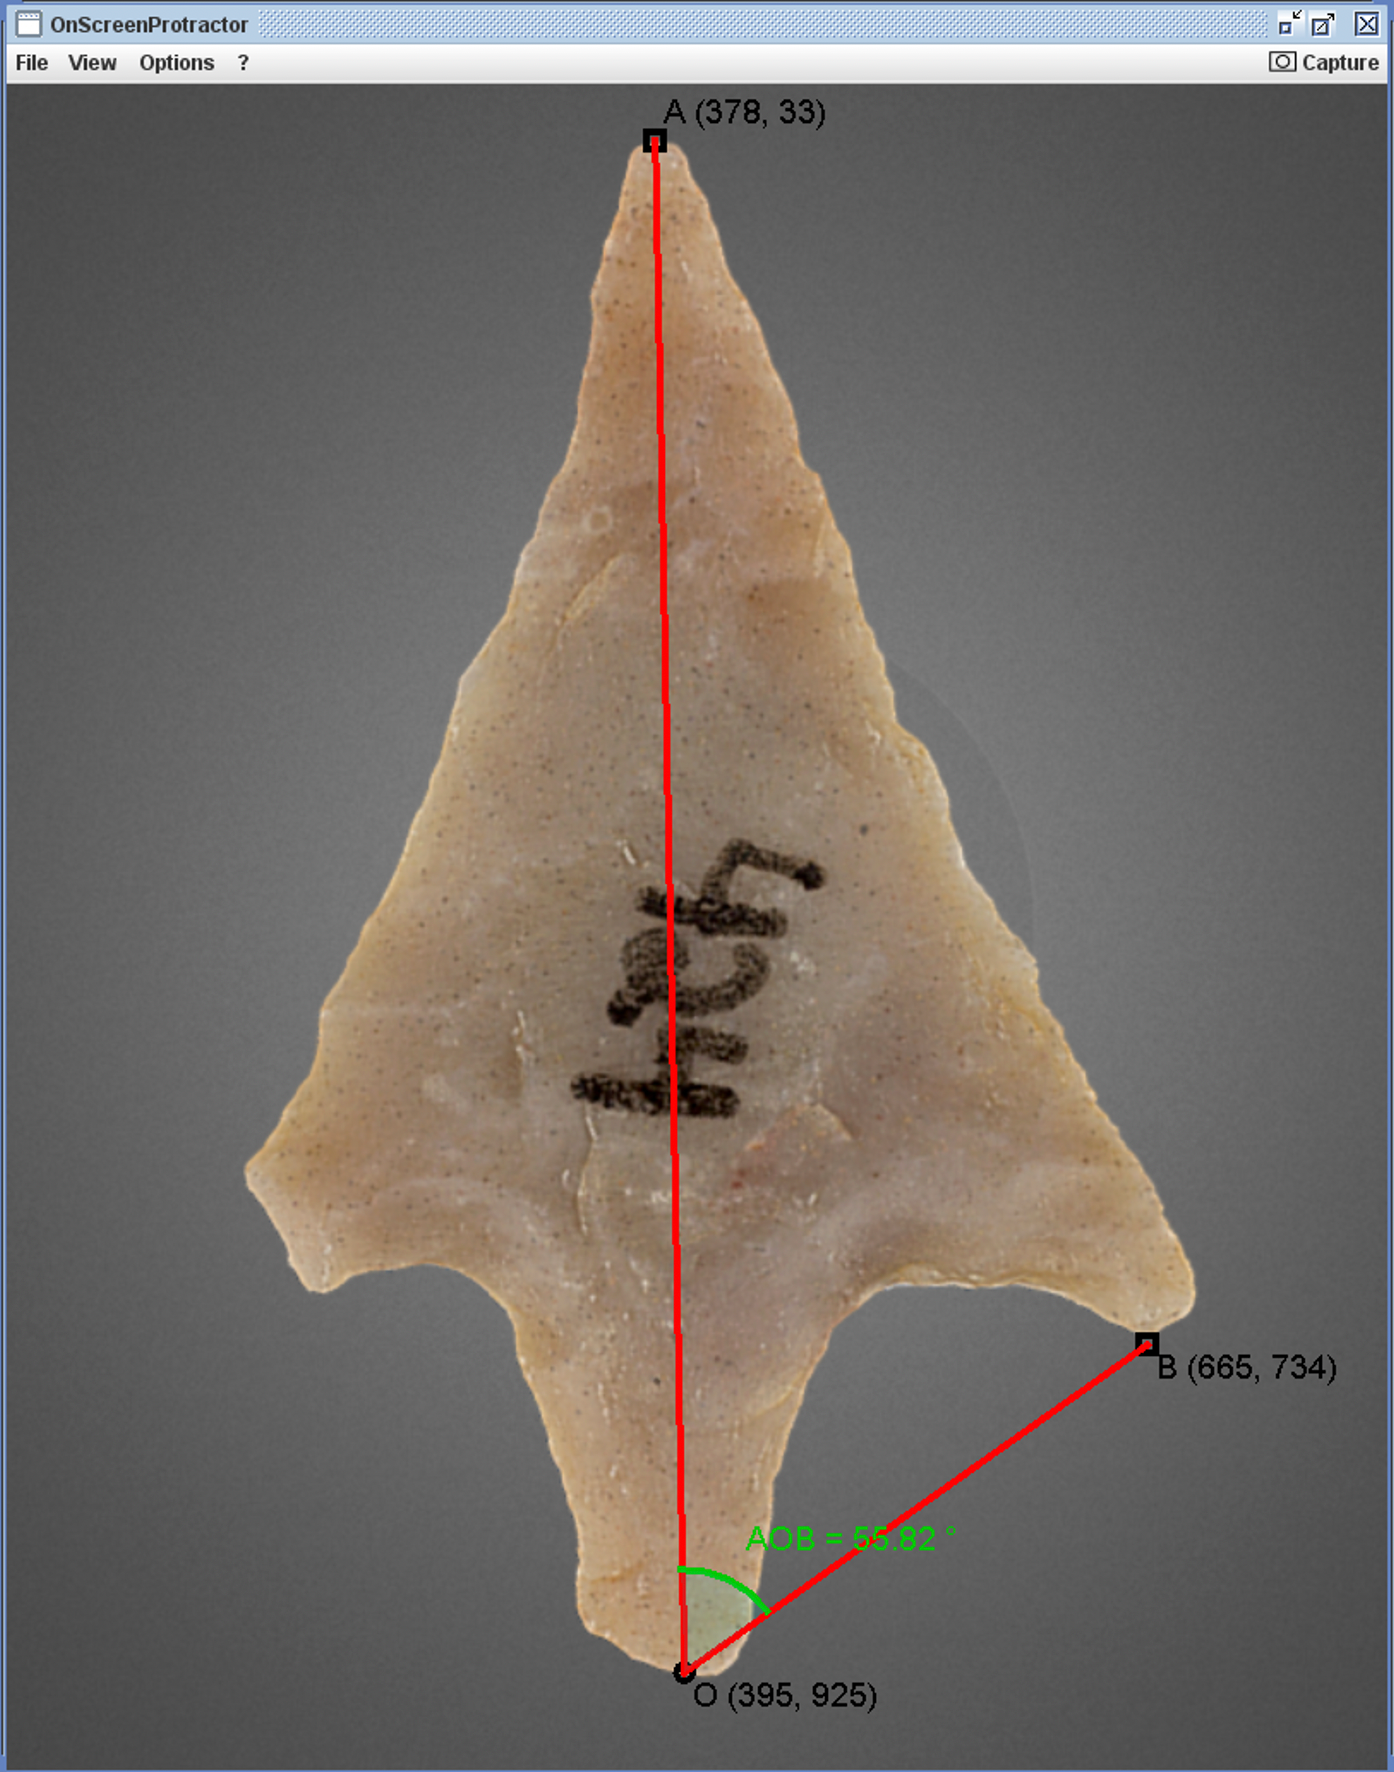
Figure 6. Angle calculation of artifact 2005.002.007 Bag 5a Point 424 using OnScreenProtractor.
Precise cross-section geometric analyses can also be achieved in software from such high quality rendered data. These non-destructive manipulations, which are impractical to conduct on the physical artifacts themselves, can open up new lines of inquiry with relative ease. For example, cross-sections can be deftly sliced, measured, and exported for further examination from Meshlab (Figures 7-9). From these, automated artifact classification based on 3D shape or profile can be accomplished.
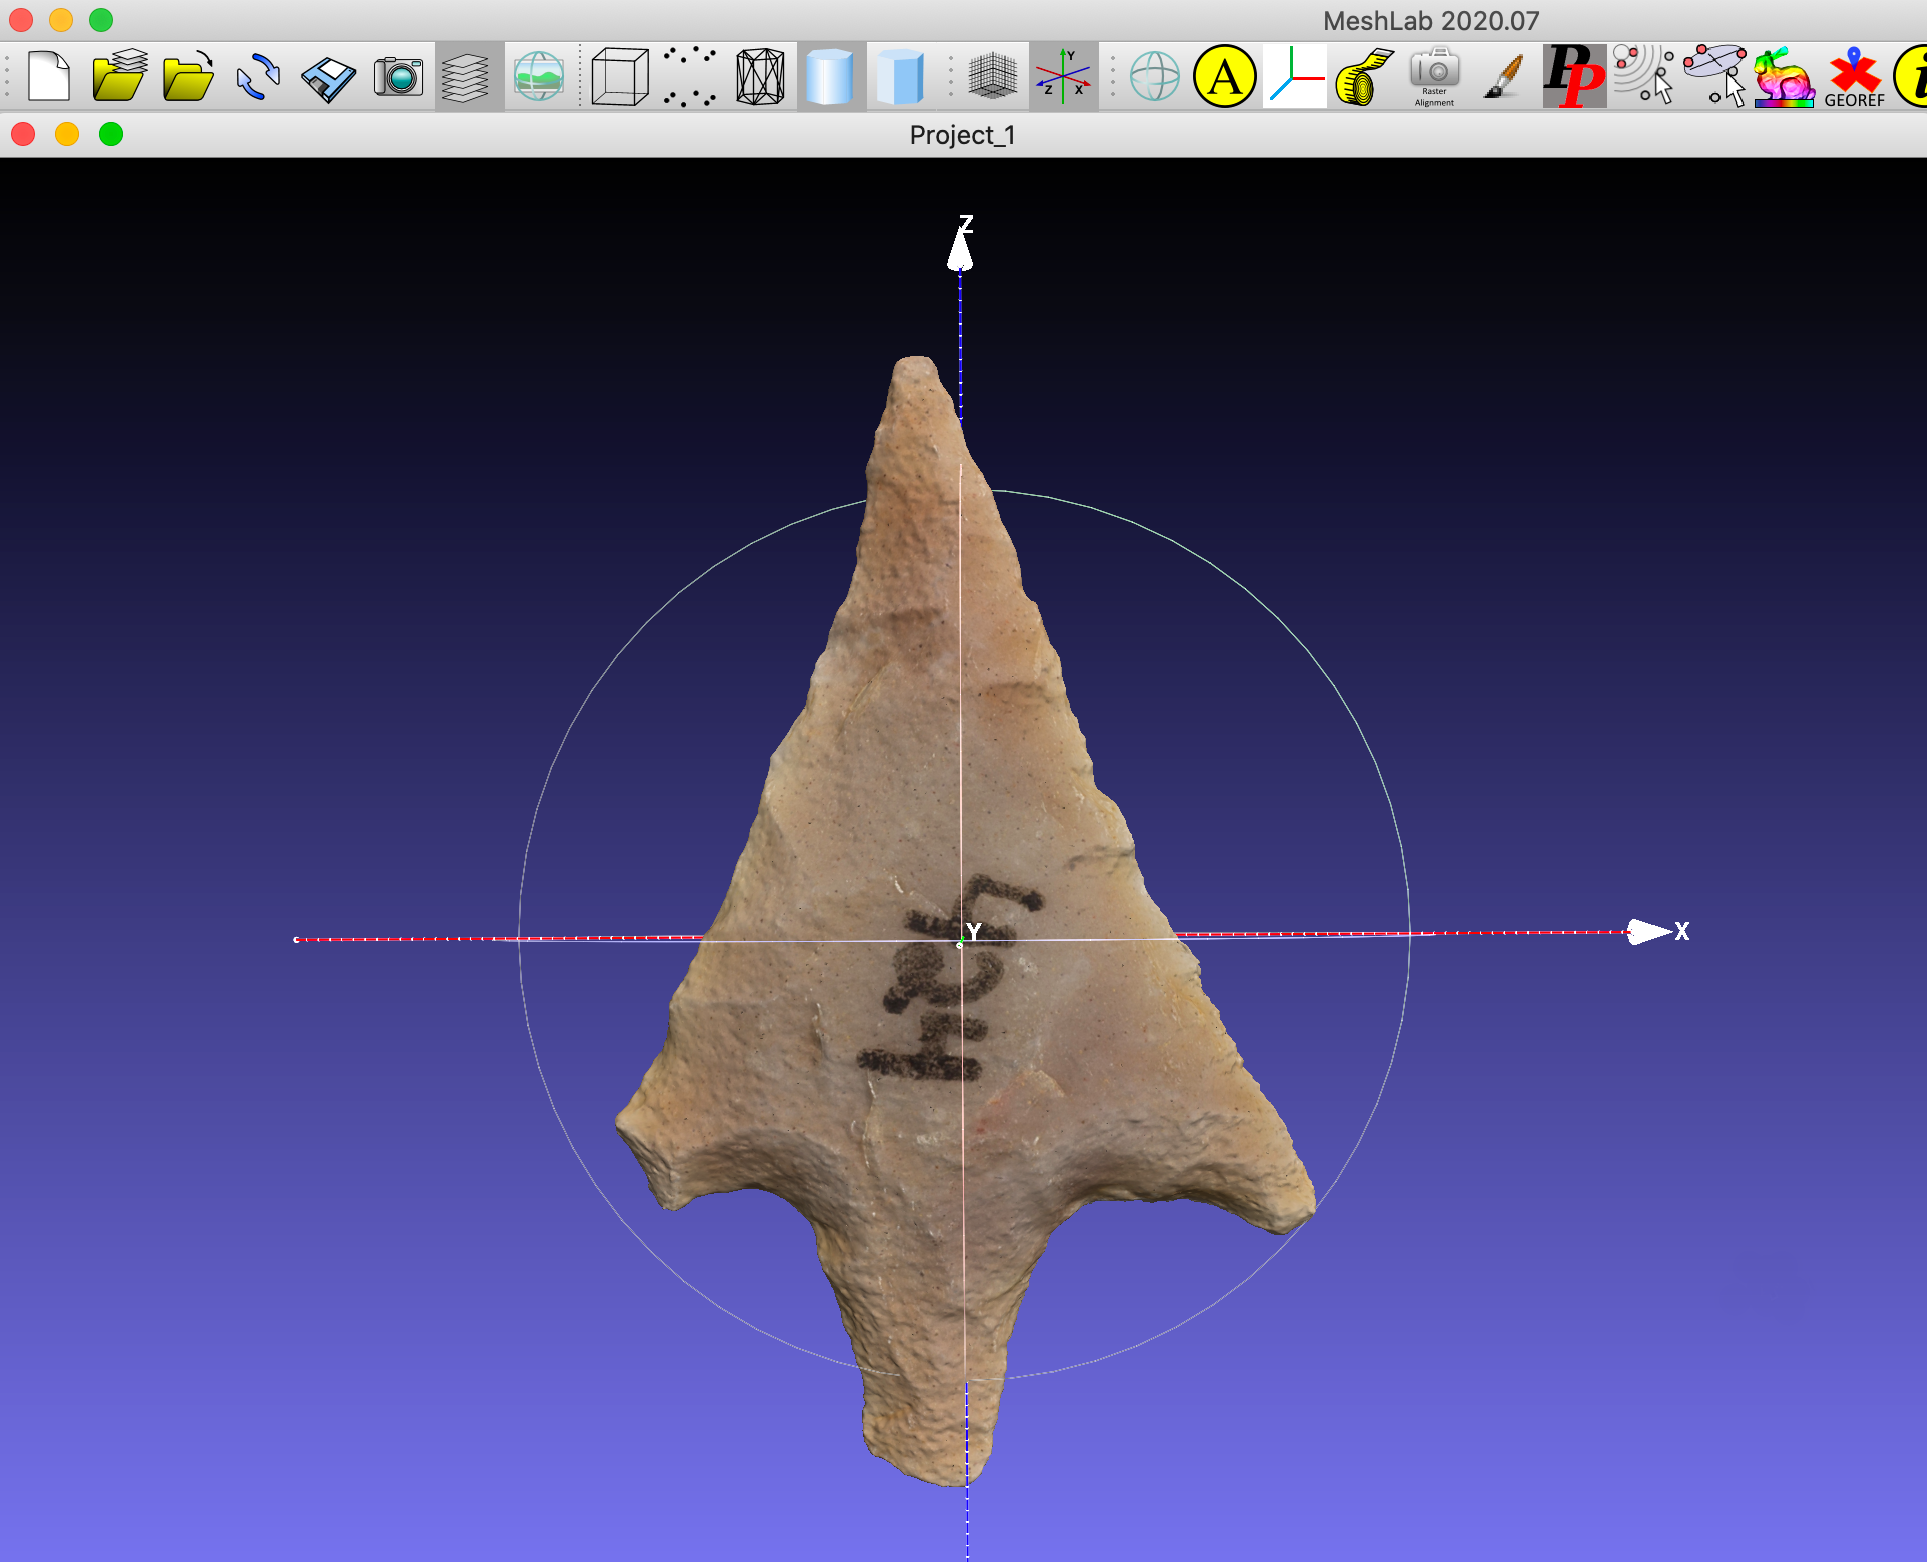
Figure 7. Artifact 2005.002.007 Bag 5a Point 424 centered to XYZ world coordinates in Meshlab.
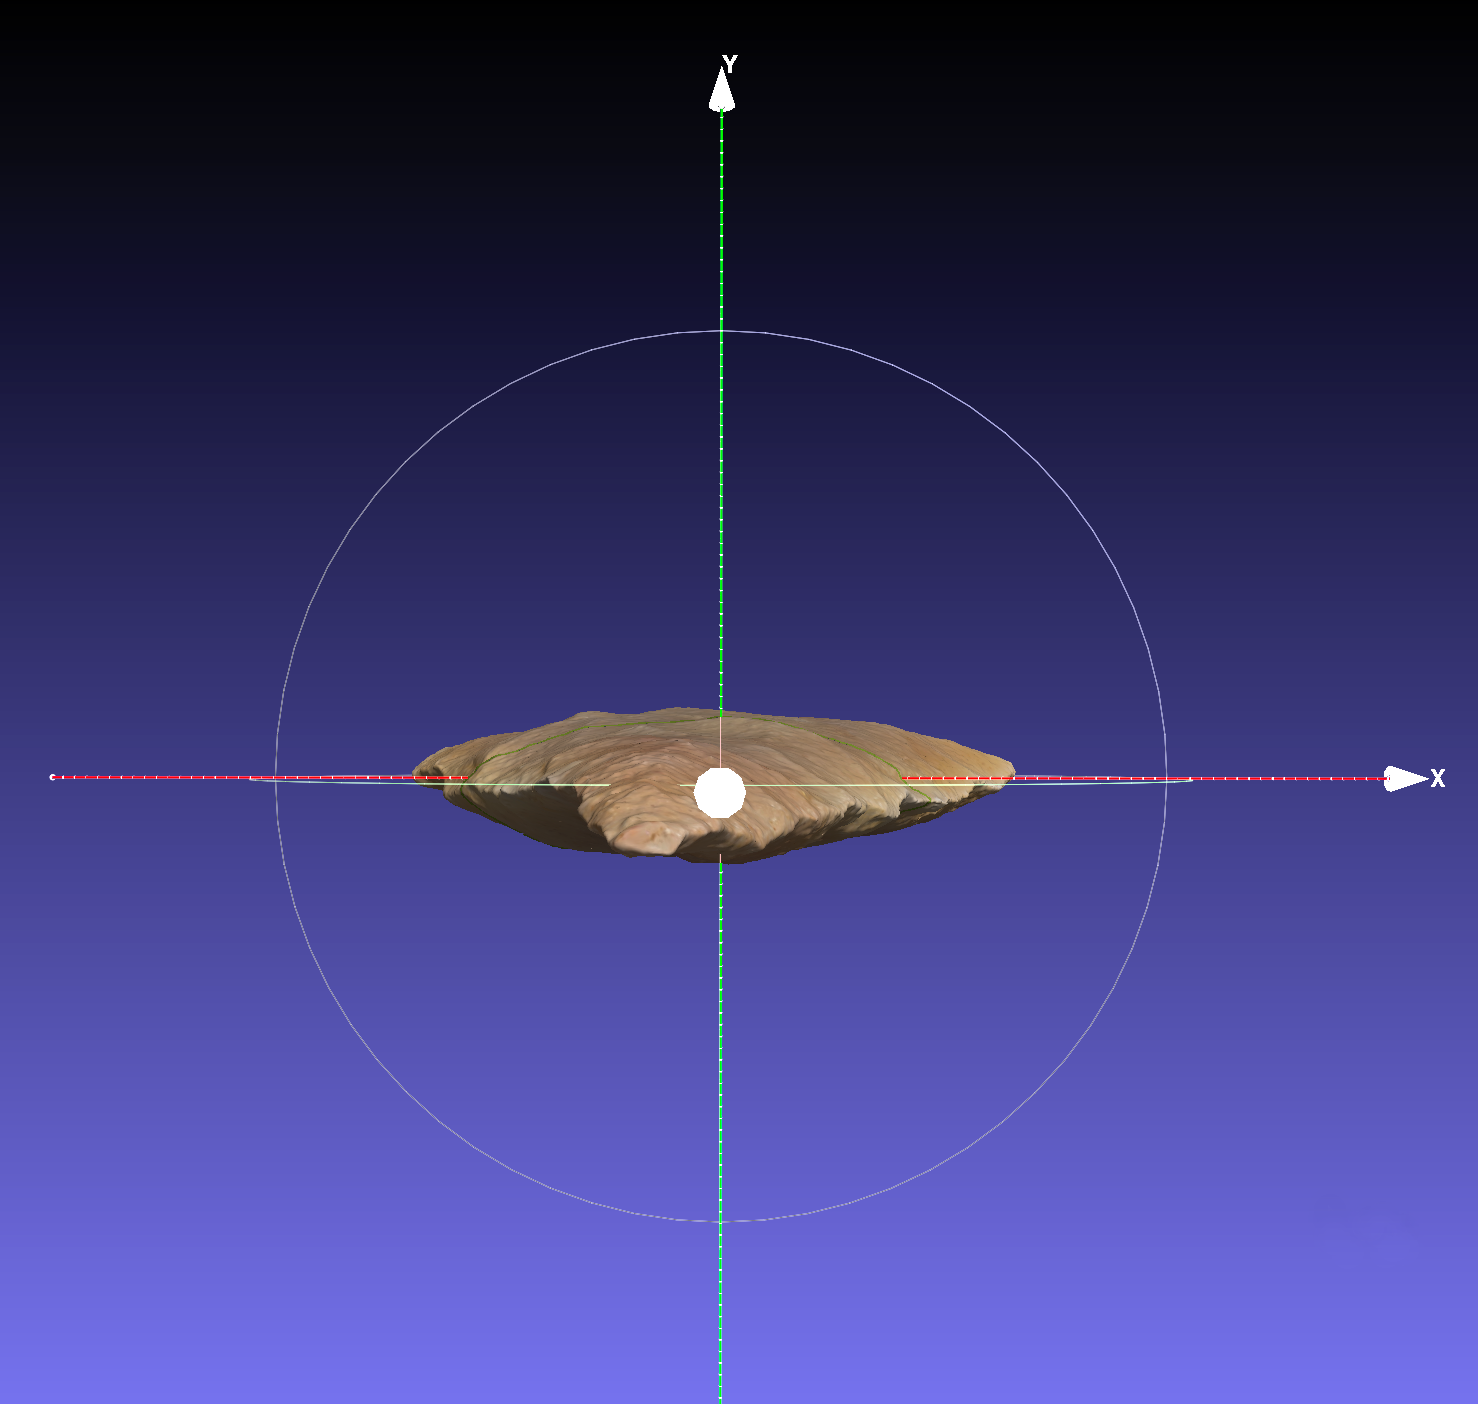
Figure 8. Artifact 2005.002.007 Bag 5a Point 424 rotated 90° along Z axis in Meshlab. Top of point facing viewer.
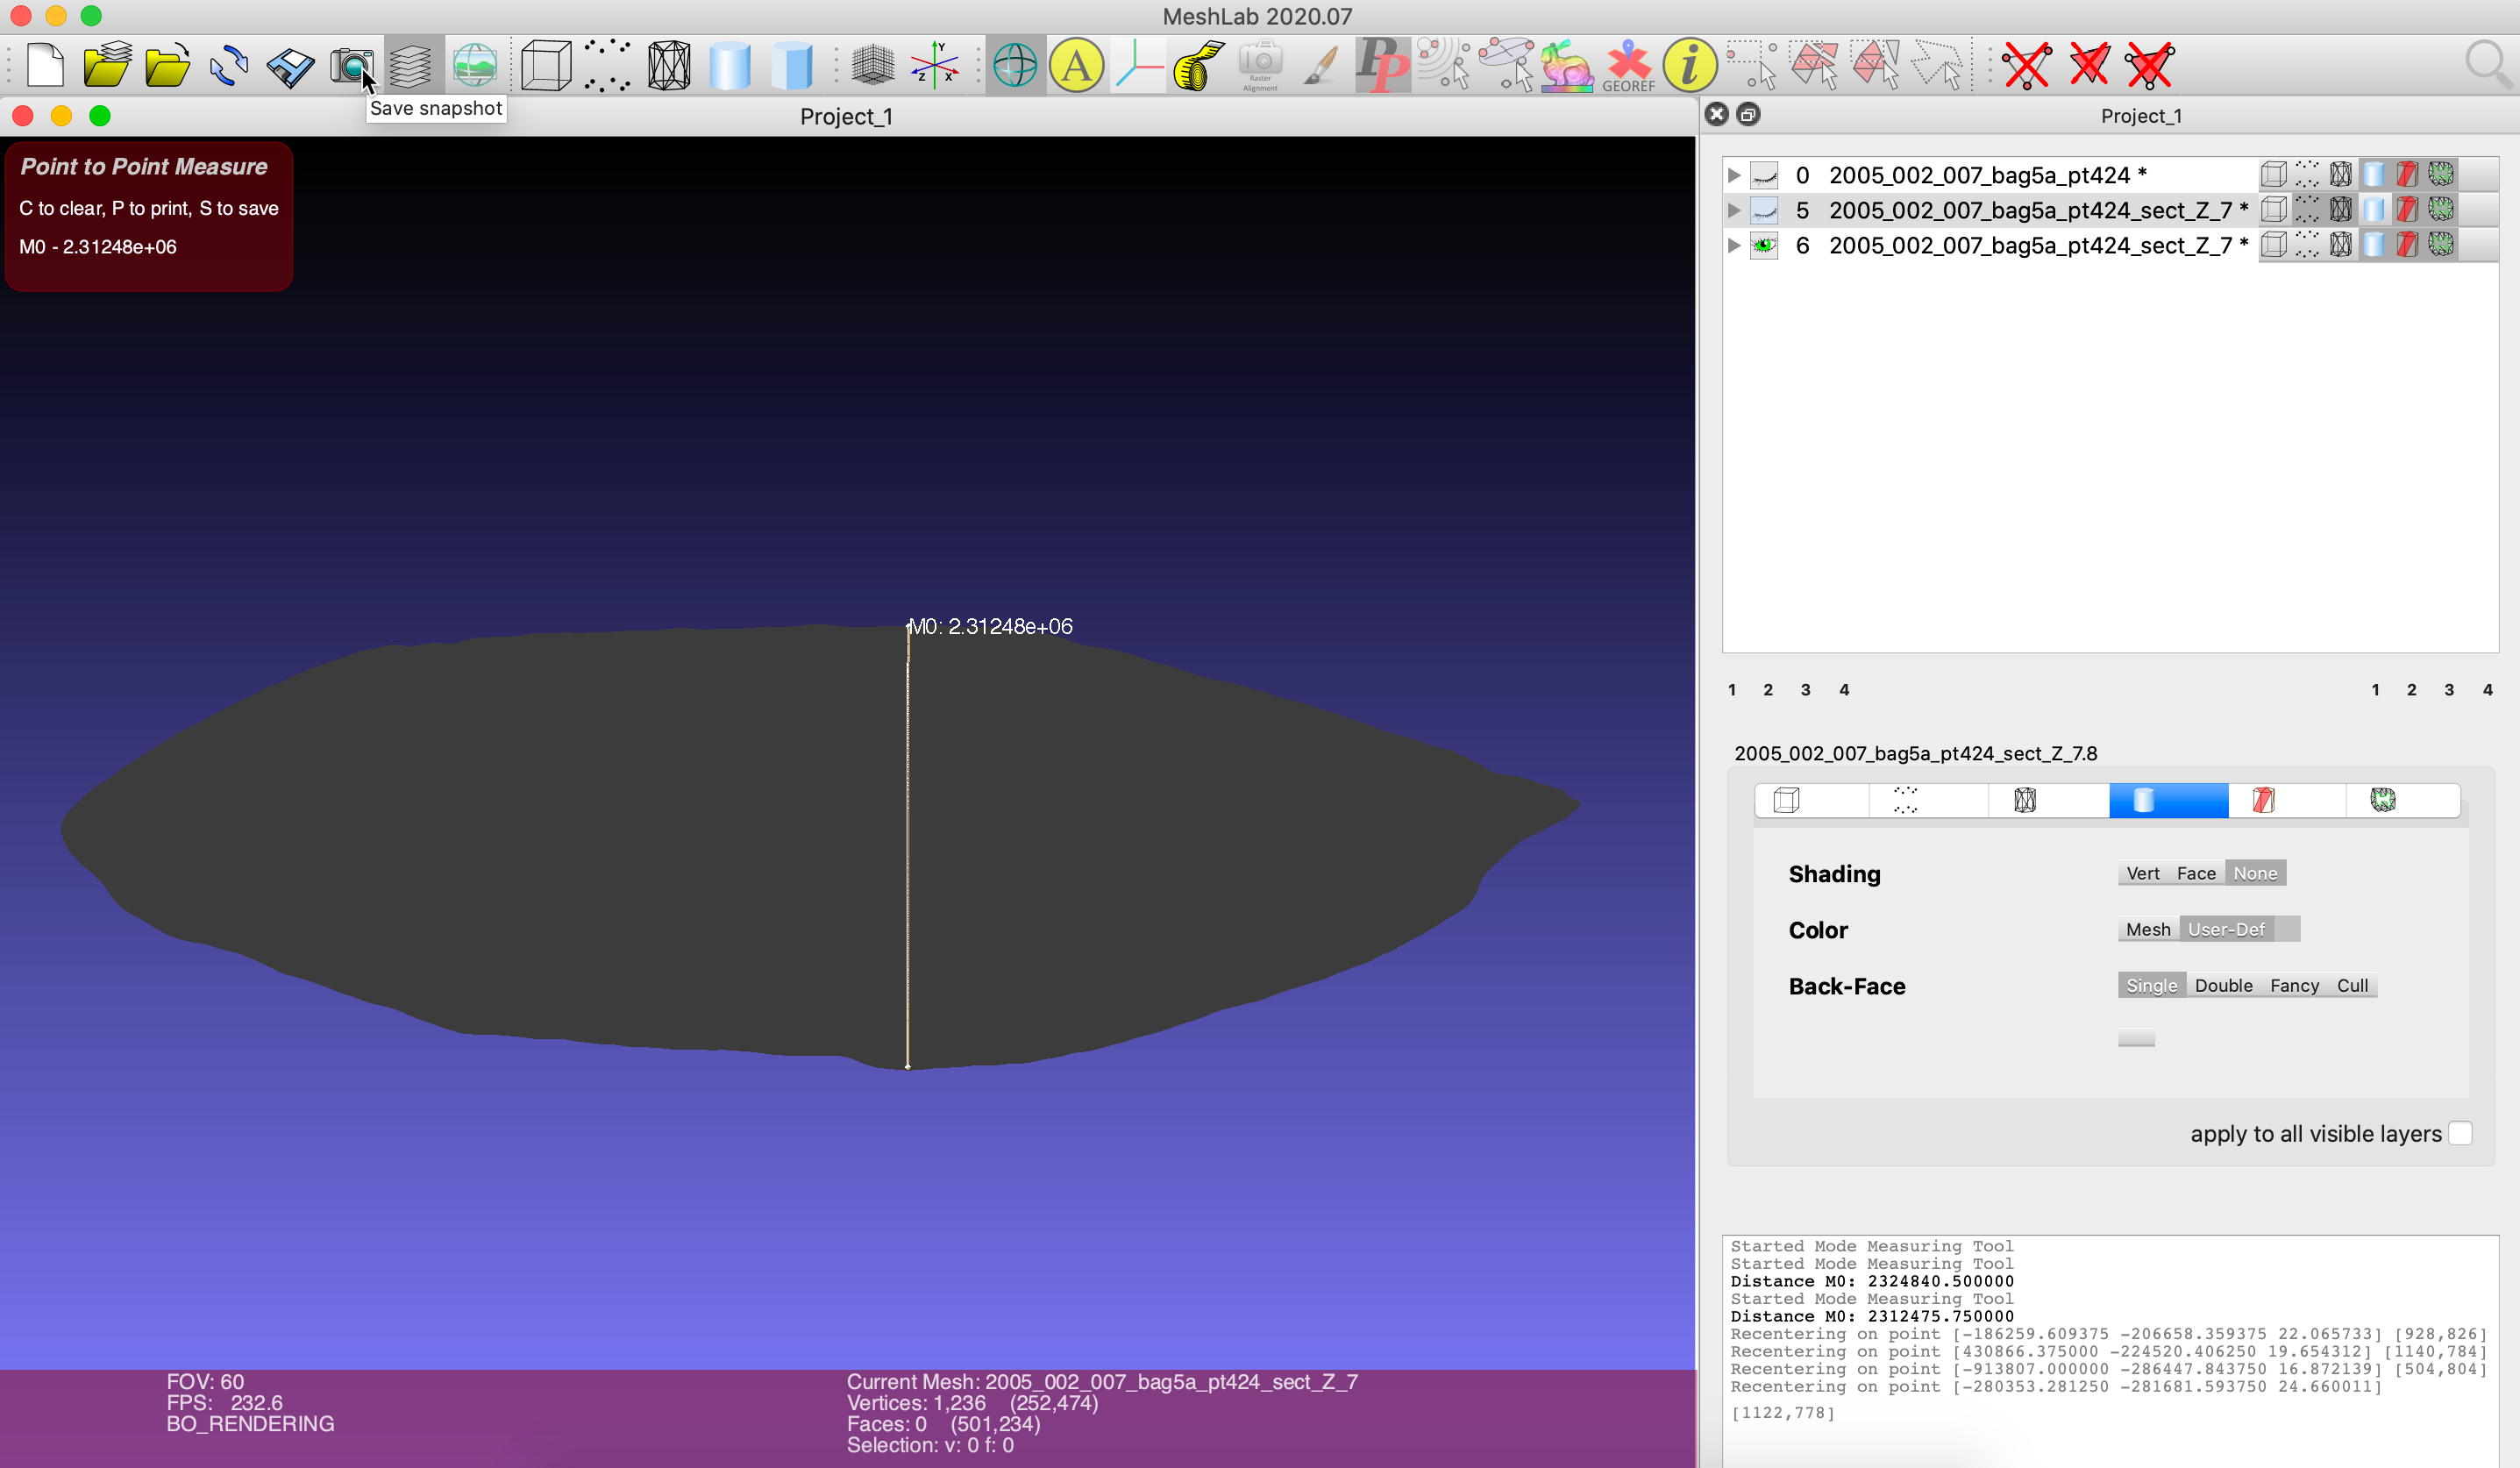
Figure 9. Cross-section of artifact 2005.002.007 Bag 5a Point 424 measured in Meshlab.
Geometric measurements made of cross-sections in Meshlab can also be combined with various angle calculations using OnScreenProtractor (Figure 10).
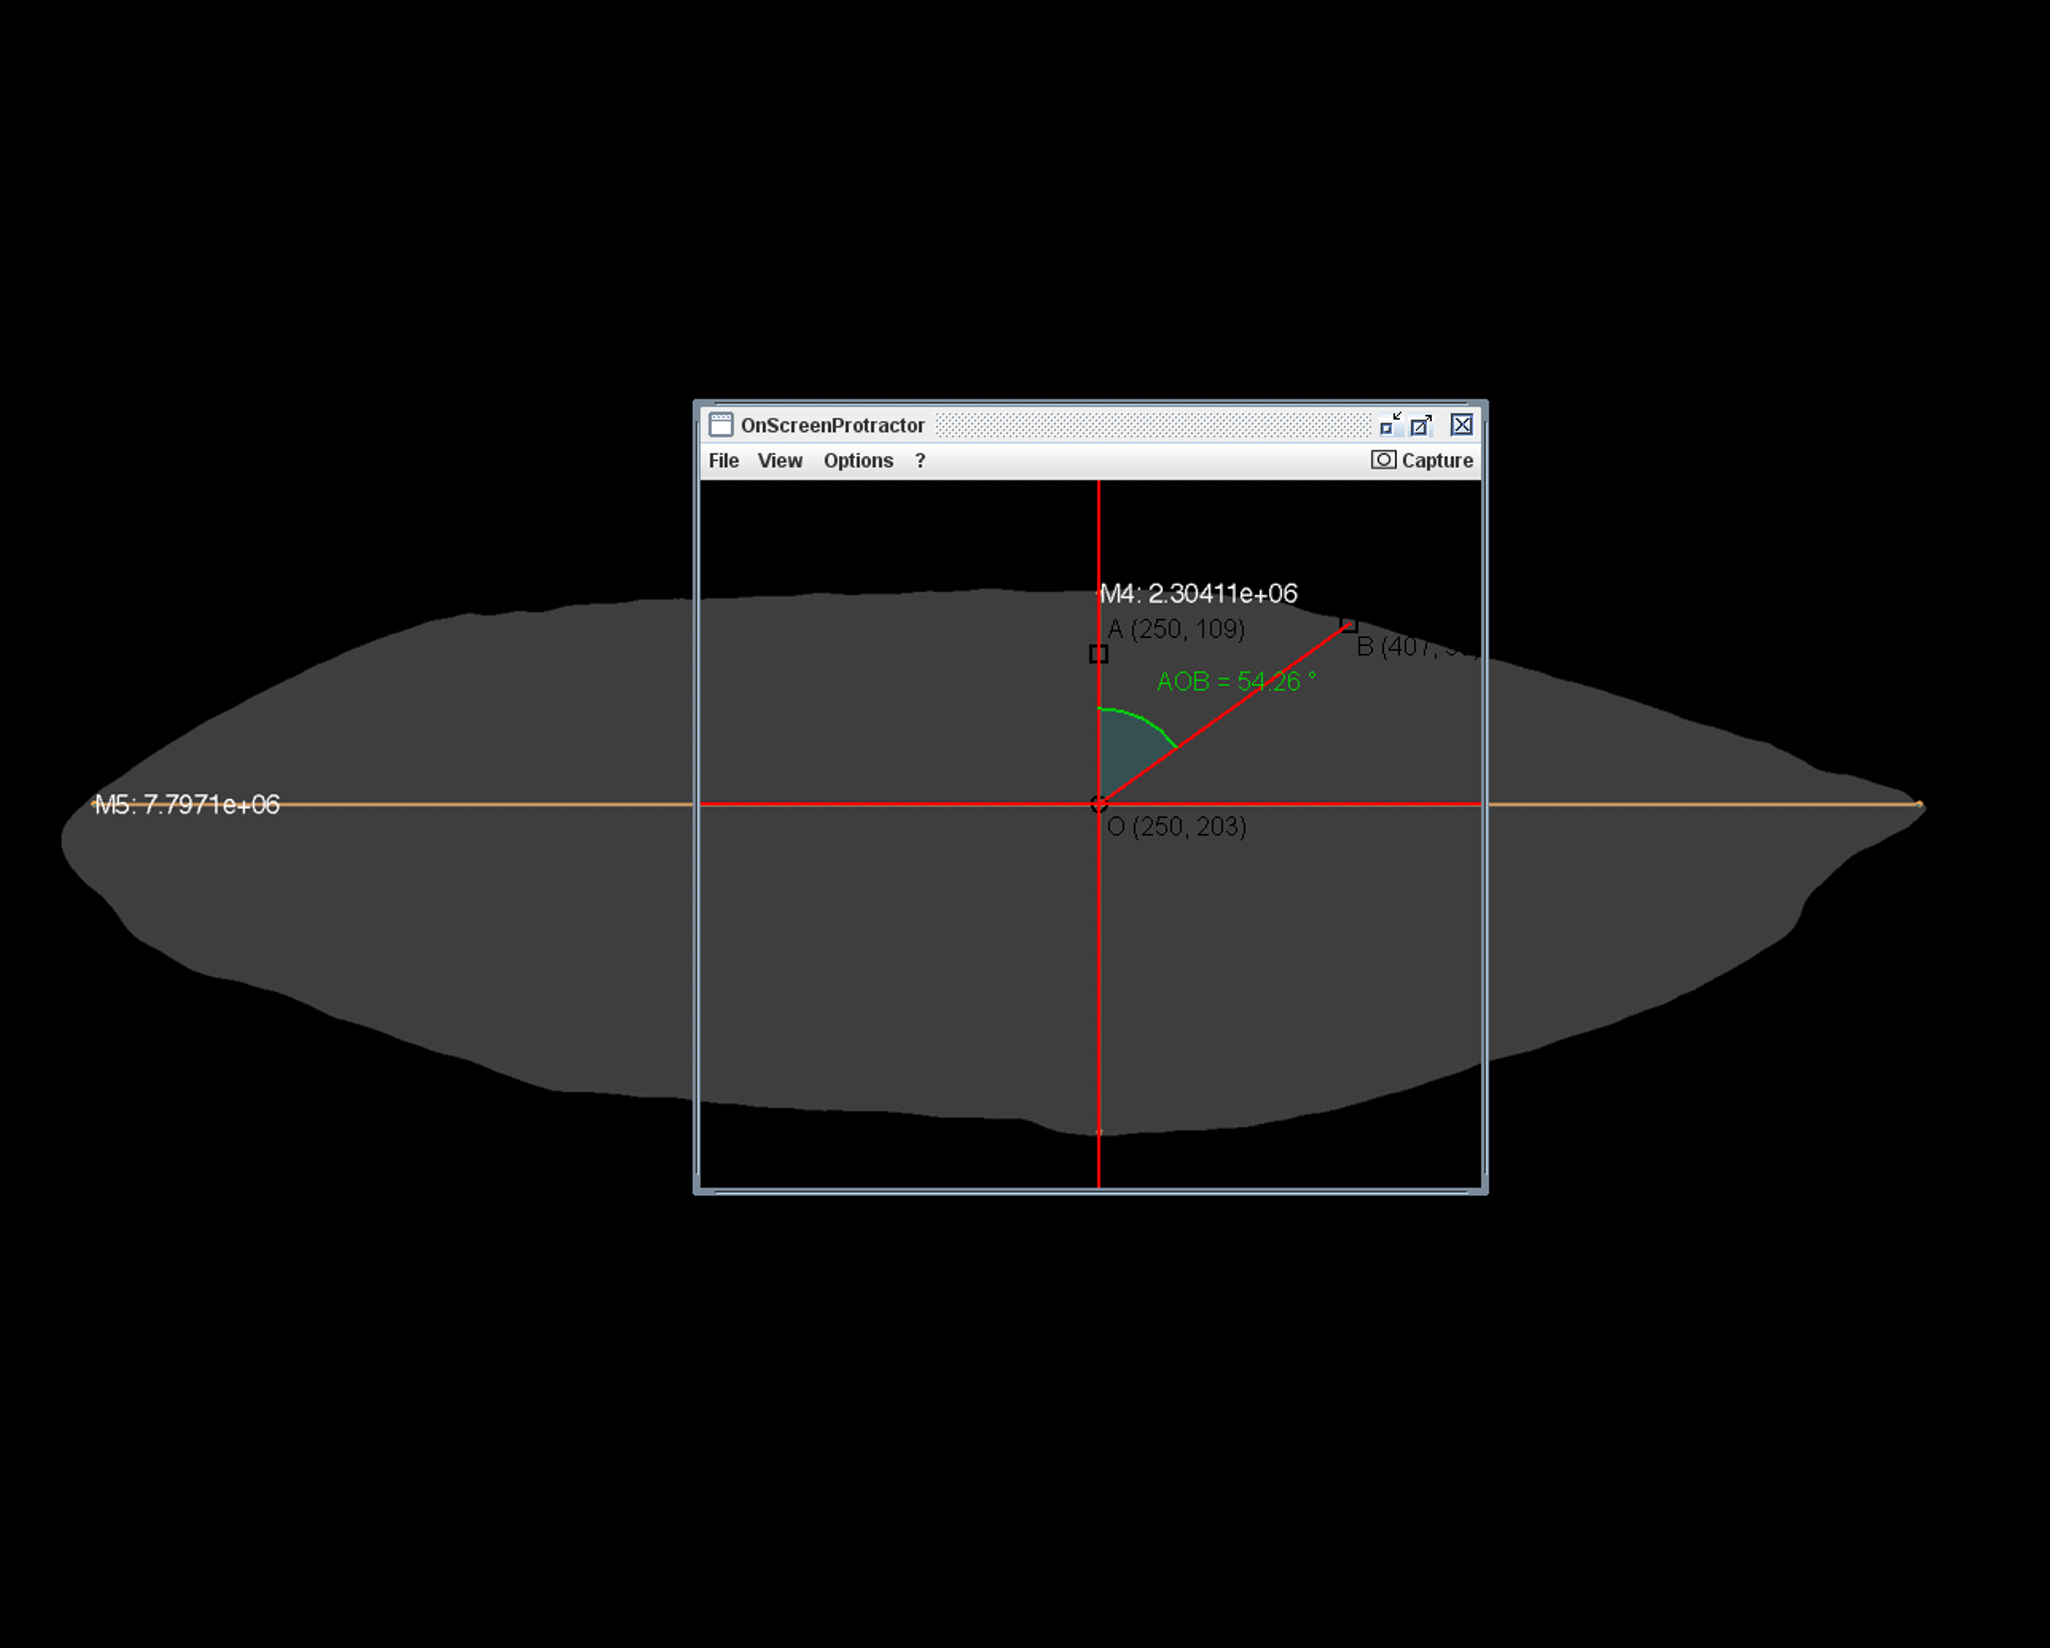
Figure 10. Combining measured cross-section in Meshlab with angle calculations made with OnScreenProtractor tool.
Lithics can also be illuminated in Meshlab by various virtual light sources from different directions (Figure 11). As a result light can be raked by the user across surface features to help bring out fine textured geometry.
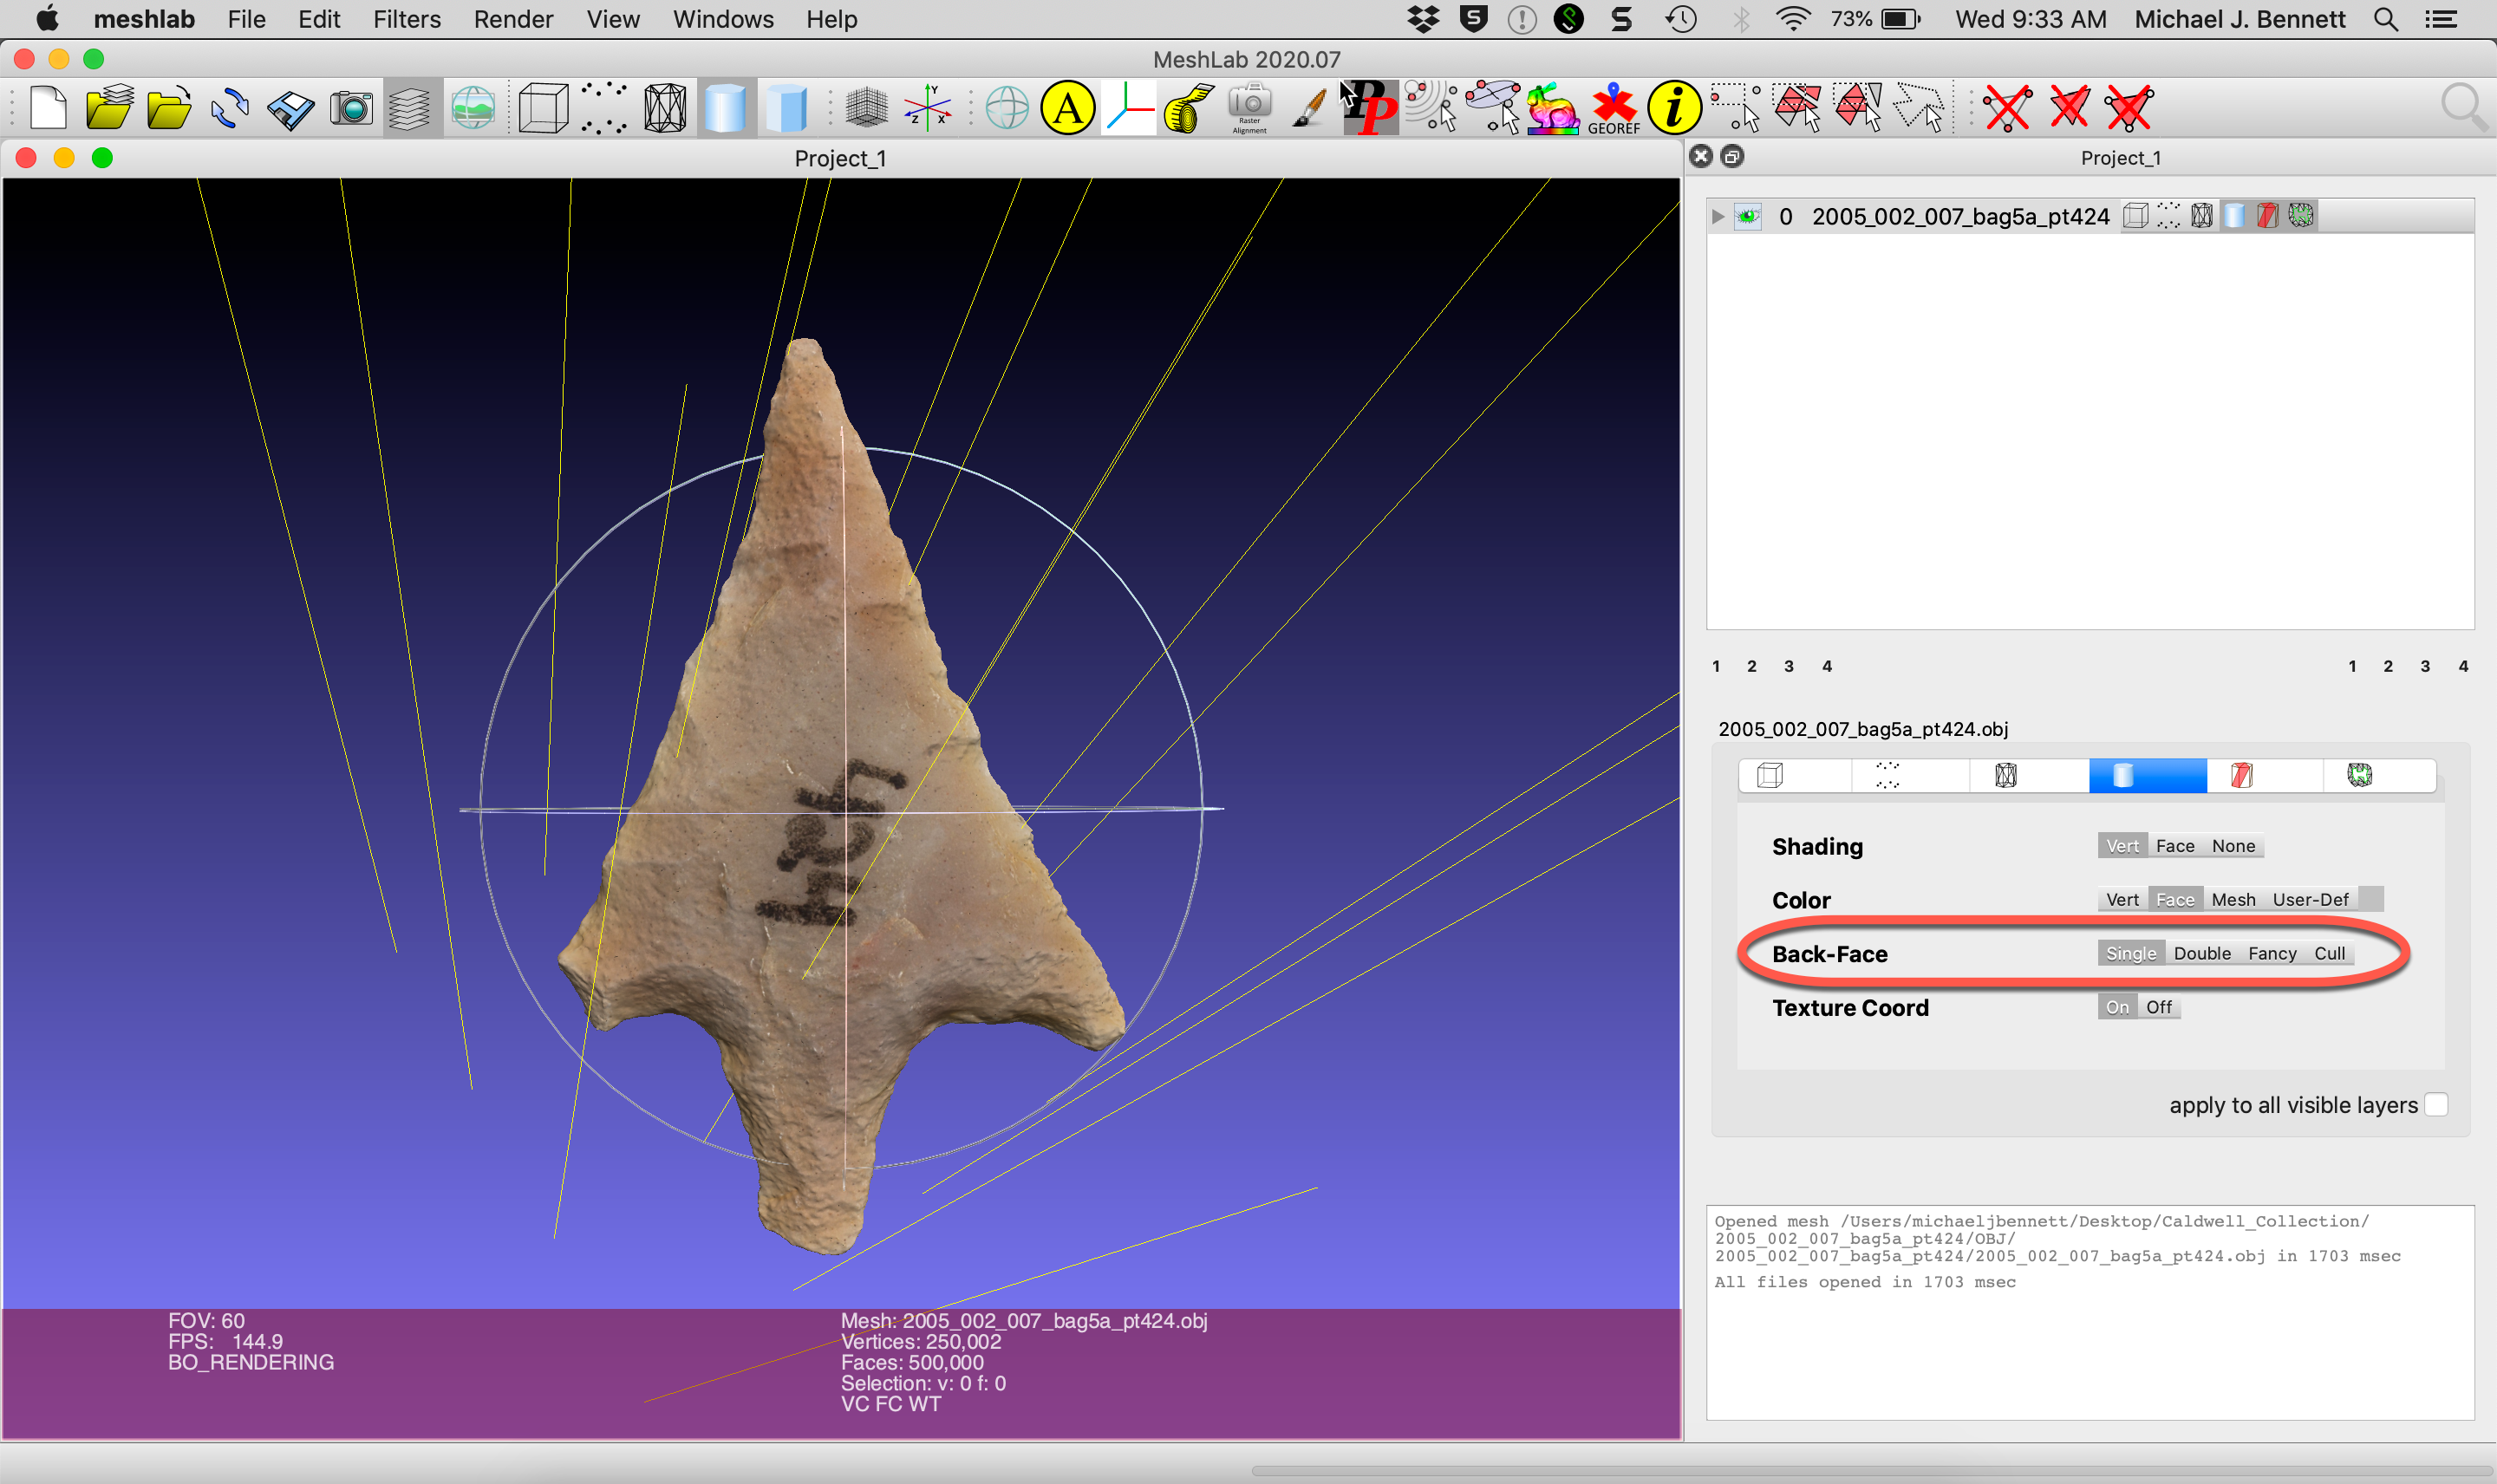
Figure 11. Raking light from a single light source in Meshlab.
These visual details, in turn, can be further highlighted by Meshlab’s UnSharp Mask Geometry filter. Features can also be easily measured to sub-millimeter levels of precision from the rich 3D data acquired and processed in this study (Figure 12).
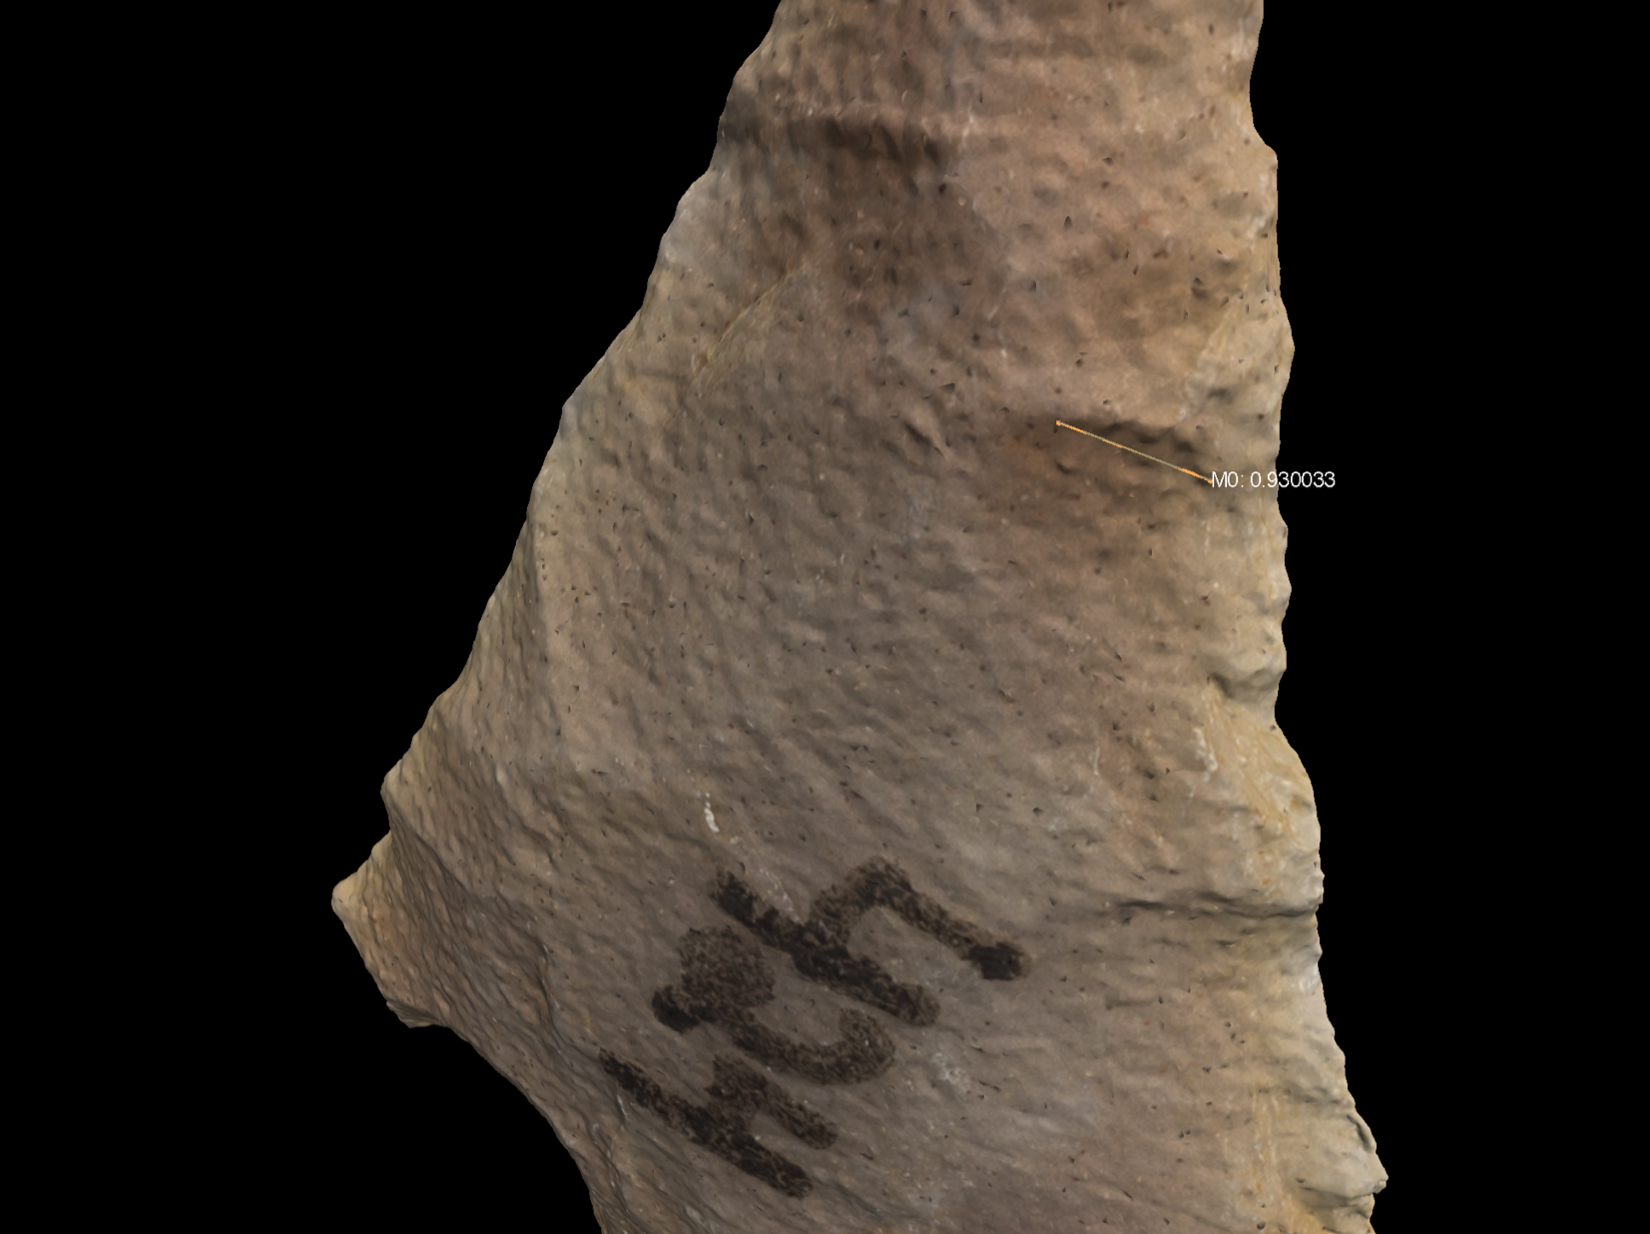
Figure 12. Visual sub-millimeter detail of artifact 2005.002.007 Bag 5a Point 424 measured in Meshlab and enhanced with raking light and the application of the program’s UnSharp Mask Geometry filter.
Sketchfab (Figure 13) also offers similar dynamic, user-controlled lighting within the browser for models processed with shading.
Figure 13. Animated detail of user-controlled raking illumination in Sketchfab of artifact 2005.002.007 Bag 5a Point 447 – shaded version, https://skfb.ly/6ZGSK
Additionally, untextured, solid model visualizations can be further rendered through Meshlab, Metashape Pro, and Sketchfab shaders as well. These can bring out extremely detailed characteristics of negative surface scarring left by the original manufacturing process and ripples in the rock for close surface analysis (Figures 14-16).
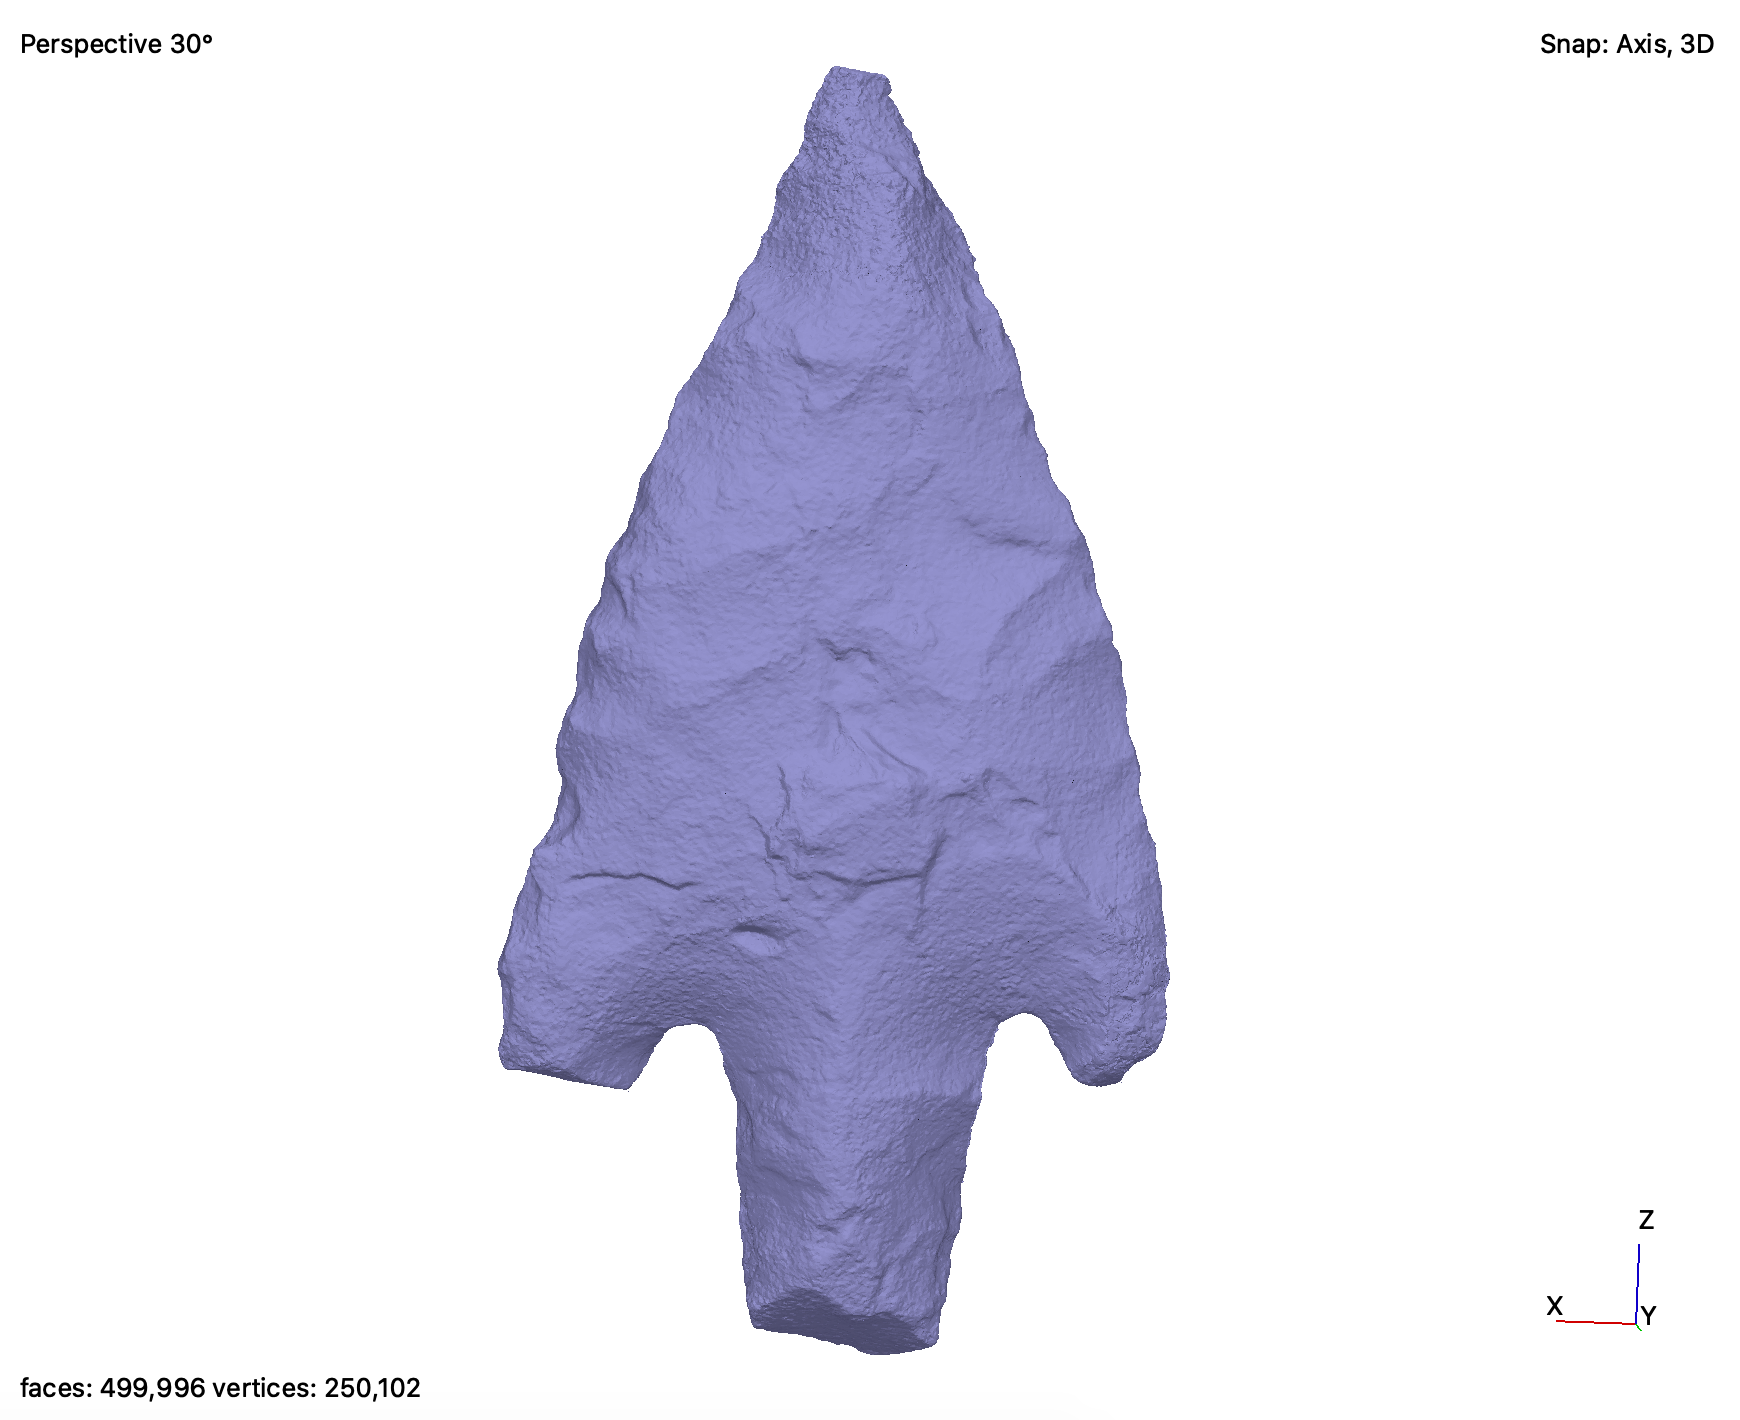
Figure 14. Untextured, solid model of artifact 2005.002.007 Bag5a Point 459 in Metashape Pro.
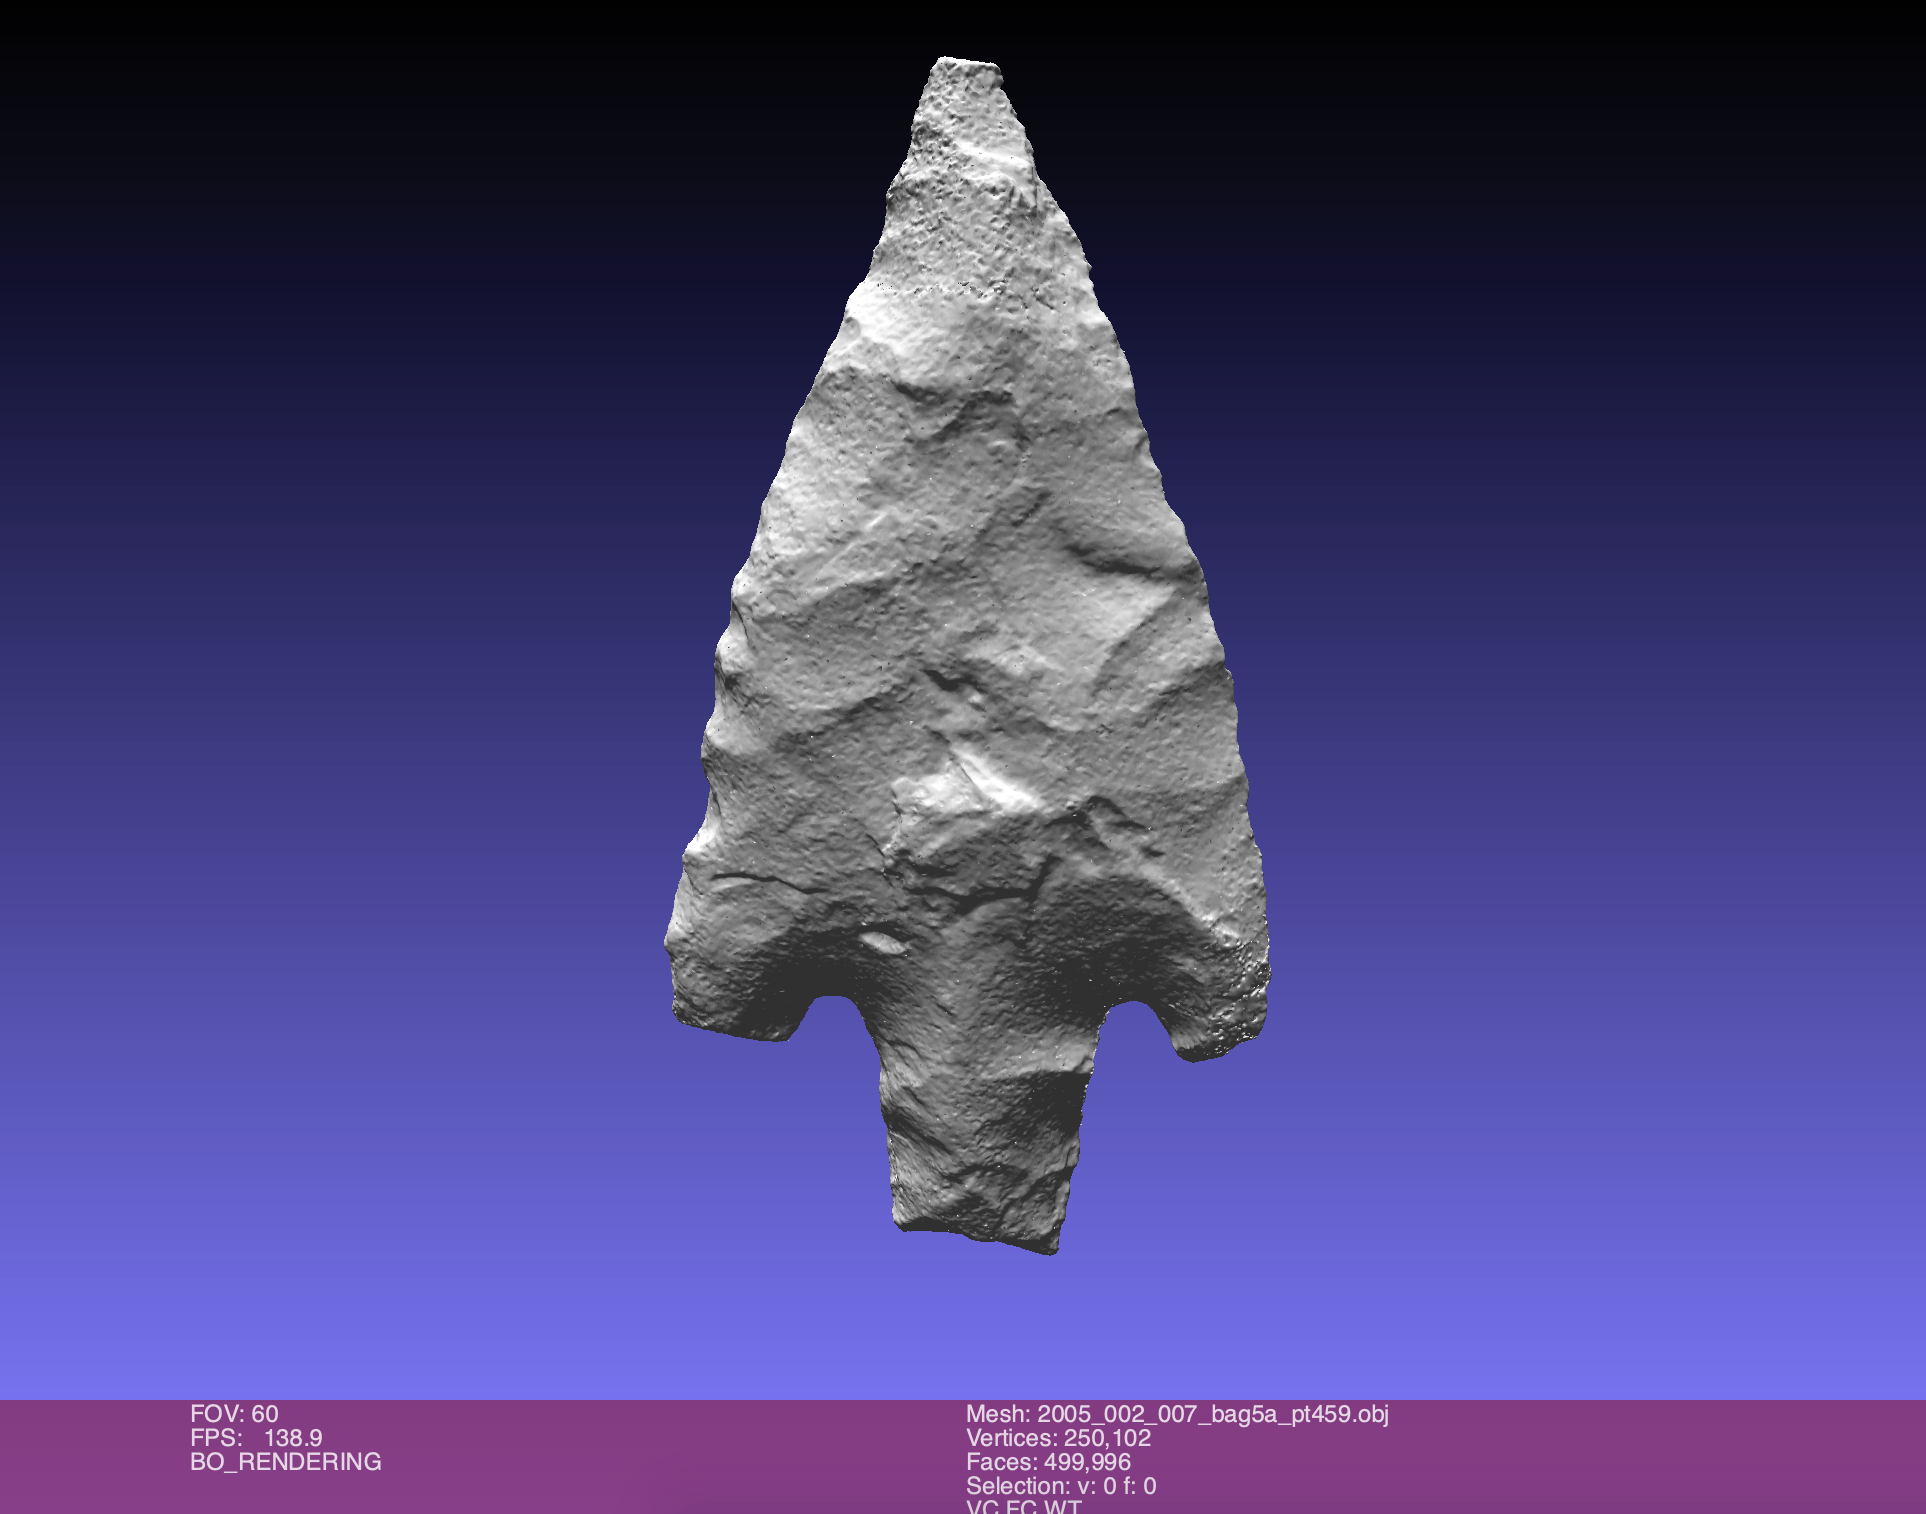
Figure 15. Untextured, solid model of artifact 2005.002.007 Bag5a Point 459 in Meshlab.
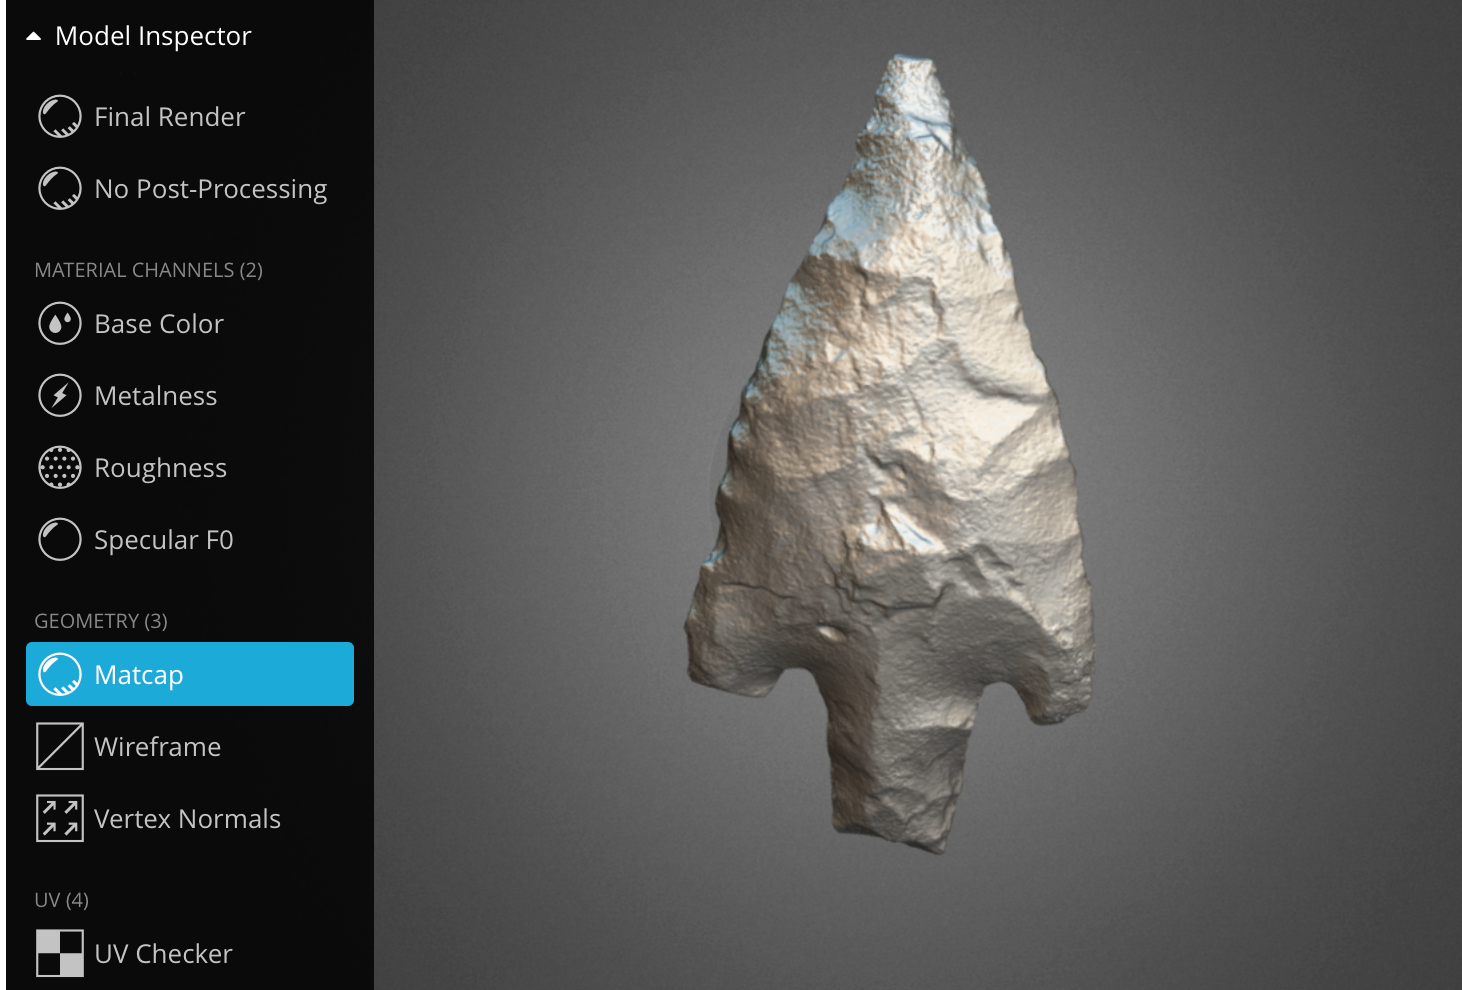
Figure 16. Untextured, solid model of artifact 2005.002.007 Bag5a Point 459 in Sketchfab, https://skfb.ly/6YAA6
Finally, simply zooming and panning into and around the textured models can give deep visual insight into the various sub-millimeter inclusions in the rock itself (Figure 17). Such details can help investigators better answer questions on the types of raw materials that were used in lithic industries through time.
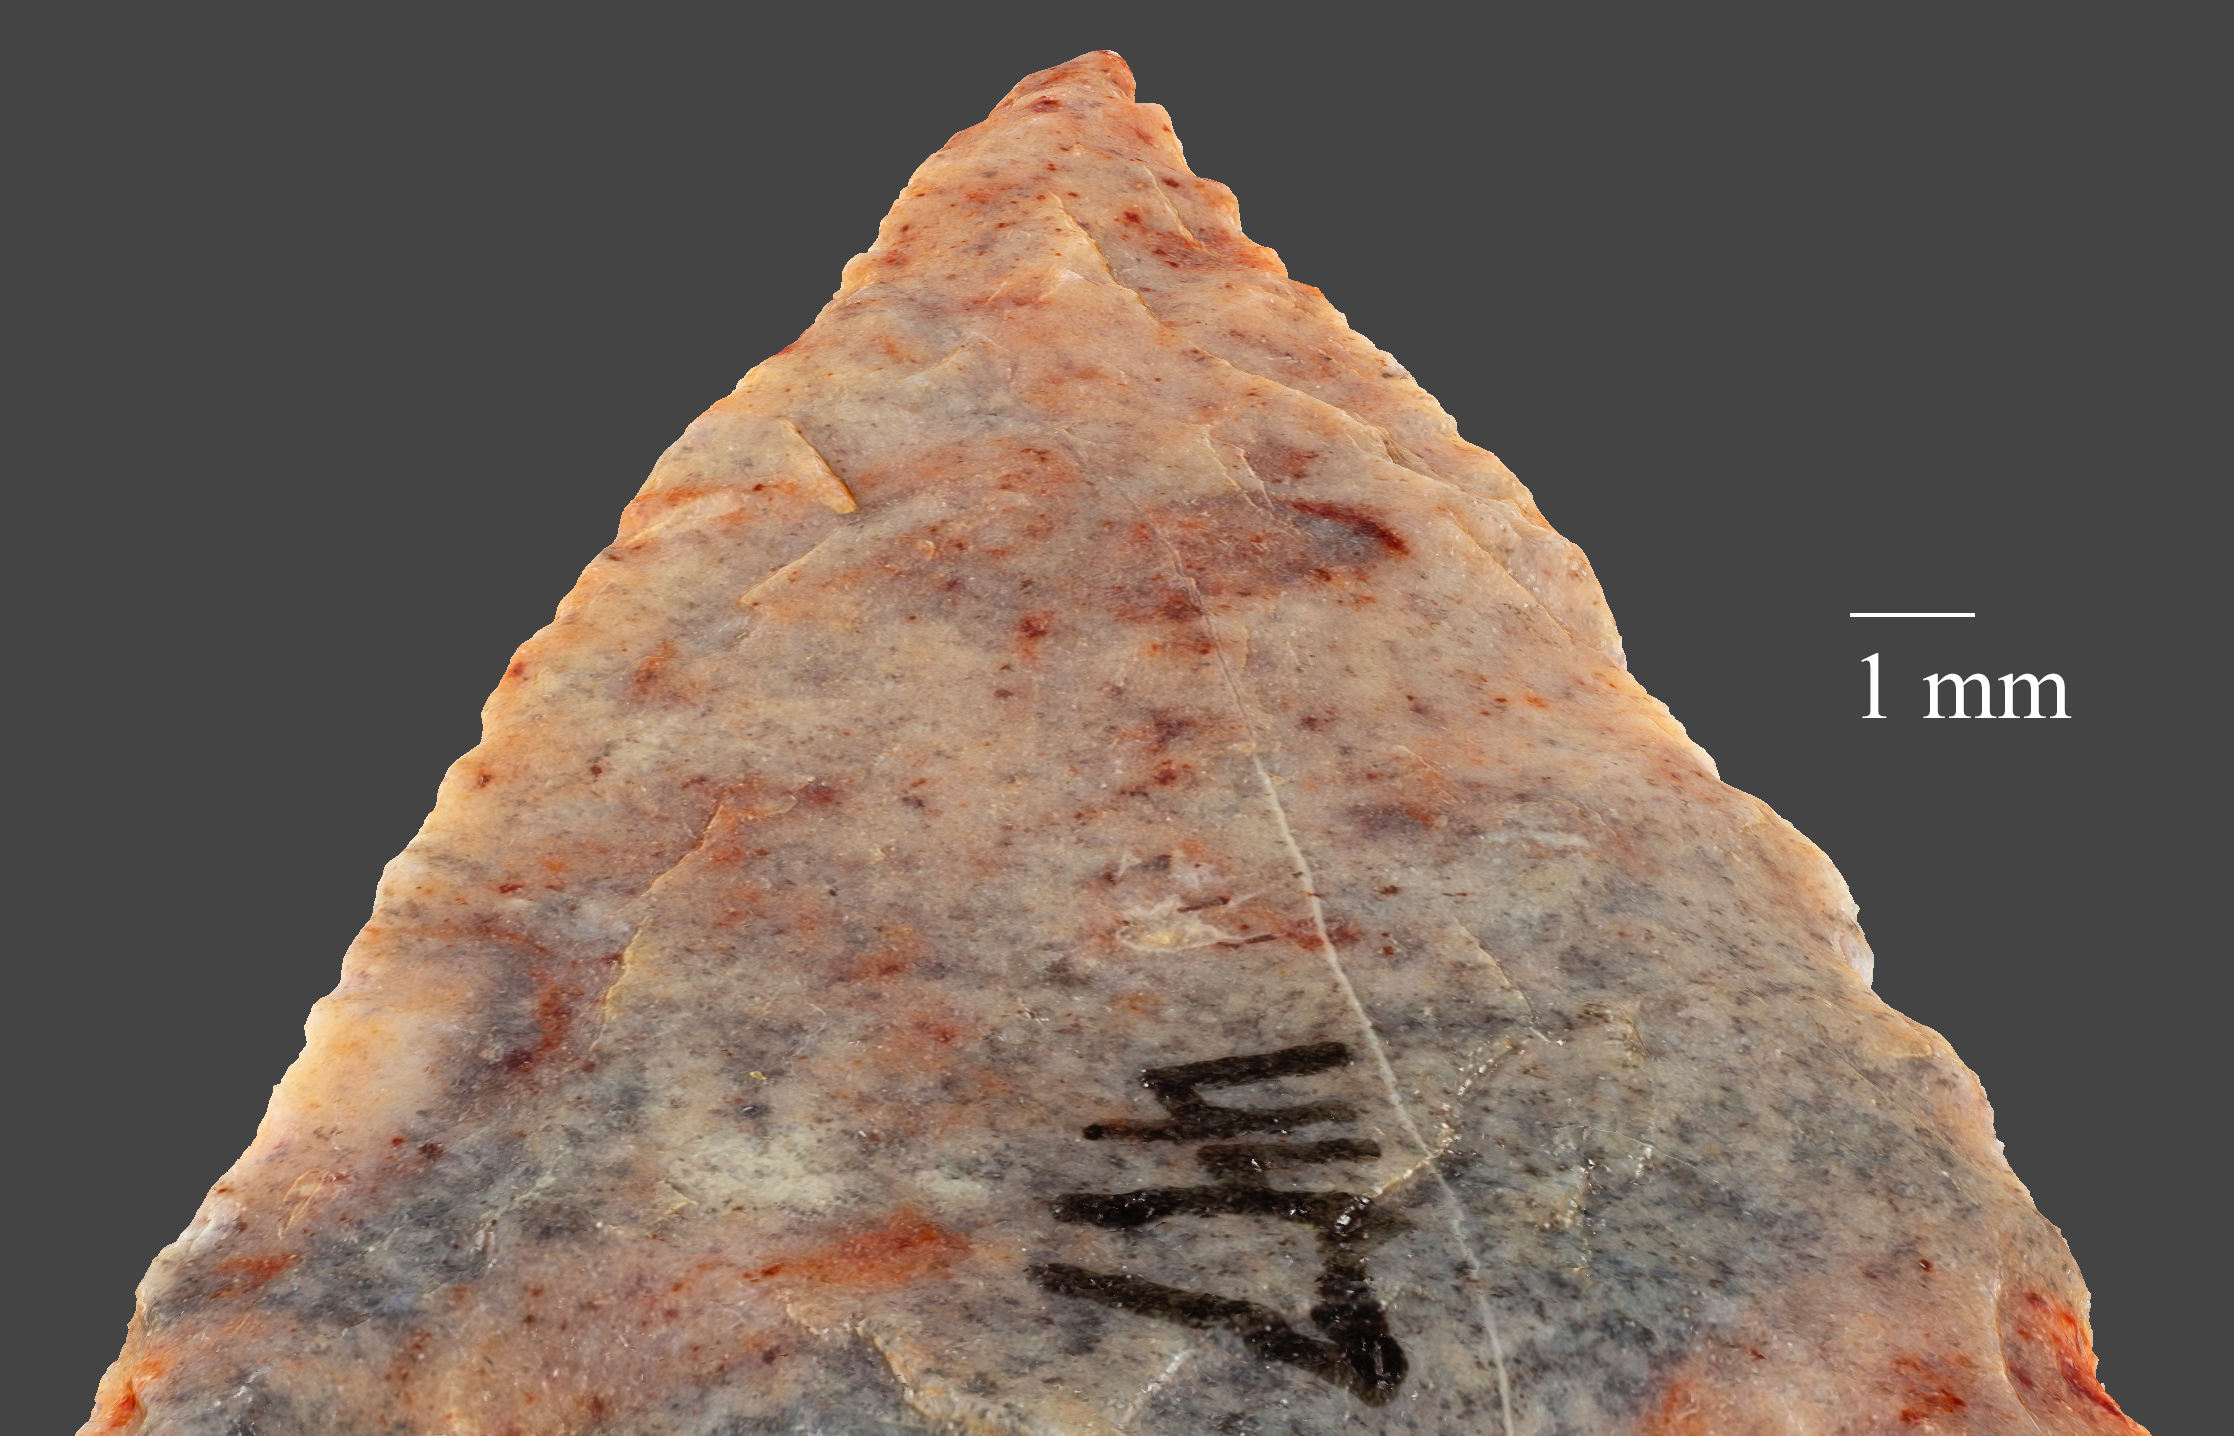
Figure 17. Detail from artifact 2005.002.007 Bag 5a Point 447, GSD 0.012 mm/pix, as visualized in Metashape Pro. Model is tilted backwards resulting in a look up the front surface face towards the tip. Model may also be viewed on Sketchfab https://skfb.ly/6XGuP
V. Conclusion
The results of this study corroborate the initial feasibility assessments of Gallo et al (2014) on focus stacking techniques coupled with photogrammetric processes for cultural heritage objects. Resolvable detail down to 26µ has been conservatively estimated with the author’s modified use of this combined workflow for complete 3D views of small North African stone points.
The accuracy of this method may be even further improved through the use of machine-readable targets and scale bars. According to Sapirstein (2018), targets allow camera orientations and calibrations to be refined in software beyond the estimates obtained by SfM alone. However, fitting such coded targets into the extremely close-focus and limited depth of field scenes of this study would have increased the amount of needed source images beyond feasible time and storage capacities. Additionally, with ongoing advances in computer vision, target-free camera calibration and fully automated orientation via feature-based matching techniques have been reported to achieve similar sub-pixel accuracy compared to targeted networks (Stamatopoulos & Fraser, 2014). In turn, neither coded targets nor scale bars were used by the author. Object scale was instead applied to resulting 3D data based upon digital caliper measurements of the artifacts’ maximum height and width values.
Future comparative research on the deployment of higher resolution cameras is thus warranted. New mirrorless options (Blair, 2021; “Fujifilm GFX100S,” 2021) could theoretically be less prone to mirror-slap vibrations (and the need for mirror lockup), and allow for faster image acquisition, longer shooting distances, wider depth of field, and larger captured scene sizes. In combination, these factors could potentially allow for the use of coded targets and scale bars while gathering data at similar GSD values as described in this inquiry (Table 1). How these different acquisition parameters would affect focus stacking needs, resulting throughput rates, and storage requirements remain open questions for further inquiry.
Regardless, the lack of consistency in applied terminology, metrics, and test practices of 3D spatial (and colorimetry) data remains. This absence of functional standardization, particularly within cultural heritage, makes comparative studies of both the existing and future literature difficult and ambiguous as a result. In turn, well-understood, applicable measurement guidelines and the greater availability of open access 3D research data sets are needed for optimal coherence and transparency within the field.
Finally, smoothing of small areas of reconstructed geometry can be common during mesh creation of sharp-edged and often reflective artifacts like stone points. However, fine details that are difficult to discern from the mesh can often be found in the photographic texture (Sapirstein, 2016, 2018). In this way, the importance that extreme close-focus image acquisition can have not only with conveying overall visual detail but also with how it can in certain instances compensate for local errors in reconstructed geometry adds additional merit to the process outlined in this study. As it has been noted throughout the discussion, high resolution image capture can thus serve multiple functions towards the creation and rendering of 3D data and enrich its educational and scholarly potential.
VI. Acknowledgements
The author wishes to thank University of Connecticut colleagues, Professor Christian Tryon, Department of Anthropology, for selecting the study’s original stone points, and Dr. Jacqueline Veninger-Robert, Office of State Archaeology, for facilitating the viewing and lending of artifacts from the Caldwell Collection. The author would also like to express his appreciation to Rhonda Kauffman, Metadata Management Librarian, for her assistance in creating and deploying the project’s 3D data sets’ metadata schema, and to Michael Kemezis, Repository Manager, Connecticut Digital Archive, for his help with the study’s data sets uploads to the CTDA.
Bibliography
Agisoft Metashape User Manual—Professional Edition, Version 1.6. (2020). 160.
Andrews, D., Bedford, J., & Bryan, P. (2015). Metric survey specifications for cultural heritage.
Banning, E. B. (2006). The Archaeologist’s Laboratory: Measurement and error. http://homes.chass.utoronto.ca/~banning/ARH%20312/312lab02.htm
Bennett, M. J. (2018, August 1). Automating Original Image Capture For Photogrammetry—Tundra Graphics. Tundra Graphics. https://tundragraphics.com/blog/2018/08/automating-3d-capture/
Bennett, M. J. (2020a, June 26). Small Object Photogrammetry Through Focus Stacking—Tundra Graphics. Tundra Graphics. https://tundragraphics.com/blog/2020/06/small-object-photogrammetry-through-focus-stacking
Bennett, M. J. (2020b). Examining the Geometric and Visual Details of High Resolution 3D Lithics. University of Connecticut Library White Paper. https://opencommons.uconn.edu/libr_pubs/66
Blair, C. (2021, March 24). Canon to release a 100mp EOS R system camera next year. Canon Rumors. https://www.canonrumors.com/canon-to-release-a-100mp-eos-r-system-camera-next-year-cr2/
Caldwell Collection of North African Points Data Sets. (2021). http://hdl.handle.net/11134/20006:Caldwell
Cignoni, P., Callieri, M., Corsini, M., Dellepiane, M., Ganovelli, F., & Ranzuglia, G. (2020). MeshLab (2020.12) [Computer software]. https://www.meshlab.net/
Cultural Heritage Imaging | Photogrammetry. (2021). http://culturalheritageimaging.org/Technologies/Photogrammetry/
Fujifilm GFX100S. (2021). In Wikipedia. https://en.wikipedia.org/w/index.php?title=Fujifilm_GFX100S&oldid=1012601450
Gallo, A., Muzzupappa, M., & Bruno, F. (2014). 3D reconstruction of small sized objects from a sequence of multi-focused images. Journal of Cultural Heritage, 15(2), 173–182. https://doi.org/10.1016/j.culher.2013.04.009
Luhmann, T., Kyle, S., & Boehm, J. (2014). Close-range photogrammetry and 3D imaging (2nd ed.). De Gruyter.
Mallison, H. (2015, October 11). Photogrammetry tutorial 11: How to handle a project in Agisoft Metashape (Photoscan) | dinosaurpalaeo. https://dinosaurpalaeo.wordpress.com/2015/10/11/photogrammetry-tutorial-11-how-to-handle-a-project-in-agisoft-photoscan/
Matthews, N. A. (2008). Aerial and Close-Range Photogrammetric Technology: Providing Resource Documentation, Interpretation, and Preservation. Bureau of Land Management Technical Note 428. http://www.blm.gov/pgdata/etc/medialib/blm/wo/Planning_and_Renewable_Resources/coop_agencies/paleontology_library/paleo_publications.Par.69972.File.dat/TechNote428.pdf
Nyquist–Shannon sampling theorem. (2021). In Wikipedia. https://en.wikipedia.org/w/index.php?title=Nyquist%E2%80%93Shannon_sampling_theorem&oldid=1002056076
Porter, S. T., Roussel, M., & Soressi, M. (2016). A Simple Photogrammetry Rig for the Reliable Creation of 3D Artifact Models in the Field: Lithic Examples from the Early Upper Paleolithic Sequence of Les Cottés (France). Advances in Archaeological Practice, 4(1), 71–86. https://doi.org/10.7183/2326-3768.4.1.71
Remondino, F., Menna, F., Koutsoudis, A., & Chamzas, C. (2013). Design and implement a reality-based 3D digitisation and modelling project. 2013 Digital Heritage International Congress (DigitalHeritage), 137–144. https://doi.org/10.1109/DigitalHeritage.2013.6743723
Rieger, T. (2016). FADGI Technical Guidelines for Digitizing Cultural Heritage Materials, September 2016. http://www.digitizationguidelines.gov/guidelines/FADGI%20Federal%20%20Agencies%20Digital%20Guidelines%20Initiative-2016%20Final_rev1.pdf
Saidi, K. S. (2020, April 6). The Need for 3D Imaging Performance Standards for Robotic Assembly | 2020-04-06 | Quality Magazine. Quality Magazine. https://www.qualitymag.com/articles/96011-the-need-for-3d-imaging-performance-standards-for-robotic-assembly
Sapirstein, P. (2016). Accurate measurement with photogrammetry at large sites. Journal of Archaeological Science, 66, 137–145. https://doi.org/10.1016/j.jas.2016.01.002
Sapirstein, P. (2018). A high-precision photogrammetric recording system for small artifacts. Journal of Cultural Heritage, 31, 33–45. https://doi.org/10.1016/j.culher.2017.10.011
Scale-invariant feature transform. (2021). In Wikipedia. https://en.wikipedia.org/w/index.php?title=Scale-invariant_feature_transform&oldid=1011461449
Schroer, C., Mudge, M., & Lum, M. (2014). Photogrammetry Training: Practical, Scientific Use of Photogrammetry in Cultural Heritage.
Semyonov, D. (2011, May 3). Algorithms used in Photoscan. https://www.agisoft.com/forum/index.php?topic=89.0
Stamatopoulos, C., & Fraser, C. S. (2014). Automated Target-Free Network Orientation and Camera Calibration. ISPRS Annals of Photogrammetry, Remote Sensing and Spatial Information Sciences, II–5, 339–346. https://doi.org/10.5194/isprsannals-II-5-339-2014
Straffi, P. (2016). On-Screen Protractor (0.5) [Computer software]. http://osprotractor.sourceforge.net/Protractor.html
Structure from motion. (2021). In Wikipedia. https://en.wikipedia.org/w/index.php?title=Structure_from_motion&oldid=1000495782
van Dormolen, H. (2012). Metamorfoze Preservation Imaging Guidelines. 44.
Verhoeven, G. J. (2018). Resolving Some Spatial Resolution Issues – Part 1: Between Line Pairs And Sampling Distance. https://doi.org/10.5281/ZENODO.1465017
Verhoeven, G. J. (2019). Resolving some spatial resolution issues – Part 2: When diffraction takes over. https://doi.org/10.5281/ZENODO.3518178
Webb, E. K. (2020). Optimising Spectral and 3D Imaging for Cultural Heritage Documentation Using Consumer Imaging Systems [Doctor of Philosophy, University of Brighton]. https://research.brighton.ac.uk/files/21915605/Webb_Final_Thesis_Redacted.pdf
Williams, D. (2010, May 5). Making Sense of Digital Imaging Performance in a Cultural Heritage Environment. Image Science Associates Seminar, Library of Congress.
About the Author
Michael J. Bennett is Head of Digital Imaging and Conservation at the University of Connecticut. There he oversees the digital capture and conservation operations for the University’s archives and special collections. His research interests include technologies and techniques that focus on digitization, post-processing, and 2D and 3D data formats. He holds a BA from Connecticut College and an MLIS from the University of Rhode Island.

Subscribe to comments: For this article | For all articles
Leave a Reply