By Joshua Lambert
Introduction
Libraries eventually must move to new buildings or renovate old ones. When they shift a collection, they must decide how to move the books into the new space. If the collection is large enough, then slight, but repeated misplacements during a shift can lead to many extra hours of work once library staff recognize there is a problem.
The Missouri State University Libraries staff were faced with the task of moving thousands of shelves of books. To make the move more predictable, the staff wanted an answer to the question, “Before a single book is moved, how can I determine which shelf each book should sit on after the shift is complete?” Looking at library literature provided hints and good processes to follow, but those processes were not predictable or flexible enough. The following table (Table 1) illustrates one possible outcome of the general goal, and the rest of this article explains how to obtain that outcome with the help of a Python script, bookshift.py, in the GitHub repository (Lambert 2022). The repository also contains data from the actual MSU shift described in this article.
| shelf_num | goal |
|---|---|
| 1 | The last book from this shelf goes 24.0 in/cm into shelf 1 |
| 2 | The last book from this shelf goes 18.9 in/cm into shelf 2 |
| … | … |
| 1478 | The last book from this shelf goes 26 in/cm into shelf 1550 |
Shifting library books is difficult for many reasons. Books that were on the shelves during shift preparation may no longer be on the shelf during the shift. Likewise, what was checked out may be back on the shelf. Books must remain in their exact order due to the classification system. The number of shelves and shelving layout may change. Librarians may want to leave more empty space in some book collections because they expect the number of books in that collection to grow faster than other collections. Shifting inconsistencies cause unexpected problems. If someone shifting books puts one less inch of books on every shelf, that will be a big problem after 1000 shelves. Yet, the process given in this article allows library staff to shift not only predictably, but also backward, forward, in an arbitrary number of places simultaneously, or all of the above, at the same time. The author acknowledges that real life does not fit nicely into mathematical formulas and computer algorithms. That said, the process put forward in this article provides acceptable and understandable trade-offs in many if not most cases.
Background information
There have been discussions of moving books in North American library literature since at least Melvil Dewey’s Library Notes discussions in Volume 2, 1887 (Dewey 1887). From that time forward, people have published advancements and refinements that fit their goals and contexts. There is a large body of literature related to the intersection of Operations Research and librarianship from the late 1960s and early 1970s that applied mathematical techniques to library processes. There was even an operations research themed library conference in 1971 (Morse 1972). The pairing of the library world and Operations Research was mostly short-lived, but some influence remains (Reisman and Xu 1994; Warwick 2012).
In 1983, Donna Lee Kurkul, as a library practitioner, published an article with a page containing seven mathematical formulas (Kurkul 1983). Those formulas were not new to library literature, nor complicated, but Kurkul presented them together in a more concise and understandable manner than previous publications. The ideas in those formulas are useful in understanding the Python script which is the subject of this article. After Kurkul’s article, most publications on the topic have contributed by explaining new tools or processes, as computers and spreadsheets have become integral parts of library operation.
Steven Carl Fortriede’s book and accompanying spreadsheets provide both information and the tools needed to make a library move successful (Fortriede 2010). It contains many of the ideas presented in this article. Importantly, his work uses the term “waypoint”, and describes it as “a defined spot in a collection designated by the call number of the book to be filed immediately after the waypoint.” The idea of a waypoint is very important, and it adds predictability to the shifting process.
The author’s previous conference presentation provides the mathematical basis behind the bookshift.py script presented in this article (Lambert 2016). The resulting algorithm is in the set_measurement_totals_after function.
This article uses the following terminology to refer to library shelving. A shelf is the horizontal structure that books sit on. A section is a vertical group of shelves of similar size, stacked above each other, with vertical space between them for books. A range is a group of sections, attached to each other, forming a line. Ranges are arranged in parallel with aisles for people to walk down and look at books. For the purposes of this article, and the script, a double-sided shelving unit consists of two ranges of shelving, sitting back to back, with books facing out on each side.
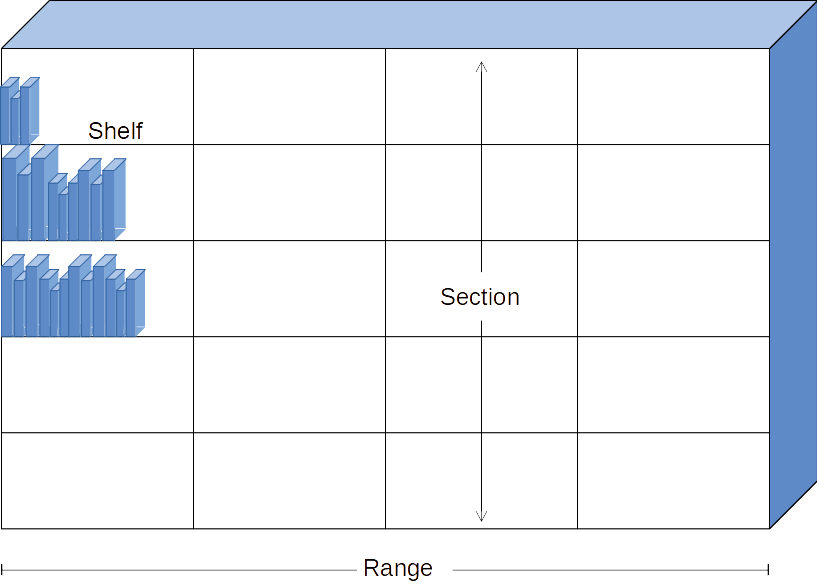
Figure 1. Depiction of Shelf, Section and Range.
Fortriede’s spreadsheets allowed library staff to split the shift into “collections” (Fortriede 2010). Each collection could have its own future fill ratio. For example, library staff might want shelves that hold books from collection one to have a fill ratio of 80%. That means that 80% of the shelf would have books on it. Mathematically, that would be the measure of books on a shelf divided by the measure of books that could be on the shelf if it were full. After that collection, someone might want to leave more growth room for collection two and want those shelves to have a fill ratio of 60%. Using Fortriede’s method, shift coordinators must adjust the “growth factor” for each collection manually until your plan matches future shelving capacity. Missouri State University shift coordinators did not want to have to specify fill ratios for all collections, but they wanted to for some. For this paper, an “imposed fill ratio” is a fill ratio chosen by library staff that the Python script will not change. In Fortriede’s spreadsheets each collection has an imposed fill ratio but bookshift.py requires that some collections not have a fill ratio imposed on them. Note that the script will not work if any shelf or collection of shelves has a fill ratio of greater than 100%.
Consider the scale of a book shift and the effect that incorrect measurements and book circulation have on the overall process. The Missouri State University library shift example provided in the GitHub repository in the “files-to-import” directory is a good example. If people measuring the collection measured 2,833 too few inches, that would mean that each of the 3,864 shelves would have 0.73 inches more on them than expected. While annoying to find out, this will not require much, if any, extra labor. If a library uses the recommended one waypoint per range, someone shifting will get near the end of the range and realize they have too many books. The shifter can adjust by adding extra books to shelves near the end. It will make fill ratios in that range, and every range, uneven, but acceptable. The good thing is that the problem will not compound but can be addressed between each waypoint with small adjustments. Mismeasuring 2,833 inches also seems highly unlikely if the shelving coordinator uses quality control measures. Also, if a shift coordinator wants extra assurance, they can tell the measurers to round up to the nearest half inch or centimeter for each measurement. This creates a small amount of extra space between waypoints but it will be inconsequential to the overall shift.
Required data
To create predictable results, bookshelf.py requires three input files with predictable data formats. The first file provides measurement data from before the shift. The second provides destination shelving data. The third file provides imposed fill ratios for collections of books. The following sections describe what should be in each file.
Data placement
The script looks for a subdirectory by the name of “files-to-import” which should contain three files: current.csv, future.csv, and collections.csv. Library staff can clone the GitHub repository and work within the resulting directory. Library staff can also download the bookshift.py file, create a subdirectory named “files-to-import” and place the three relevant files in that directory. The GitHub repository contains data used during the Missouri State University shift.
Measurements before the shift
Before the shift, there are at least four data points that must be collected for each shelf. Three of those are implicitly or intermittently collected. The data points are:
- Horizontal measurement of books on a shelf.
- The start of a new section.
- The call number of the first book on the first shelf of a range.
- Collection number.
Paper-based tables, like Table 2, imitate the look of shelves and make it simpler for student workers to comprehend the process. Table 2 shows recorded measurements in inches, though someone may use any unit of measure, assuming they use the same unit the whole time. The top of every new column is the first shelf of a section, therefore section numbers do not need to be listed on the form because they are implicit in the table itself. Each range is visually separated by a different paper table. The author’s experience is that using paper is the easiest, fastest, and most reliable method for student workers, but using this method will require transcribing the data into a spreadsheet before processing.
The collection number need not be tracked on this paper form, but may be if library staff choose to do so. Note that for the sake of this process, and bookshift.py, one shelf, before the shift, can only have one collection on it. If there are books on a shelf that library staff would like to be in two separate collections, it is easiest to ignore the fact and just assign it to one collection or the other. Alternatively, shift the offending books one shelf over, so there are not books from two collections on a shelf.
| CallNum: A1.1: D35 RangeNum: 1 | |||||
| 24 | 23 | 24 | 22 | 1 | 24 |
| 21 | 25 | 26 | 21 | 29 | 25 |
| 25 | 25 | 26 | 25 | 26 | 25 |
| 27 | 26 | 24 | 24 | 26 | 25 |
| 8 | 23 | 26 | 26 | 23 | 25 |
| 26 | 23 | 25 | 9 | 26 | 25 |
The use of paper may be skipped entirely and a spreadsheet used instead. The spreadsheet is designed to reduce keystrokes and labor. Library staff can first type in a range of measurements in a spreadsheet column, then go back to add new section increments and call numbers as shown in Figure 3. Library staff can quickly copy down collection numbers for each range or for entire collections at a time if all the measurements are present. The following table shows the measurements above in the required format. A spreadsheet is not required, but the end result must be a CSV file, and many people will prefer to input data in a spreadsheet and then export to a CSV file. Table 3 shows the first lines of the “current.csv” file in the “files-to-import” directory of the GitHub repository.
| measure | sctn_increment | call_num | collection_num |
|---|---|---|---|
| 24 | x | Q1 .H68 1975 | 1 |
| 21 | 1 | ||
| 25 | 1 | ||
| 27 | 1 | ||
| 8 | 1 | ||
| 26 | 1 | ||
| 23 | x | 1 | |
| 25 | 1 | ||
| 25 | 1 | ||
| 26 | 1 |
The data entry will take some time and probably be thousands if not tens of thousands of lines long. It is important that the data be correct for the process to provide accurate results. That said, the process is resilient enough that some measurement or data entry mistakes still allow shifters to easily adjust for the mistakes. The definition of “some” depends on the magnitude of the mistake. After the data is in the spreadsheet it should be exported to CSV format with the name “current.csv”.
Destination shelf measurements
While it does take extra time, recording shelving configurations and measurements for the future shelving locations allows library staff to carry out a predictable shift. Shelf sizes are often similar, therefore one can quickly copy and paste a large section of shelf measurements in a spreadsheet. The data points required are:
- Shelf measurement
- The start of a new section.
- The start of a new range.
This data likewise should be exported as a CSV file, and its name should be “future.csv”. The resulting file will look like the example Missouri State University “future.csv” file in the repository. While the example shows “x” or “c” for section and range increments, the script accepts any character. If it is not the first shelf of a section or range, then the field must be empty.
Collection data
This last file is not required if library staff do not intend to use imposed fill ratios. If they do, the data points needed for the file are:
- Collection number, starting at one.
- Imposed fill ratio.
| col_num | imposed_fill_ratio |
|---|---|
| 1 | |
| 2 | 0.65 |
| 3 | 0.7 |
| 4 | |
| 5 | 0.5 |
| 6 | 0.5 |
If library staff intends to use collections, and therefore wants to change the file, every collection number in the shift must be listed. Only imposed fill ratios should be placed in the second column. This file may contain two or more rows of data if library staff choose to divide the shift into collections. The data should be exported as a CSV file with the name of “collections.csv”.
If library staff do not choose to use collections, then make sure there is no “collections.csv” file in the “files-to-import” directory available for the script to find. Instead, the “no_collections.csv” file will be used. The repository contains such a file that you can place in the “files-to-import” directory.
Data proliferation
The script converts each CSV file into a Python dictionary that can later be converted into a Pandas dataframe. Once the data is ingested from the CSV files the script creates new columns. The new columns may be used for further column creation or for later error checking and human inspection. The script adds the columns to the original data and creates the “data_before.csv” file in the “export-data” directory. The add_calculated_data function creates most of the additional columns. It usually does so by calling one small function that creates the data for one column. The add_calculated_data function creates additional columns using data from both “current.csv” and “future.csv.”
The dataframe headers created from the “current.csv” file, along with short descriptions, are as follows:
- measure: Imported from CSV file.
- sctn_increment: Imported from CSV file.
- call_num: Imported from CSV file.
- col_num: Imported from CSV file.
- shelf_num: Calculated field. This is a simple index beginning with 1, the first shelf, and ending with the x shelf.
- section_num: Calculated field. The first section is 1 and increments each time there is an “x” in the sctn_increment field.
- range_num: Calculated field. The first range is 1 and increments each time there is a character in the call_num field.
- runsum: Calculated field. This starts with the first value of “measure” and creates a running sum, sometimes known as a sequence of partial sums.
- col_num2: Calculated field. This is validated and normalized data from col_num.
- shelf_per_section: Calculated field. This displays the nth shelf per section. This is a convenience and error checking column.
- section_per_range: Calculated field. This displays the nth section per range. It is a convenience and error checking column.
- way: Calculated field. This displays the waypoint.
- units_into: Calculated field. This displays the number of inches or centimeters into shelf x where the last book from the current shelf should end up.
- pretty_waypoint: Calculated field. This is a convenience column constructed from “way” and “units_into,” for each row.
The “future.csv” file gains a similar set of columns:
- shelf_measure
- sctn_increment
- range_increment
- shelf_num
- section_num
- range_num
- shelf_per_section
- section_per_range
- book_measure
- final_runsum
- way
- units_into
- pretty_waypoint
Analysis
The following paragraphs explain the foundational ideas for getting useful output. Most of this work happens in the function named set_measurement_totals_after. A first step toward analysis of the data is to calculate the shelf space occupied by each collection before the shift. Python’s Pandas library easily calculates such things using the groupby method. The “set_data.csv” file shows this calculation in the column called “books_measure” and Figure 5 illustrates the final table.
| col_num | imposed_fill_ratio | books_measure | fill_ratio | space_needed |
|---|---|---|---|---|
| 1 | 34514.0 | 0.74476424049762 | 46342.18202654199 | |
| 2 | 0.65 | 1723.0 | 0.65 | 2650.7692307692305 |
| 3 | 0.7 | 3437.0 | 0.7 | 4910.0 |
| 4 | 27076.0 | 0.74476424049762 | 36355.128949140955 | |
| 5 | 0.5 | 1287.0 | 0.5 | 2574.0 |
| 6 | 0.5 | 901.0 | 0.5 | 1802.0 |
| 7 | 0.7 | 347.0 | 0.7 | 495.7142857142857 |
| 8 | 0.4 | 551 | 0.4 | 1377.5 |
| 9 | 12362.0 | 0.74476424049762 | 16598.541293739123 | |
| 10 | 0.5 | 894.0 | 0.5 | 1788.0 |
| 11 | 0.6 | 1708.0 | 0.6 | 2846.666666666667 |
| 12 | 13033.0 | 0.74476424049762 | 17499.49754742776 |
Once bookshift.py calculates the book measure for each collection, it needs to calculate the space needed for each collection. We can do so immediately for collections with imposed fill ratios, because the book measure and fill ratio are known. The “fill_ratio” column in Table 5 shows the final calculation. Note that the full table is given above but the script can calculate only rows with imposed fill ratios at the beginning. Figure 2 shows how to calculate space needed.

Figure 2. Space calculation formula.
The set_measurement_totals_after function calculates the space needed for each imposed fill ratio. But, we do not yet know the fill ratio or space needed for collections that do not have imposed fill ratios. The script can calculate those using the subsequent steps.
First, the amount of space left for all collections with no imposed fill ratio can be calculated using a second formula (Figure 3). For the sample data this calculation is approximately 116795.35 = 135240 – 18444.65.

Figure 3. Non-imposed collections space formula.
Using this formula, the fill ratio for all non-imposed collections is discovered, and once the script has that, it uses the first formula above to calculate space needed for each non-imposed collection. Note that “space needed” at this point is synonymous with “space remaining” because we want to use the remaining shelf space for the rest of the collections. The script can now calculate the space_needed column for all collections. Library staff can double-check that by finding the summation of the space needed for each collection and comparing that to the total available space. They should be identical except for minor rounding errors.
To be useful, the script must provide actionable information that library staff can use to shift materials. One of the fields calculated above for the current books was the running sum value. The measure of books on each shelf allowed us to calculate that. We know the fill ratio and future shelving configuration, therefore we can now calculate the measure of books we want on each future shelf using a third formula (Figure 4).

Figure 4. Future shelf usage formula.
In situations where books from two collections occupy the same shelf, the formula is more complicated, but the script takes that into account. Once we know the measure of books on each shelf, we can calculate a running sum for the future locations. The function runsum_after accomplishes this in the script.
Using running sum values for before and after shifting, we can now calculate waypoints. A book at a running sum measure of 119 before the shift will still be at a running sum of 119 after the shift, as illustrated in Table 6. The runsum_after column gives the last possible measure on a shelf where a book should be. After shifting, shelf one should hold books occupying measures 0 to 28. Shelf five should hold books at measures greater than 102, but not exceeding 130. Therefore, a book at measure 119 of runsum_before starts at shelf four and ends up on shelf five, as illustrated by the “x” in column book_after of Table 6.
| shelf_num | runsum_before | book_before | runsum_after | book_after |
|---|---|---|---|---|
| 1 | 34 | 28 | ||
| 2 | 64 | 56 | ||
| 3 | 92 | 84 | ||
| 4 | 124 | x | 102 | |
| 5 | 149 | 130 | x |
The function waypoint_calc calculates the waypoint for every shelf and creates a list. It also creates a list that tracks how many units into the shelf a waypoint is. This ultimately allows the script to create the last dataframe column, which takes the form of a sentence. That dataframe exports to the file, “data_before.csv”, and it will contain phrases such as “The last book from this shelf goes 24.0 in/cm into shelf 1.” Following are two columns taken out of “data_before.csv” to illustrate the result. It is telling the book shifter that the last book from shelf 1 before the shift should be placed 24 inches into shelf 1 of its future location.
| shelf_num | goal |
|---|---|
| 1 | The last book from this shelf goes 24.0 in/cm into shelf 1 |
| 1 | The last book from this shelf goes 18.9 in/cm into shelf 2 |
| 1 | The last book from this shelf goes 17.9 in/cm into shelf 3 |
| 1 | The last book from this shelf goes 18.8 in/cm into shelf 4 |
There is also a file called “data_after.csv” that provides a look from the future shelving location back to the original. It will contain a phrase such as “The last book on this shelf comes from 7.1 in/cm into shelf 3.” The shift coordinator should only use one table as waypoints but they can choose which one best meets their needs. These phrases are the actionable output, created by the bookshift.py, that allows predictable shifting.
Discussion
Missouri State University shifted Library of Congress classified books on the Q-Z shelves, with data mentioned above. We moved the first books to two ranges of empty shelves, then we took apart and moved the newly vacated shelves, moved them to the new location, loaded them with different books, and repeated the process. We also needed to shift books from the R shelves before we shifted all of the books on the Q shelves. During that time, we had people shifting books in two or three places simultaneously and the process worked well. Subsequent smaller shifts outside of the Q – Z range allowed the author to refine the process presented here.
Using this method of measuring, calculating, and shifting provides great advantages. First, it provides a very high degree of predictability which aids staff planning. Second, the method provides flexibility by accounting for varying shelf counts, varying shelf lengths, and the separation of different fill ratios for different collections. Third, assuming there are not external factors that would negatively affect almost any shift, library staff can work in parallel without worrying that they will run into major surprises which would require re-shifting everything. If there are 10 student workers independently shifting at the same time, they can shift in different places and there is no worry of interfering with the others. This could also provide extra direction if the library hires a moving company whose personnel are not used to working in libraries. In addition, library staff can start shifting in the middle of the collection and work backward, or forward, as needed. The waypoints will keep book shifters on track, and they will give planners confidence things are moving as planned.
This shifting process should involve someone proficient and experienced in shelving and shifting. Shifting a collection in a library requires being exact but being tolerant of the unexpected. Do not expect all measurements to be correct, and do not expect that every place staff shift to will have exactly the number of books needed. A three inch wide book may occupy the last 1 inch of a shelf and then add two extra inches that shouldn’t be there. That is OK, just move forward with the typical shelf length and there will be extra space somewhere else before the next waypoint.
Although the script provides waypoints for every shelf, the author highly suggests having shelver visible waypoints only once per range. The people doing the shelving, and their supervisors, must have the freedom to make small adjustments within those ranges to make things work. For instance, if there is a large encyclopedia set that is no longer published, the shifter may not need space between volumes. If the shifter puts three shelves worth of encyclopedias together, with a fill ratio of 100%, there will be extra space at the end of the range that will make the waypoint or shelving job seem wrong. The extra space here and there is tolerable, and it should not affect placement of books on any other range. The extra space will be available in the future when it is needed. The beauty of the method presented in this article is that mistakes or oddities are easily fixed within a range by shifting books a few shelves left or right. People who regularly shelve are often trained to make such shifts without consulting with a supervisor, so it takes less labor, specifically less supervisor labor, to address.
The script described here does not account for cases in which library staff must combine book collections while simultaneously shifting. While out of scope for this article, there are some ways to accomplish that, but with fewer waypoints.
There are some unusual situations where shifting books is probably never a good idea and the method presented here does not account for such situations. The script presented here will not work well if 50% of the collection is checked out when you measure and only 5% is checked out when you shift or vice versa. Also, if a whole section of books is checked out and not initially measured, but returned before the shift, then there will be too many books in that area. It is the author’s experience that such checkout patterns are unusual and when they do occur, they are well known by the shelvers or other circulation staff. A shift coordinator can use imposed fill ratios to address such issues. That means, someone will have to make an educated guess, or use other evidence based processes outside the scope of this article, to determine the imposed fill ratio. If measurements are off by too much in one place, the described process will not work. An experienced shift coordinator should be able to recognize such problems and not start the shift process at all, revise the process, or review and correct incorrect data. It is always best to measure and shift in as short a time frame as possible and when the maximum number of books are on the shelf. That said, Missouri State University circulation does not vary enough at any point in the year for it to matter for it to negatively affect the shift process.
After considering the discussion above, there are a number of research directions people could follow. This method of shifting requires strict adherence to processes when creating CSV files. Can some of that strict process be relaxed to make data collection and processing easier? Also, the fact that this shift method requires basic Python knowledge, at least enough to execute a program, will mean that many library staff will not use it. It is likely that more people would adopt this method if they could do so using only spreadsheets.
References
Dewey M. 1887. Library notes: improved methods and labor-savers for librarians, readers and writers. Library Notes [Internet]. [cited 2022 June 9]; 2(6):95-97. Available from: http://hdl.handle.net/2027/hvd.hxh1dc
Fortriede SC. 2009. Moving Your Library. ALA Publishing. [accessed 2022 Jun 9]. https://www.ala.org/aboutala/offices/publishing/editions/webextras/fortriede09942/fortriede09942
Fortriede SC. 2010. Moving Your Library: Getting the Collection from Here to There. Chicago: American Library Association.
Kurkul DL. 1983. The Planning, Implementation, and Movement of an Academic Library Collection. College and Research Libraries. 44(4):220–234.
Lambert J. Confident Shifting for Complex Moves. Brick and Click: an academic library conference; 2016 Nov 4 [accessed 2022 June 9]. https://static.sched.com/hosted_files/brickclickanacademiclibrary2016/3d/Joshua%20Lambert%20Confident%20Shifting.pptx
Lambert J. bookshift.py – Predictable Library Book Shifting. [accessed 2022 Jun 9]. https://github.com/distichum/bookshift
Morse PM, Leimkuhler, FF, Buckland, MK et al. 1972. Proceedings of the thirty-fifth annual conference of the graduate library school. The Library Quarterly. 42(1).
Reisman A, Xu X. 1994. Operations research in libraries: A review of 25 years of activity. Operations Research. 42(1):34–40.
Warwick J. 2012. Library Operational Research: Time for a New Paradigm? In: Higher Education Management and Operational Research. Brill Sense. p. 269–291.
About the author
Joshua Lambert is a Librarian and Associate Professor at Missouri State University. He manages government documents, provides reference assistance, teaches courses for credit, provides library instruction, and gathers and analyzes data for the library and other researchers.

Subscribe to comments: For this article | For all articles
Leave a Reply