by Alan Webber
This project encompasses the preservation and visualization of the Rural Route Nomad photo and video collection, consisting of 14,058 born-digital objects from over a dozen different digital cameras during my world travels throughout all seven continents from the end of 2008 through 2009. Preservation work stemmed from appraisal of my digital audiovisual archive for at-risk media, planning for immediate and future preservation, and ingesting a Submission Information Package (SIP) into a consolidated Archival Information Package (AIP). The next step was creating a dataset that inventories the contents of the newly-created AIP, utilizing ExifTool to generate audiovisual metadata, and then cleaning and editing the Comma-separated Values (CSV) output using OpenRefine software, and finally, working with the information in Microsoft Excel. The end goal was to create attractive visualizations of this material using Tableau software, thus I spent time utilizing Tableau online tutorials to learn the basic structure and functionality of the Tableau interface before sketching out the information I wanted to portray in charts, graphs and maps. I then went about designing individual visualization worksheets, going back to manipulate the dataset as needed, and compiled my visualizations into several dashboards, focused on geography and date, camera totals, and camera specs.
| Preservation | Dataset Creation | Visualization |
 |
 |
 |
|
|
|
Figure 1. Workflow overview through the three stages of preservation, dataset creation and visualization [1].
Preservation
The genesis of this project comes from a much-needed survey of digital materials from my previous film, video and photo projects [2], along with my work as a programmer and film festival curator [3], that have been kept in near line storage (Electronic Records Management Guidelines [date unknown]) at my home studio. While there are physical master copies on tapes and celluloid prints for many of these projects, I realized in most cases there is only one digital copy stored on an external hard disk drive (HDD) or optical disc. A number of these HDDs and discs are fairly old for digital media, dating back to the early 2000s in some cases [4]. I decided that all of the HDDs which were older than five years old should eventually be backed-up on new multiple-terabyte drives. As optical discs have proven to be unreliable long-term media due to scratches or environmental degradation due to data layer dye, I decided that all of them needed to be preserved onto new HDDs as well.
Since preserving all of this media would take some time, I zeroed in on the Rural Route Nomad collection materials as the initial priority. This collection consists of photos and videos I recorded while backpacking around the world from late 2008 through 2009. My travels corresponded with my role as Director of the Rural Route Film Festival for a tour of intermittent screenings on all seven continents. Photos and videos were shot on over a dozen different cameras on 33 countries, capturing a multi-media portrait of the world at a particular moment in time. The project is of high importance to me, and it also lends itself to preservation, as I have archived many physical objects from that timespan (e.g., maps, travel knickknacks, my passport and vaccination card, and my lucky T-shirt).
A lossless copy of all of the Nomad photos, along with some video content, was kept in my home studio over the span of dozens of CD, DVD and BD optical discs. The majority of the video was stored on four HDDs, along with some original MiniDV cassettes and memory cards, in my offsite climate controlled storage space. In addition to these primary digital materials, I also have nine portfolio books of printed 8×10” select photographic prints and an assortment of larger-scale prints. Since 2009, lossy photo copies have also been housed in four different Google Photos accounts [5].
My goal was to consolidate all of the lossless Nomad media onto a two terabyte HDD, creating an additional copy of the files and consolidating the media in one place for easier access and analysis. I purchased a Western Digital drive and retrieved the video HDDs from my offsite storage space. In consideration of the 3-2-1 Backup Rule and Lots of Copies Keep Stuff Safe (LOCKSS) (3-2-1 Backup Rule 2018), I would continue to keep different lossless digital copies between my home studio and the offsite space, along with the lossy copies on Google Photos. This preservation plan is not industry-standard perfect, as the offsite storage space is close to my home and not located in a geographically diverse enough location to prevent protection against major environmental or manmade disasters, but I am signing off on it as ‘good enough’ for now.
Once I had compiled all of the optical discs and HDDs together as a SIP [6], I began ingesting material onto my iMac. I started with the optical media, utilizing a removable Samsung Blu-ray drive. Next, I transferred the contents from each of the four HDDs from offsite storage, which required appropriate FireWire cables and adaptors to accommodate drives from different eras [7]. At the end of each transfer session, I copied the media on my hard drive to the new external HDD where the AIP would live, and deleted the files on my computer to keep local storage space available. I performed basic fixity checks through comparison of the file size and number of items across folders through their relative paths, using Cmd+i to access Finder windows.
There wound up being one corrupt HDD. I was able to get some files off before the drive became unreadable, but after troubleshooting through Disk Utility, trying different USB and FireWire cable combinations, researching online and going through chat and phone support with Seagate, the drive’s manufacturer, I had to send it in for further analysis. Seagate was unable to retrieve the data in a usable form, thus I had to go back to the MiniDV production tapes and re-digitize five tapes/71.25 gigabytes of footage from China, India, Nepal, and the U.S.
Dataset Creation
Once I had assembled my AIP, I needed to create an inventory, and I also wanted to generate descriptive information pertinent to the photographic and moving image mediums represented. Using Terminal, I tried employing MediaInfo, but found it difficult to obtain data in spreadsheet format. Instead, I went to ExifTool, which returned a plethora of metadata on the photos and videos, much more than MediaInfo, and I had no trouble dumping the information into a CSV file. Without filtering the results, I received a whopping 873 columns of data categories. Going back to the command line, I chose 30 values from the ExifTool documentation that I thought could be useful, as shown in Figure 2. ExifTool returned the narrowed down results, with 124 directories scanned and 14,668 image files read.
Figure 2. ExifTool command in Terminal.
Next, I took the CSV file into OpenRefine, where I performed initial clean up of columns and rows with excess characters and integers that ran over two places beyond the decimal point, exemplified in Figure 2. After that I brought the CSV data into Excel. In the end, I wound up with 19 working categories/columns. Overall, the dataset proved to be an ongoing, essential component of this project, as I have continued going back to add, delete and modify records in conjunction with Tableau visualization software, sometimes manually, out of necessity, or via Excel formulas. The version of the dataset used for the majority of published visualization work is available on Zenodo for public use: https://doi.org/10.5281/zenodo.6818292.
Figure 3. Dataset cleaning: rounding down the decimal for file size with an Edit Cells/Transform General Refine Expression Language (GREL) command in OpenRefine.
Visualization
I knew Tableau was a powerful tool to create dynamic, aesthetically pleasing visuals. However, I had encountered frustrations using the software before on a tight deadline for another project [8], so I wanted to take the time to get to know the fundamentals and different possibilities. Tableau seems to be considerate of technical access, providing a series of training videos specifically for the older version of the software I had to use with my Mac OS Sierra system [9]. I spent my free research time over the course of several weeks watching the supplied videos and following along with the exercises, learning about: connecting to data, pill types, discrete dimensions, continuous measures, marks, filters, hierarchies, tooltips, calculations, design formatting and geographic information systems (GIS) (Free Training Videos [date unknown]).
I had a general idea of the sort of visualizations I wanted to make, but through my research I found two useful examples of other video and photo visualization projects. Ashley Blewer’s Media Collection Viewer (2021) is a custom-made programming tool that uses MediaInfo JSON files to create bar and pie charts which depict technical statistics for audiovisual elements in a collection. Randy Runtsch works specifically with photography, analyzing and mapping locations using Python and Tableau (2021). Both of these resources addressed specific aspects that I wanted to visualize within the Nomad collection and encouraged me to continue through my own methods.
I started by outlining worksheets on paper before jumping into Tableau. I wanted to highlight specific combinations of information from the dataset in order to imply elements of narrative storytelling. The country in which the media was recorded should be seen in accordance with total files over time to show the progression of my journey, and I definitely wanted a map of geo-specific totals. Pairing camera models with countries would also spur personal memories, such as which cameras got stolen in Argentina, which one was the underwater camera for great white shark territory in South Africa, and which one broke in India.
It was also important to detail technical information from the 12+ individual cameras, as they represent a short but significant phase in the early digital/pre-smartphone era. I wanted to showcase average megapixels, lens length, aperture, ISO, shutter speed, and frames per second. This information would detail particular cameras, and, ideally, could also be used for image analysis to study how to get the ‘look’ of particular shots.
I encountered plenty of obstacles in realizing my ideas, which required research, trial-and-error, and more dataset tweaking. For instance, while ExifTool produced a date for most digital objects, almost all of them were wrong due to faulty metadata from many of the cameras. Since this footage was predominately shot on handheld digital cameras from the ‘00s, the date would have had to have been manually set in order to record properly; therefore, I had to go through manually and assign a month to each country’s photos. Also, most cameras, aside from the iPhone, which was only purchased in the U.S. at the end of the project, did not record GIS information, requiring the manual entry of a country name for each group of files. Further complicating the geographic identity was the fact that some media contained multiple intellectual objects within the same folder, or even the same file in the case of longer MiniDV content, leaving me to make the call in assigning a single location to that which occupied the majority of space on the file.
I did a conversion of the bytes ExifTool had supplied, to megabytes with Excel calculations, and also manually converted video and cumulative totals to gigabytes for specific visualizations. Once I had a draft of each individual worksheet in Tableau, I was able to utilize individual visualizations across the workbook, making them interactively appear within appropriate tooltips (e.g., highlighted map sections as you scroll over specific timeline dates and camera makes). In the end, I wound up adding finishing touches to the project, such as representative photo ‘shapes’ for each country represented on the map by pairing them individually within a separate worksheet.
Figure 4.Tableau map worksheet with interactive tooltip, showing country totals and representative photo.
I began combining worksheets into dashboards, and finished with three main types: a high level with monthly totals and GIS, one with camera totals, and one with photographic specs. In doing so, I took Taras Bakusevych’s 10 Rules for Better Dashboard Design (2019) into account, with tips on defining the purpose before design, and personalization over customization, leaving the potential for future dashboard edits for new users. The dashboards work well as jumping off points for deeper dives into the Nomad collection data, as they link out to individual worksheets and the dataset itself, within Tableau.
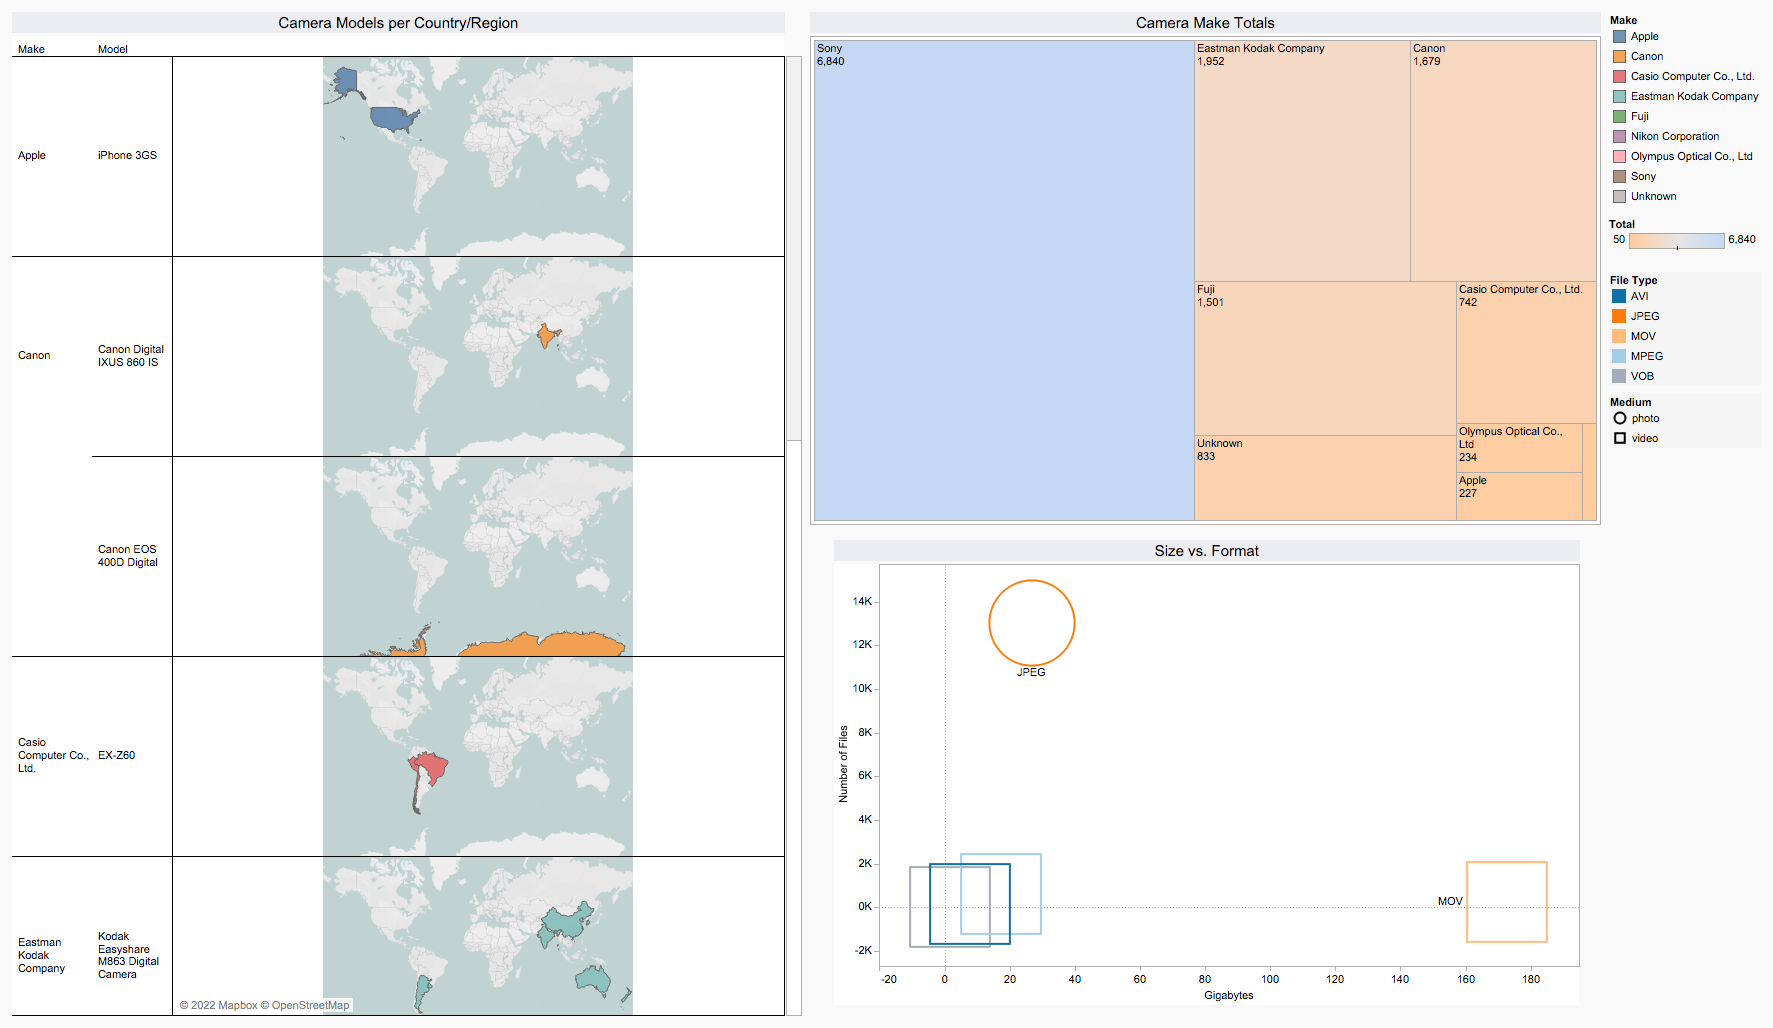
Figure 5.Tableau dashboard for camera totals: make and model/country used, file type.
Finally, I did a data export from my Tableau workbook, and saved the three dashboards to Tableau Public, where the information can easily be shared and accessed online: https://public.tableau.com/app/profile/alan.webber5364. While the visualizations maintain their aesthetic integrity and additional sheets can be navigated to within Tableau Public, I tested out working and editing within the interface and did find it considerably slower and more awkward than the desktop version. Luckily, I had completed the project several weeks before my free copy expired.
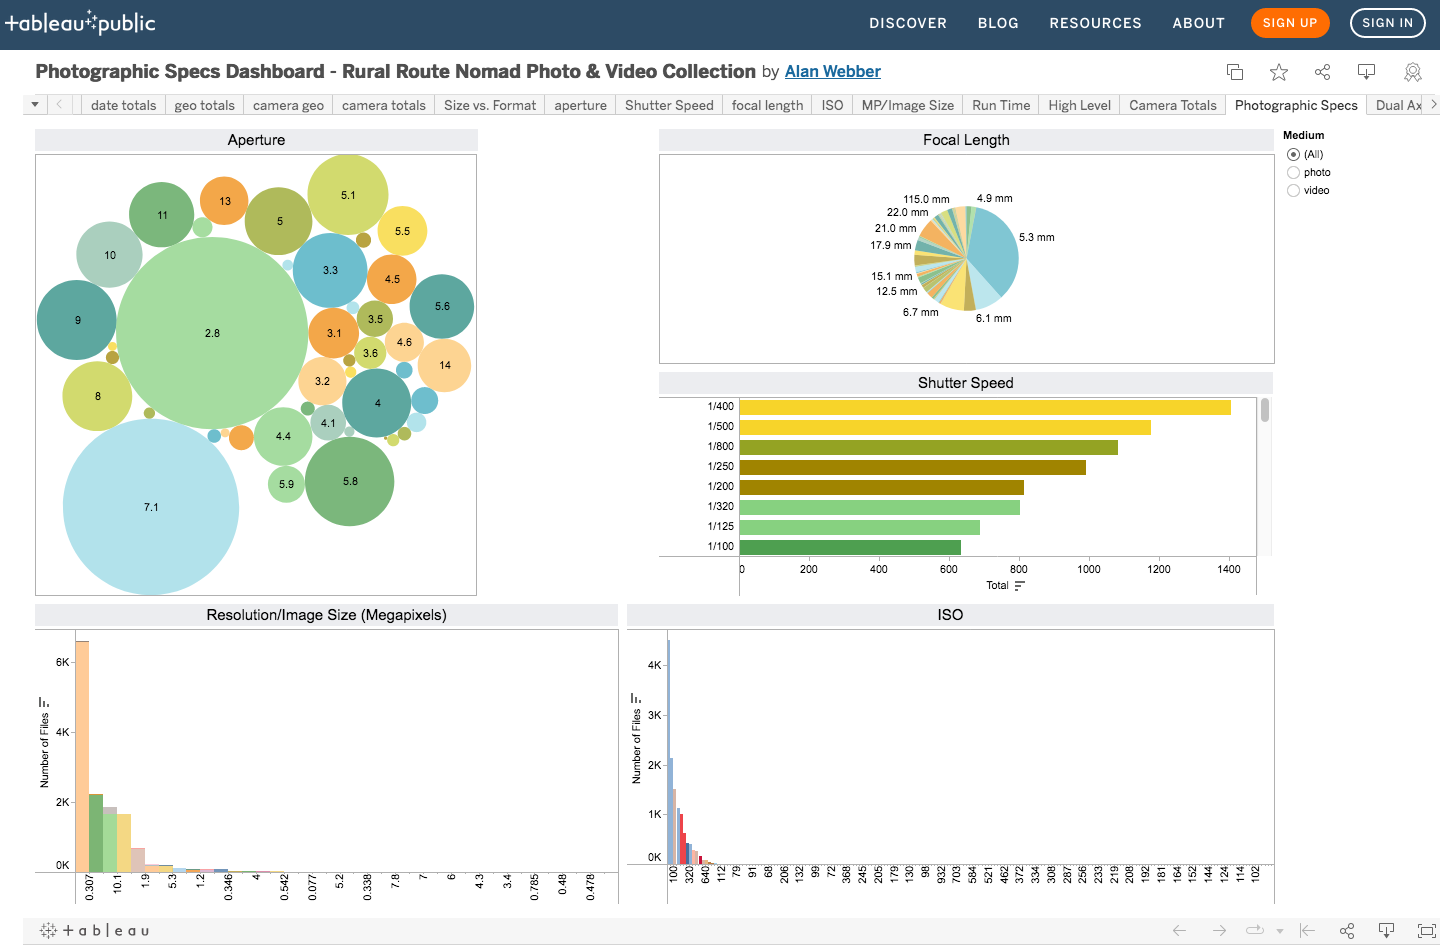
Figure 6.Dashboard for photographic specifications (aperture, focal length, shutter speed, resolution, ISO) on Tableau Public.
Evaluation
MiniDV footage was a problem at large, as ExifTool did not report results for a sizeable amount of the files that are present, likely because of the way they were originally exported from Final Cut Pro 7. A possible solution could be to try to run MediaInfo on this type of footage specifically, and manually incorporate it into the dataset. The number of MiniDV files constitutes a very small percentage of the overall collection, as they were captured in large tape-sized chunks, however, the size of these files is substantial, and as they are a part of the collection, it is important that they are represented.
As recommended by Dundon et al. (2020), in the future, I aim to install Bagger software to create and validate checksums, and Data Accessioner to manage archival content within more of a repository set-up, including the ability to generate and/or store sidecars of metadata and Preservation Description Information (PDI). I would ideally like to crosswalk a mixture of metadata schemas, such as Encoded Archival Description (EAD), Metadata and Encoding Transmission Standard (METS), and PREservation Metadata: Implementation Strategies (PREMIS) recommended for archives and preservation by Schafer and Bunde (2013), along with European Broadcasting Union (EBUCore) which I have used in the past for moving image data. Although an additional monthly bill is not appealing, I would also prospectively consider utilizing deep cloud storage, e.g. AWS Glacier, to provide more geographic diversity with multiple archival copies. I recently used Conifer to web archive the vlog [10] I kept in accordance with this photo and video collection, and would also like to experiment with incorporating it into a Tableau visualization.
Currently, the dataset and visualizations are designed to serve my own needs and standards. Potentially these components could be a finding aid or access point for other users to access the collection and request Dissemination Information Packages (DIPs). I would, in turn, want to comb through the media first for Personally Identifiable Information (PII) that I did not want made available.
Conclusion
I believe that the preservation efforts, dataset and visualizations are an effective beginning to build upon over time. I identified a specific collection of at-risk media and took steps to increase its expected lifespan. The CSV dataset and Tableau dashboards set a solid template, holding all pertinent information, which can be used for further enhancements of this project, or can be modified accordingly for similar photo and video visualizations. The Tableau worksheets present statistics in a manner which implies narrative storytelling through geography and time, specifications for a variety of early-2000s cameras, and individual photographic settings. The statistics and visualizations will assist with the use of materials from the Nomad Collection for new projects and exhibitions, and aid planning for future preservation projects. Overall, I believe this template is an effective system with which to see the scope of technical and content aspects of media, and potentially serve as an access point for DIP requests from other designated communities.
Notes
[1] Icons in diagram all from https://thenounproject.com, created by (from left to right): Creative Stall, Garrett Knoll, Ted Grajeda, and Vectors Point.
[2] Includes short films, music videos, featurettes, industrials, promos, travel and street photography, and screenplay materials. Samples can be found at https://www.youtube.com/user/RuralRouteFilms/playlists and https://vimeo.com/alanwebber.
[3] Primarily for the Rural Route Film Festival, dedicated to unique people and cultures overlooked by the mainstream media, https://ruralroutefilms.com/, along with Myriapod Productions and work done at large.
[4] One example being a large LaCie drive, which only holds 80 Gigabytes, and requires a hefty external power plug-in, with fan which spins loudly when powered on.
[5] Originally Picassa.
[6] This report utilizes terms from the Open Archival Information System (OAIS) Reference Model to describe preservation elements at different stages (i.e., SIP, AIP and DIP). Archaeology Data Service and Digital Antiquity provide a brief summary of OAIS within their Guides to Good Practice: https://guides.archaeologydataservice.ac.uk/g2gp/App_OAIS.
[7] Ideally, a write blocker would be used in this process to assure data is not corrupted during transfer, and, especially in this case, that original timestamps are preserved, retaining information on when photos and videos were shot or edited.
[8] I stopped upgrading at Sierra 10.12.6 to preserve functionality of Final Cut Pro 7, my preferred video editing software, which the majority of my older projects are in. I am, however, looking into emulation options, and at purchasing a second system to allow for better overall functionality through new updates.
[9] Short film online exhibition analytics research/visualization for Myriapod Productions.
[10] Vlog, spanning October 2008 to January 2010, https://ruralroutenomad.tumblr.com/page/70.
References
3-2-1 Backup Rule [Internet]. 2018. Austin (TX): The State and Local Records Management Division of the Texas State Library and Archives Commission, The Texas Record; [cited 2022 April 6]. Available from https://www.tsl.texas.gov/slrm/blog/2018/11/3-2-1-backup-rule/
Bakusevych, T. 2019. 10 rules for specifications better dashboard design. UX Planet [Internet]. [cited 2022 April 6]. Available from https://uxplanet.org/10-rules-for-better-dashboard-design-ef68189d734c
Blewer, A. 2021. Media Collection Viewer. BLOG Progress Process [Internet]. [cited 2022 March 25]. Available from https://bits.ashleyblewer.com/blog/2021/04/03/media-collection-viewer/
Dundon, K, Duckworth, S, Kutay, S, & Vigor, E. 2020. Anything is better than nothing: minimum viable actions for accessioning born-digital. [Internet][Santa Cruz (CA)]: UC Santa Cruz Library. PDF slides. [cited 2022 April 10]. Available from https://escholarship.org/uc/item/7p0276q8
Electronic Records Management Guidelines [Internet]. [date unknown]. Minnesota Historical Society: Minnesota State Archives; [cited 2022 July 28]. Available from https://www.mnhs.org/preserve/records/electronicrecords/erdigital.php
Free Training Videos—2019.3 [Internet]. [date unknown]. Tableau, Learning; [cited 2022 April 11]. Available from https://www.tableau.com/learn/training/20193
Runtsch, R. 2021. Analyze and map photo locations with Python and Tableau. Towards Data Science [Internet]. [cited 2022 March 28]. Available from https://towardsdatascience.com/analyze-and-map-photo-locations-with-python-and-tableau-7b2a4af971eb
Schafer, S, Bunde, JM. 2013. Standards for archival description. In: Prom C & Frusciano T, editors. Archival arrangement and description. Chicago (IL): Society of American Archivists. p. 9-85.
About the Author
Alan Webber is a digital archivist at The New School, and creative director/co-founder of the Rural Route Film Festival. His background is in filmmaking and writing, along with an assortment of other experience across the fine arts and performing arts worlds. Alan has an MSLIS with Archives Certificate from the Pratt Institute and an MA in Media Studies with Film Production Certificate from The New School.

Subscribe to comments: For this article | For all articles
Leave a Reply