by Jenn Colt
Introduction
The Lyrasis Open Source Software Report (Rosen & Grogg, 2021) tells us libraries are concerned about “sustainability” when selecting OSS solutions. Libraries express concern about software receiving regular updates into the future, both for the implementation of new features and to address security concerns. Libraries want to know that a project will be available long-term, will evolve new functionality, and will remain secure.
Sustainability is not the only consideration when choosing which software to adopt- functionality, ease of deployment, vendor support, and any number of other concerns factor in as well. However, sustainability might be considered a prerequisite for these other concerns. If community health is an indicator of the sustainability of a project, then it is worth investigating and weighing prior to adoption. Doing so will let libraries “consider the risk implied by using the OSS as is … and decide whether to help improve the health or choose another option.” (Linåker et al., 2022)
Predicting the long-term sustainability of a project is difficult but measuring the health of its supporting community can help. The Linux Foundation’s Community Health Analytics in Open Source Software (CHAOSS) project, which creates metrics for measuring OSS community health, defines health as “a project’s ability to continue to produce quality software” (Goggins et al., 2021).
Metrics are useful to many stakeholders, including project sponsors and maintainers, but this article is primarily about reviewing metrics as the adopter of a given OSS project. That is, when a library is considering using an existing project and beginning a collaborative relationship with an existing OSS community. What the library’s contributions to the OSS community will eventually be are not yet defined.
In this initial stage, the library is both evaluating the software for adoption and considering what kind of strategic contributions they can make to the community to help sustain the software. Contributions are defined broadly and do not consist solely of code contributions. An evaluation of metrics at the start of a library’s involvement with a project can allow them to have a better understanding of how to contribute to a project, and to affirm they have the resources needed to effectively adopt the software and participate in the community.
CHAOSS Metrics and Models
The Linux Foundation’s CHAOSS project has developed more than 80 metrics for evaluating the health of OSS communities. To make it easier for both projects and adopters to apply these metrics, many of them have been further organized into models. The CHAOSS models allows evaluators to consider a set of metrics in relationship to each other rather than individually, which can provide a better understanding of the real world systems represented by the metrics.
One of the metrics models created by CHAOSS is the Starter Project Health Model [1] which will be described below. This model includes four metrics that relate to the current health of the project mainly by measuring how responsive the project is to change requests, how robust the code contributor base is, and how active the repository is. Together these metrics offer basic insights into how healthy the project currently is while also providing information about the potential for sustainability. The model has been created as a place to start for people new to gathering these kinds of metrics.
Available Tools
When first experimenting with metrics, library staff need to collect data without a high investment of time and energy. There are a number of ways this can be done. For projects that are publicly hosted on GitHub and use the GitHub community features, GitHub insights offer limited data visualization features that support investigating some metrics. However, GitHub insights lacks the ability to customize or dive deeper into the visualizations provided, lacking filters for most of their metrics. The larger the project, the harder it is to understand the full picture of a project through GitHub insights, other than being able to tell whether the project is active or not.
For GitHub hosted projects you can also use the GitHub API to create your own implementations for collecting data and creating visualizations. (Qui et al., 2023)
The CHAOSS community collaborates on multiple software projects that implement their metrics. cauldron.io, used in the examples below, is built using components of the project’s GrimoireLab software [2]. GrimoireLab allows the user to integrate data from a range of sources and to consolidate the identities of actors in the data across data sources (i.e., be able to say that two GitHub users are actually the same user). This more complex data gathering and consolidation of identifiers cannot be done in the free cauldron.io instance of GrimoireLab, and requires authorized access to the data.
CHAOSS also produces Augur [3], another piece of software for analyzing and visualizing project data. Augur is more closely focused on the trace data generated by repositories, rather than the broader sources of community data supported by GrimoireLab. Both of these projects are of course open source and can be hosted or run locally [4]. cauldron.io provides a pleasant user experience for interacting with these metrics, and is the software demonstrated here. cauldron.io does not allow analysis of user data from GitHub outside of the user’s UUID and email domain name.
For projects not hosted on GitHub or projects privately hosted on GitHub, both GrimoireLab and Augur allow you to interact with repositories and additional systems (like JIRA) if you host the metrics software yourself or pay for them as a service, provided you are able to secure access to the data. If libraries choose to connect additional data sources to these systems, it should be done so with attention to privacy and a degree of restraint. While forums, mailing lists, and chat services can be ingested into GrimoireLab, it is not prudent to do so without a great deal of thought about the ethical and privacy implications. The CHAOSS project offers their own guide on ethics and privacy in relationship to this data [5].
Exploring the Starter Project Health Metrics Model
After choosing a tool, the easiest way to understand these metrics may be to try applying them to a repository and examining the results. Below are the metrics from the Starter Project Health Metrics Model as applied to one library-related OSS project, DSpace using cauldron.io. DSpace’s repositories are publicly hosted on GitHub and the project also uses the built-in GitHub issue tracker, making it a good project with public data for trying out these metrics.
Each of the metrics provides a starting point for further investigation and understanding of the collaboration a library is entering into when joining an OSS community. The figures below come from the cauldron.io tool.
Prior to reviewing the metrics, it should be clearly stated the purpose of these metrics is to evaluate the state of a project and its community, which are complex systems that can involve many people, institutions, and outside forces. The goal of these metrics is not to evaluate people or their performance in any way, but rather to understand a project and find the most productive ways to participate in it.
Starter Project Health Model Metric #1: Time to first response
Time to first response [6] indicates how quickly the project community responds to activities like issues being opened or pull requests being made (CHAOSS, n.d.). Recalling libraries’ concerns about continued feature development in the Lyrasis survey, time to first response might be an indicator of whether the project is willing to discuss feature requests, suggestions, or provide troubleshooting answers. It’s important to keep in mind that not all discussion may happen on the platform that you are reviewing. Many projects also maintain email lists for discussion. Low levels of interaction on GitHub might indicate a need to investigate what other forums are being used, even if you do not directly collect data from them awareness of those venues is important.
Reviewing the level of conversational activity around a project prior to adopting can help the library understand what level of support and interaction they should expect from the community prior to adopting, so they can understand the impact that will have on staff who need to seek answers about the software, and perhaps they may also see for themselves an opportunity to contribute something like documentation effort if the project needs help providing support to users.
Below is the timing overview report panel from cauldron.io. This panel is comprised of a set of visualizations in their Elastic Kibana instance, which provides more flexible reporting capability than the premade reports available on the cauldron.io web site itself. After creating an account in cauldron.io and generating a report for a repository, clicking the “more details” link will take you to the Elastic Kibana interface. Here we can see that the timing is being measured for two repositories – the DSpace API and its Angular UI. This ability to combine multiple repositories is one advantage of using a metrics reporting system rather than GitHub insights.
From the dashboard we see the timing efficiency of the DSpace repositories improving over time. The median and mean for both time measures are available as well. The median is likely more meaningful as it is typical of most projects to have at least some issues that are not well-defined or for some other reason not readily solvable that hang around for a long time, driving up the average time to response/close.
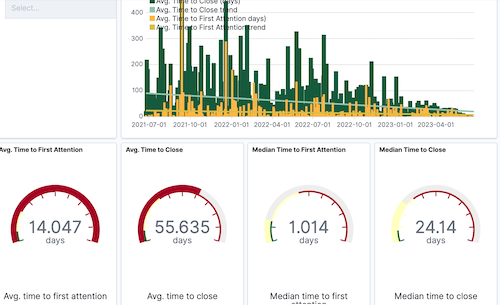
Figure 1. The cauldron.io timing overview dashboard.
Starter Project Health Model Metric #2: Change request closure ratio
The change request closure ratio [7] is a measure of how many pull or merge requests are created in a week versus how many were closed (CHAOSS, n.d.). It is an indicator of how well the community is able to keep up with the requests being made.
Both change request closure ratio and time to first response may also reflect how well the project is able to keep up with necessary security updates from the project’s dependencies, thus providing measurement related to libraries concerns about maintaining secure software.
Below is the graph from cauldron.io of the issues closed and issues opened by month for both DSpace repositories. In the graph, the number of issues closed and opened mostly move together indicating that the maintainers are likely to be keeping up with the number of issues being opened.
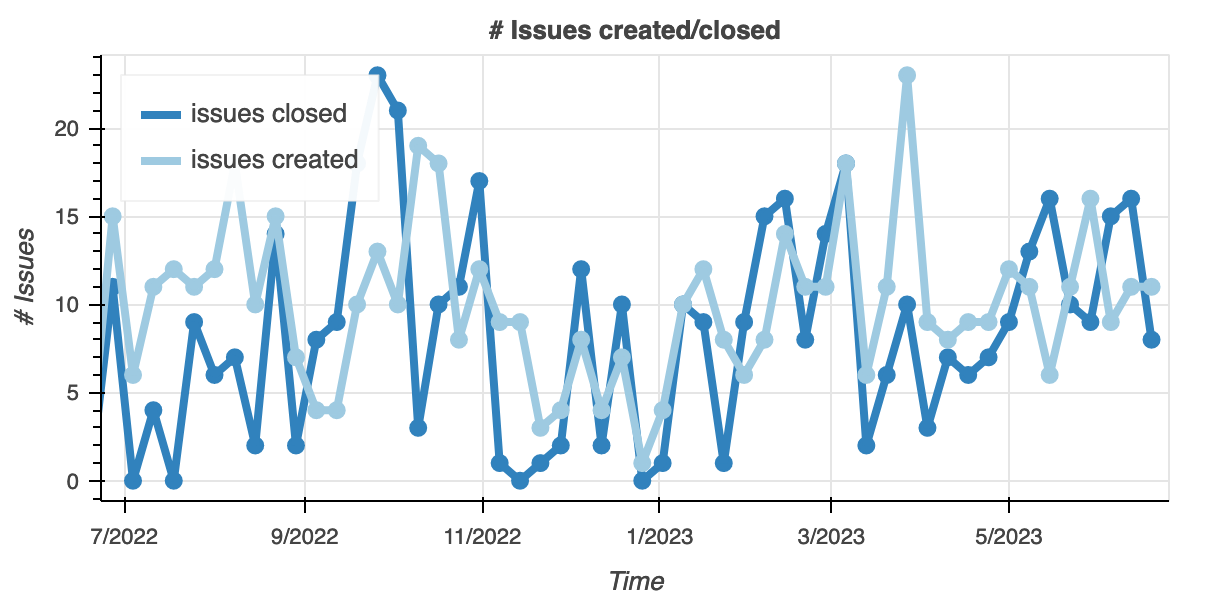
Figure 2. Number of issues closed vs created by month graph from cauldron.io.
Starter Project Health Model Metric #3: Bus factor
Bus factor [8] represents the number of people who make 50% of code contributions to the project (CHAOSS, n.d.). It is an attempt to predict how likely a project is to be able to sustain itself if one of the main contributors were to leave. The smaller the bus factor, the less sustainable the project might be. For projects supported by institutions, this can be a tricky metric to interpret. Important projects may be maintained by few individuals, but those individuals might be backed by organizations with long-term commitments to the project, even in the face of staffing changes. So while the bus factor may be small the level of the commitment from an institution may lower the apparent risk.
That said, when one of those active contributors leaves their job at an institution, the loss of knowledge can still be very impactful, and there is no guarantee that new staff will be as interested or skilled in the project as the previous contributor. Contributors are not interchangeable just because they work for the same institution.
Organizational diversity [9] is a metric outside of the starter heath model but related to bus factor. It measures how many organizations are represented in a project. If only one institution is contributing to a project, the organizational diversity is low and might be considered a risk for future sustainability much like bus factor. Again, the level of commitment from institutions (and their level of influence on the project [10], yet another metric) can also factor in here.
To further complicate matters, any metric counting contributors in GitHub is reliant on the way those contributors identify themselves. Contributors often do not use organizational email addresses for their account, and they may have more than one account over time. These factors make the bus factor and organizational diversity estimates, but they are still useful as first indicators of potential issues or questions to investigate.
The pie chart below demonstrates the rough bus factor for the DSpace backend repository alone (in this case it seemed to make the most sense to analyze the repositories separately). 50% of the chart is made up of eight contributors so the bus factor is 8 based on this chart. We know, however, that users can have more than one GitHub account so you would have to investigate further to get a really firm number. This chart is just for the last two years of commits and bots have been filtered out. This pie chart is not premade by cauldron.io but it can be created using the “My Workspace” feature in the Elastic Kibana interface that allows you to create your own visualizations from the repository data.
Understanding the current distribution of contributors is much easier in this visualization than on the GitHub Insights contributors page which is a long list of contributors over the life of the project.
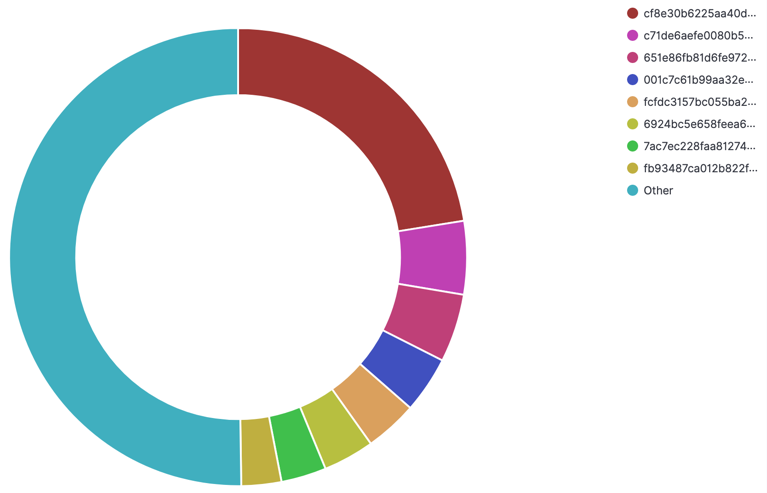
Figure 3. Custom pie chart of commits by user ID, made by using the cauldron.io interface into Elastic Kibana.
Starter Project Health Model Metric #4: Release frequency
Release frequency [11] is a measure of how often the project creates releases (CHAOSS, n.d.). “Release” can be defined in many different ways and some knowledge of how the project handles releases is necessary to measure this metric. For the sake of simplicity, we will look at releases on the GitHub platform, but meaningful releases can happen in many other places and in other ways. Because of the many meanings of release, cauldron.io does not offer a release frequency statistic. But for a project hosted and released on GitHub, release frequency can be observed from the repository’s releases page, for example https://github.com/DSpace/DSpace/releases.
When reviewing release frequency for a project, one thing you hope to see is semantic versioning, which allows you to understand the different types of releases being made – major, minor, and patch. [12] The frequency of major releases may be tied to the frequency of new feature releases. While the other types of release may indicate how often bugs are fixed and security patches released.
Conclusion
Metrics are useful for at least two reasons. First, people deeply involved and invested in a project may or may not have an accurate big picture of the project. Metrics can help confirm perceptions of the project, or point out areas where measurements are in disagreement with perceptions.
Second, the people making decisions about how to invest in software projects are often not the people who are involved in hands on implementation. In these cases, metrics can help tell the story of why an open source project needs support, or why implementing an administrator’s chosen project will be difficult.
Perhaps most importantly, reviewing metrics is a cue to engage in careful and strategic thinking about the relationship between an adopting library and the OSS community they are joining. We are long past the era where anyone thinks OSS means “free” but we still need ways to talk about the differences in expectations and resources of OSS adopters and OSS communities, and metrics are one tool for exploring those gaps.
Joining a community should be done with care and thought, and with the knowledge that OSS is an important place of collaboration between libraries. If we wish to continue to produce our own software and to have it be competitive with commercial solutions, we should use all the tools we have at our disposal to make our partnerships as productive as possible.
Acknowledgments
The author gratefully acknowledges the support of Paula Dempsey and the ALA Library Research Round Table mentorship program.
About the Author
Jenn Colt is an academic librarian in Cornell University Library’s technical services department where she is the head of the automation and metadata management unit. She manages data in the library’s open source library services platform, FOLIO, and also serves on the technical council of the FOLIO project. She has developed her interest in open source project governance and health through different levels of involvement in several library-related OSS projects. She is still a newbie in the CHAOSS project.
Notes
[1] Starter Project Health Metrics Model: https://chaoss.community/kb/metrics-model-starter-project-health/
[2] GrimoreLab: https://chaoss.github.io/grimoirelab-tutorial/
[3] Augur: https://github.com/chaoss/augur
[4] CHAOSS privacy and ethics guide: https://github.com/chaoss/community/blob/main/data-use-statement.md
[5] I spent a significant amount of time trying to install both Augur and GrimoireLab on my computer but was unable to do so successfully, which contributed to my choice of a hosted solution. That said, I think someone with more DevOps experience (and maybe not trying to use an M1 Mac) would probably have a much easier time. Self-hosting would be preferable for privacy purposes, especially for project maintainers who wish to do more in-depth analysis related to contributors.
[6] Time to First Response Metric: https://chaoss.community/kb/metric-time-to-first-response/
[7] Change Request Closure Ratio Metric: https://chaoss.community/kb/metric-change-request-closure-ratio/
[8] Bus Factor Metric: https://chaoss.community/kb/metric-bus-factor/
[9] Organizational Diversity Metric: https://chaoss.community/kb/metric-organizational-diversity/
[10] Organizational Influence Metric: https://chaoss.community/kb/metric-organizational-influence/
[11] Release Frequency Metric: https://chaoss.community/kb/metric-release-frequency/
[12] Semantic versioning: https://semver.org/
References
Metrics Model: Starter Project Health. CHAOSS. [accessed 2023 Jun 1]. https://chaoss.community/kb/metrics-model-starter-project-health/.
Gamalielsson, Jonas, and Björn Lundell. “Sustainability of Open Source Software Communities beyond a Fork: How and Why Has the LibreOffice Project Evolved?” Journal of Systems and Software 89 (March 2014): 128–45. https://doi.org/10.1016/j.jss.2013.11.1077.
Goggins S, Lumbard K, Germonprez M. 2021. Open Source Community Health: Analytical Metrics and Their Corresponding Narratives. In: 2021 IEEE/ACM 4th International Workshop on Software Health in Projects, Ecosystems and Communities (SoHeal). p. 25–33. https://doi.org/10.1109/SoHeal52568.2021.00010.
Linåker, Johan, Efi Papatheocharous, and Thomas Olsson. “How to Characterize the Health of an Open Source Software Project? A Snowball Literature Review of an Emerging Practice.” In The 18th International Symposium on Open Collaboration, 1–12. Madrid Spain: ACM, 2022. https://doi.org/10.1145/3555051.3555067.
Qiu HS, Lieb A, Chou J, Carneal M, Mok J, Amspoker E, Vasilescu B, Dabbish L. 2023. Climate Coach: A Dashboard for Open-Source Maintainers to Overview Community Dynamics. In: Proceedings of the 2023 CHI Conference on Human Factors in Computing Systems. New York, NY, USA: Association for Computing Machinery. (CHI ’23). p. 1–18. https://dl.acm.org/doi/10.1145/3544548.3581317.
Rosen H. (orcid: 0000-0001-6804-7073), Grogg J. (orcid: 0000-0001-5136-4507). 2021 Aug. LYRASIS 2021 Open Source Software Report: Understanding the Landscape of Open Source Software Support in American Libraries. http://hdl.handle.net/20.500.12669/97.

Subscribe to comments: For this article | For all articles
Leave a Reply