by Tim Ribaric.
Introduction
Many years ago, the Arduino was finding inroads to the library environment. It presented exciting possibilities to construct purpose-built hardware. It was also a platform that could be used to teach all about the exciting world of programming hardware in a fairly accessible way. As time progressed, many examples of designed to task hardware prototypes trickled into the library environment. Code4Lib Journal was there at the beginning and published write-ups that described how to put together appliances to suit Library needs. One of these works, also written by this author (Ribaric & Younker, 2013) focused on the development of a tool that took an updated look at an old fashioned paper and pencil problem. That write-up presented a way of replacing the library stalwart of paper tick sheets to track reference questions with a high-tech approach. Instead, you can tabulate these question by merely pressing a button on a nifty device plugged into a USB port. This button press would automatically tally against a database, or as presented in the write-up, added as a row in a Google spreadsheet. An amazing and time-saving device, it quickly showed some flaws in the execution of its tasks. As with any great invention, the first iteration proves that something can be done. Subsequent models strive to do things better. This article outlines the rationale, construction, and deployment of the successor to that original Arduino-based Tabulatron Mark 1.
First perhaps a look at where the Mark 1 fell short is warranted. Most predominantly the hardware did not interact with the host PC in a reliable way. The Mark 1 required two components that ultimately led to its demise. First and foremost, it required additional drivers so that the Windows operating system could make use of the device. As part of this, the operating system assigned a numeric code to the interface that the device was operating through. Arduino fans will know the joys and frustrations of needing to select “COM4” or “COM3” from the menus of the Arduino IDE to even enable communication to the device. This configuration is a machine by machine setting that follows no discernable sequence. Enabling and deploying these drivers correctly in a corporate managed software environment is persnickety.
The second component required by the Mark 1 was client software running on the PC. The purpose of this software was to listen to the USB device. When it received a signal from a button, it would make a web call to the Google spreadsheet to complete the tally. In a high-traffic area with desk staff logging in and out every hour, the communication from the device to the client software was difficult to ensure. It often did not work when a user logged into a computer without having the previous user log out. Compounded further is the necessity of telling the client software what COM port the Arduino was on. As discussed this was a machine to machine dependent value. An attempt was made to correct the shortcomings of the client software. It was originally written in Python Tinker which provided a simple graphic on the screen of the computer that showed the last button that was pressed. This first version was replaced with client software written in a paradigm more suitable for a Windows Operating System. A Visual Basic rendition of the client software was put together that handled the adjustment of the COM ports more efficiently. It also provided a way of tabulating questions if the device itself was not communicating to the computer correctly. This was accomplished through clickable buttons added to software. Despite these best efforts of modifying the client software, the drawbacks couldn’t be surpassed.
All of this is not to say that the Tabulatron Mark 1 didn’t find success in the Library environment in the Brock Library. In fact during peak utilization there were 4 Tabulatrons in use at various services points in the Library. This included a 5 button variant that was required at a service point staffed by Library Peer Assistants. The additional button was required to capture all of the different types of transactions that happened at that desk. It also had an added bonus of looking unruly (almost like a prop from a low budget science fiction movie) due to its size and bright red buttons. Figure 1 shows all of the different prototypes side by side, the two original Arduino based devices (labelled Tabulatron & Tab5) and the Raspberry Pi powered device.

Figure 1. All generations of Tabulatron next to one another, a Canuck quarter provides scale.
Alongside the technical challenges, some operational decisions probably also contributed to the flaws of the Mark 1. Data collection tended to be a black box. In production, the data was accumulated in a MySQL database that lacked a very granular way to analyze results or to export raw data in a way that could be analyzed in other tools, such as Excel. The decision to add the information into a MySQL database was to align the data collected by the Tabulatron with other Library usage data already being accumulated in that database.
A project was undertaken to solve all of these identified problems, made possible by the introduction of the Raspberry Pi computer. There is a vast collection of material written about the Raspberry Pi that is readily found on the internet. The main advantage of the Pi over the Arduino was the fact that it could run a complete Linux Operating system, meaning no additional computer is needed to interact with it. For the Tabulatron, this meant a simple and effective way to defeat all of the Mark 1’s problems. Most prominently, the PiTab Mark 2 could run totally autonomously. Once configured properly, all that would be required is to plug the device into a power source and it would connect to the Internet automatically, due to the Pi’s onboard wifi, and send button presses directly to the Google Spreadsheet. Further, the PiTab would periodically check to ensure its Internet connection was still working and alert the user if connection had dropped. Lastly, the PiTab created a button log that created a time stamped log file of every interaction that it tabulated. That way basic auditing could be completed. If there was a hiccup with the internet connection, the log file could be consulted to see if any details failed to make it to the database. The complete software necessary to run the PiTab has been made available via GitHub.
Physical Construction

Figure 2. Completed PiTab device.
Figure 2 shows the completed and running PiTab device in situ. It is a perfect blend of MakerSpace chic hitting all of the required components, blinky lights, metal bits, and 3D printed case. As this is a more sophisticated device than the Mark 1, a more sophisticated build is required. The PiTab was constructed with a maximum amount of buttons, as the intended use was in the Library MakerSpace, where a larger amount of information was required to be captured. It is also constructed using the latest generation of Raspberry Pi device (Pi 3 Model B). The reason for the choice was the horsepower it had and the on-board wifi. The footprint of the Pi Zero and Zero W made those models potentially svelte in construction but they were slightly underpowered and couldn’t handle the full load of tabulating button presses. Otherwise, using a different model of Pi is possible. The only drawback is that a hardwired network connection is required, or a USB-based wifi dongle.
Parts Required
- 2 LEDS (different color)
- 6 push buttons
- 330 OHM resistor
- AdaFruit RaspiZero Proto Shield
- Small gauge wire to connect the buttons
- Raspberry Pi Board
- MicroSD card for operating system for the Pi
- Sufficient Power Supply for Pi
- 3D printed case for Pi (This thingiverse offering is a good choice)
- 3D Button tabulation template (This thingiverse offering was created for this project)
- Crazy Glue
- Soldering Iron
Most material should be readily available at any typical MakerSpace. The only purpose-built component is the Proto Shield. However they are available for under $10 a piece from various distributors, including AdaFruit. The soldering process itself took approximately an hour and could be described as advanced beginner level of difficulty. Figures 3 & 4 should provide the basic schematics of how to connect the pieces. The recommended order of components is:
- Solder the 4 posts of each of the 6 buttons to the shield
- Solder the jumper wires of each of the 6 button to the shield
- Solder the LEDs
- Solder the resistor to the shield
- Solder the final jumper wire from the end of the resistor to the last hole in the GND line of the shield.
For a cleaner look, it is possible to complete steps 4 & 5 on the bottom of the shield. Figure 3 shows this detail.
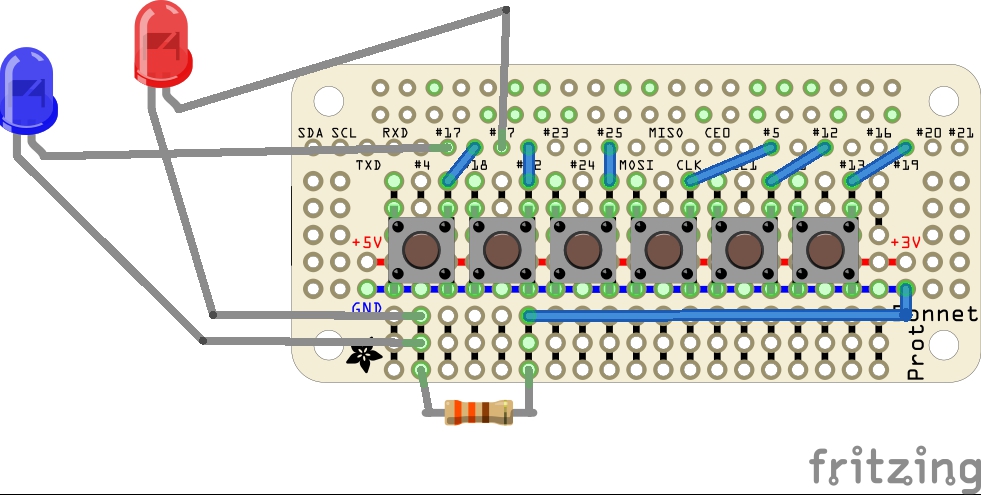
Figure 3. Fritzing Diagram of Proto-board with a components and connections shown.
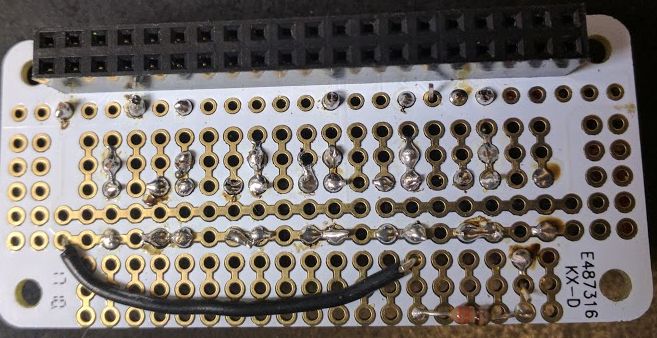
Figure 4. Underside of proto shield showing the resistor and ground wire from underneath.
Once the soldering is complete, all that is required is to print a case for the Pi that has the GPIO ports opened up. Using a two tone color pallet makes for a more sharp looking device. Lastly, print a button template that matches what actions each of the buttons performs. This placard can be crazy glued to the case for extra durability. It is possible to use printed labels instead, but that would lose the aesthetic.
Software Configuration
Once the construction is completed, setting up the software on Pi is the last step. There are many tutorials on how to install an operating system on the microSD card of the Pi, those instructions will not be repeated here. The official Raspberry Pi documentation provides a great write-up. Once this initial setup is completed, boot your Pi and enter the following once it is ready for input
sudo raspi-config
This will open a configuration utility. Navigate through the options found there to enable booting to the command line and auto login, save and exit. These two options are required to run the software.
Network Configuration
The next required step is to ensure that the networking is enabled and working correctly. The instructions that follow describe how to connect to an Eduroam WiFi network. Your individual situation may be different. Start by typing
sudo nano /etc/network/interfaces
Once that file opens, copy the contents of code listing 1 into the file. Save and exit the file. Ctrl+O followed by Ctrl+X
auto wlan0
allow-hotplug wlan0
iface wlan0 inet dhcp
wpa-conf /etc/wpa_supplicant/wpa_supplicant.conf
Code Listing 1. Contents of interfaces file
To complete the configuration, an additional config file is required. This file will need to be localized to match your environment. In particular, identity needs to be the username of the account and then associated password.
sudo nano /etc/wpa_supplicant/wpa_supplicant.conf
country=CA
ctrl_inter=DIR=/var/run/wpa_supplicant GROUP = netdev
update_config=1

network = {
identity="user@school.edu"
password="somepassword"
eap=PEAP
phase2="auth=MSVCAPV2"
ssid=eduroam
key_mgmt=WPA_EAP
}
Code Listing 2. Contents of wpa_supplicant.conf file
Once the localized contents of code listing 2 are in the config file, save and exit.
Tabulation
The last remaining piece now is to get the tabulation software running on the device. This can be accomplished by downloading the project from GitHub or cloning it. For simplicity’s sake, the instructions below show just downloading it, uncompressing and getting the config files ready.
wget https://github.com/elibtronic/piTab/archive/master.zip
tar -xvf master.zip
cd piTab
./deploy
nano settings.py
The code itself is written in Python3. The command to run ‘deploy’ in line 3 is actually a script, shown in code listing 3. It installs the required libraries needed to run the software. The last line opens up the config file in a text editor and is shown in code listing 4. Change the values in the 6 variables to reflect the web calls you would like the buttons to perform. This is explained in more depth here. Save and exit.
#!/bin/bash

#Code and Python get ready
cp settings.orig settings.py
sudo apt-get install python3-gpiozero python3-requests
Code Listing 3. contents of deploy file
#Change to localize

#Where you want to Log file of button presses to live
PATH = "piTab"

#Google Form Key
formkey = "dHdaS1NkdEtHY2Y5YkNjaDVfNGFpSkE6MQ"

b1Text = "3D"
b2Text = "VR"
b3Text = "CNC"
b4Text = "Workshop"
b5Text = "Training"
b6Text = "Other"

#What URLs should be triggered by button presses
#Details here:
# http://journal.code4lib.org/articles/8200#googledocumentsspreadsheetform
BUTTON_1 = "https://docs.google.com/spreadsheet/formResponse?formkey="+formkey+"&ifq&entry.1.single="+b1Text
BUTTON_2 = "https://docs.google.com/spreadsheet/formResponse?formkey="+formkey+"&ifq&entry.1.single="+b2Text
BUTTON_3 = "https://docs.google.com/spreadsheet/formResponse?formkey="+formkey+"&ifq&entry.1.single="+b3Text
BUTTON_4 = "https://docs.google.com/spreadsheet/formResponse?formkey="+formkey+"&ifq&entry.1.single="+b4Text
BUTTON_5 = "https://docs.google.com/spreadsheet/formResponse?formkey="+formkey+"&ifq&entry.1.single="+b5Text
BUTTON_6 = "https://docs.google.com/spreadsheet/formResponse?formkey="+formkey+"&ifq&entry.1.single="+b6Text
Code Listing 4. contents of settings.orig
The last piece is to run the software that will listen for the button presses and send the appropriate actions. The default is to print these activities to the screen, so if a monitor is still plugged in it is possible to see visual output of the software running.
sudo python3 piTab.py
The code itself is written as plainly as possible and presented in code listing 5. Perhaps, however, it is worth looking at specific lines of code to demystify the important main components.
#Tabulatron on PI
# Needs python3

from settings import *
from gpiozero import LED, Button
from time import sleep
from datetime import datetime
from signal import pause
import requests

#Communication Status LED on GPIO 17
status = LED(17)

#Script still running Status LED on GPIO 27
working_status = LED(27)

# Six buttons connected to close GPIOS
b1 = Button(18)
b2 = Button(22)
b3 = Button(25)
b4 = Button(5)
b5 = Button(12)
b6 = Button(19)

#unique light sequence for bootup
def good_status():
    status.on()
    sleep(.5)
    status.off()
    sleep(.5)
    status.on()
    sleep(.5)
    status.off()
    sleep(.5)

#short blinks good
def boot_seq():
    status.on()
    sleep(1)
    status.off()
    sleep(1)
    status.on()
    sleep(1)
    status.off()
    status.on()
    sleep(1)
    status.off()
    sleep(1)
    status.on()
    sleep(1)
    status.off()

#log button presses to make sure they all work
def log(b):
    l = open('button_log.log','a+')
    l.write(str(datetime.now())+" , "+str(b)+"\n")
    l.flush()
    l.close()

#Just let's make sure connectivity is up
def check_connect():
    try:
       r = requests.get("http://google.com")
    except:
       log("connection_test_failed")
       print("con_test_failed")
       status.on()
       pause()

    log("connection_test_positive")
    print("cont_test_positive")
    good_status()

if __name__ == "__main__":
    print("booting...")
    working_status.on()
    check_connect()

    while True:
       if b1.is_pressed:
             print("b1")
             r = requests.get(BUTTON_1)
             log(BUTTON_1)
             good_status()
       if b2.is_pressed:
             print("b2")
             r = requests.get(BUTTON_2)
             log(BUTTON_2)
             good_status()
       if b3.is_pressed:
             print("b3")
             r = requests.get(BUTTON_3)
             log(BUTTON_3)
             good_status()
      if b4.is_pressed and not b6.is_pressed:
             print("b4")
             r = requests.get(BUTTON_4)
             log(BUTTON_4)
             good_status()
       if b5.is_pressed:
             print("b5")
             r = requests.get(BUTTON_5)
             log(BUTTON_5)
             good_status()
       if b6.is_pressed and not b4.is_pressed:
             print("b6")
             r = requests.get(BUTTON_6)
             log(BUTTON_6)
             good_status()
       if b6.is_pressed and b4.is_pressed:
             print("con_test")
             check_connect()
    sleep(1)
working_status.on()
Code Listing 5. Contents of main script piTab.py
Line 5 – the gpiozero library is the code that allows Python3 to interact with the GPIO ports on the Raspberry Pi. This is seen in lines 12 – 15 that enable LED output at ports 17 & 27 and code lines 18 – 23 that declare a series of variables that will allow the buttons on the proto shield to send input to the Pi
Line 54 – the log function creates a text file log of the buttons pressed on the device. Useful for auditing the device to make sure it is working as expected.
Line 61 – check_connect is a function that check to ensure that the network connection is still working. If it is possible to retrieve the Google homepage the function will exit successfully. If not, and there is network trouble, the LEDs will flash incessantly.
Line 79 – Is the beginning of the main loop of the script. Once it enters into an infinite loop at line 79, the script listens for button presses. The gpiozero library is constructed in such a way that debouncing is not required while waiting for button presses. This loop also has been constructed in such a way that a check_connect can be called by pressing down button 6 & 4 simultaneously. The PiTab has its very own Konami code.
Running at Startup
The last remaining task to ensure that the tabulation software runs automatically when the device starts. This is accomplished by adding a task to the crontab. Start with the following
crontab -e
That will open a text editor. Simply add the line from code listing 5 to the end of the file. Save and exit. Now when the device reboots it will run a script that starts the tabulation script and is spelled out in code listing 6.
@reboot sudo /home/pi/piTab/boot_script
Code Listing 5. Line to add to crontab file
#!/bin/bash
sleep 5
cd piTab
sudo python3 piTab.py
Code Listing 6. Contents of boot_script file
Congratulations. You know have a fully autonomous tabulation device that only needs power and nothing else to function.
Visualizing Results
If used consistently, the data accumulated by the Tabulatron quickly pile up. As one can imagine, there are many ways to utilize this. It can be used to decide staffing levels at service points, it can serve as the basis of reports required for governing bodies, or, in fact, be the basis of visualizations for both internal and external users. The required components are simply some HTML and Javascript. Many different visualization libraries and paradigms are available but the common feature of most of them is the ability to read in data via a CSV file. Consequently once data is entered into a Google Spreadsheet it is easy to convert into an web accessible CSV file. This is completed by first enabling ‘Publish to the Web’ for the spreadsheet via the ‘File’ menu of the Google Spreadsheet in question. Figure 5 shows this. In the second drop down box change the value to Comma-separated values and clicking Publish.
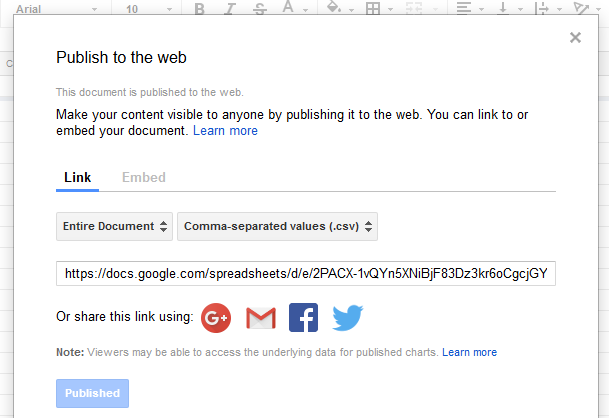
Figure 5. Enabling access to spreadsheet as a CSV file.
This will provide you with a URL to a CSV file that you can then put into a JavaScript visualization framework. In this example this is accomplished with D3, the template for which is also hosted on GitHub. The added bonus is that the HTML is dynamic and will update automatically as more entries are added to the spreadsheet. Figure 6 shows a slow day at the desk.
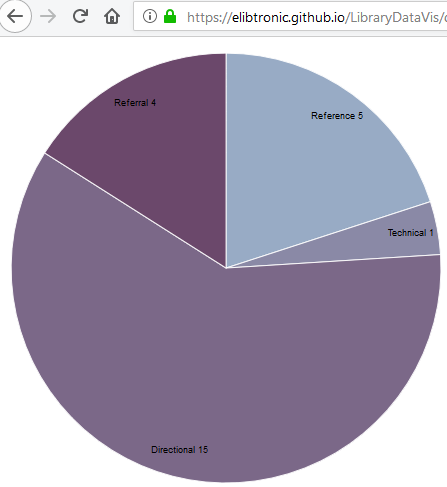
Figure 6. D3 Visualization of one fine day at the desk.
Daily statistics are just the beginning, by accumulating this data for say, a yearly period, it is possible to track trends over time. Figure 7. shows a snapshot of 2017 accumulated by Tabulatron Mark 1. The Javascript and HTML to generate this visualization is also available via GitHub.
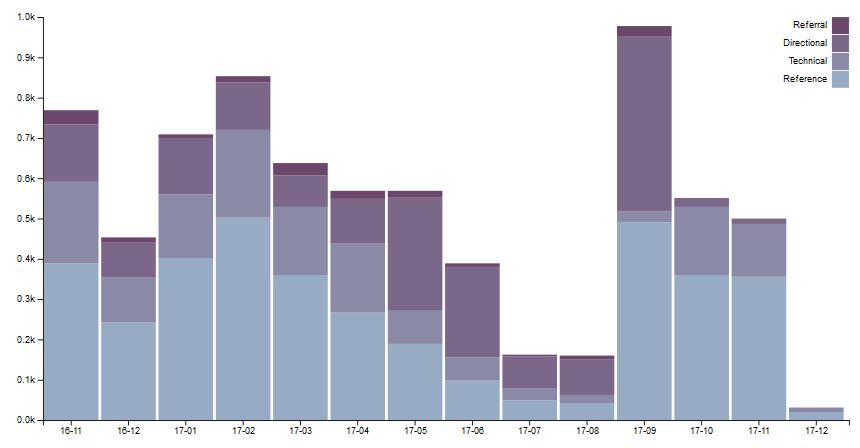
Figure 7. Transactions tabulated at the Helpdesk at Brock University November 2016 – Dec 2017.
Conclusion
You will hear a lot of anecdotal stories about the waxing and waning of traffic at service points in Library spaces. This is often used to signal larger trends, a perfect example being the removal of Librarians from service points. Telling stories is an important way of communicating successes, but, with the addition of a device such as a PiTab, it becomes very simple to demonstrate exactly what is happening somewhere. Figure 7 demonstrates that the summer lull is immediately followed by the September crush of people trying to understand where things are in the Library and getting that first wave of ‘how do I do this research’ questions asked. A trend we all intuitively experience but now becomes possible to quantify. Particularly with more institutions bringing Makerspaces online the materials and expertise needed to construct devices like the PiTab are increasingly becoming easy to acquire. The PiTab also shows the importance of iteration and the value of prototyping. Instead of struggling with a mostly functional device, it made sense to go back to the bench and develop a new revision of a plan that fixed the problem. This does often result in putting more effort into solving the same problem, but once those challenges are overcome the payoff is worthwhile.
The author would like to acknowledge the Brock MakerSpace for material and support for this project.
References
Tim Ribaric, Jonathan Younker. “Arduino-enabled Patron Interaction Counting” code4lib Journal, Issue 20, April 14, 2013. http://journal.code4lib.org/articles/8200
About the Author
Tim Ribaric (tribaric@brocku.ca) is the Digital Services Librarian at Brock University located in St. Catharines Ontario. He can be found on twitter @elibtronic. He is also the administrator for http://lisgrievances.com

Subscribe to comments: For this article | For all articles
Leave a Reply