By Paul Gallagher
Introduction
The Wayne State Library System (WSULS) has three main facilities, two special libraries (law and medical), an extension center library, and over 3.6 million items, creating a formidable challenge to locate materials. Some collections are hidden from public view, and a large subset is available only on request. In August 2009, development began on a mapping system to help patrons locate materials from the library catalog, and in February 2010, the system became available to the public. The mapping application shows the locations of shelved materials and provides information for over three-hundred library collections; providing a wealth of information on how to use the WSU Libraries.
This article will be of interest to library software programming and systems staff interested in developing their own mapping application, and provides an overview of the architecture as well as the technologies reviewed during the research phase. Additionally, some of the lessons learned are discussed.
Relevant Examples
Numerous institutions have integrated stack maps into their catalogs, and the methods employed are as unique as the libraries themselves. Some examples of catalog mapping systems include Florida State University [1], and a Koha based implementation by Near East University [2], which contains animated arrows to point patrons to the right location. In 2007, Wichita State published a paper providing details on how their system handles complex shelving situations using a custom data processing model [3]. StackMap, LLC, a commercial entity that “provides comprehensive mapping software for libraries,” has links on their website to examples at Stanford University and Boston College [4], and Canterbury Christ Church University has a document online describing the system used in their catalog [5]. In each case the approach is typically the same: use bibliographic information from the catalog to discern which map to display, and provide a method to view the map.
General Methods Available for Library Mapping Applications
There are several options to create maps of library holdings, from using simple images to implementing complex systems utilizing GPS, each having its own development pros and cons. While no single technique would work for all libraries, an overview of the technology surveyed will be useful for others considering a similar project.
The simplest solution is to create a set of images for each call number range, then use catalog data to evaluate an item’s location and provide the correct image. This method is relatively easy to develop: the maps could be created with illustration software and updated by uploading new files to a web server. One additional benefit is the potential to use more sophisticated content, such as animated GIF’s to display directional arrows or HTML to present additional information. However, this method can be difficult to sustain when hundreds of maps need updating as collections shift.
A more complicated solution is to create maps using vector coordinates and employ programmatic methods to display material locations. In this model, coordinate data is held in a data source and program code converts the coordinates to a web graphic. However, creating vector maps is almost impossible without graphics software, as creating precise X/Y coordinates would be difficult without a graphical means to create the shapes needed to define a map. While building maps completely from coordinates may have some benefits, it would duplicate readily available technologies, and overlap commercial software such as Adobe Illustrator and ArcGIS. Converting hundreds of coordinates to web graphics on demand could be challenging to program, and could have processing requirements undesirable in a web environment.
A similar approach using a hybrid method involves creating maps with readily available software, then programmatically adding the location of a requested item. For example, Scalable Vector Graphics (SVG) or a similar format could be used to implement this method by using illustration software to create the base map, and then modifying the SVG XML to indicate the location of an item. However, SVG is not a completely adopted format, and some browsers, most notably Internet Explorer, require the installation of a plug-in to view the file. While additional programming could convert the SVG files into a more common format, it would entail additional image processing and add a level of complexity to the project. This approach also involves the creation of maps in vector format, a potentially large project for an institution with multiple facilities if such maps are not readily available.
A more challenging solution involves the use of global positioning system (GPS) coordinates to provide maps similar to those available with Google Earth. Using the Google Earth API, maps could be overlaid on top of actual locations, and items displayed using coordinates derived from GPS. A benefit to this approach is the possibility of leveraging mobile GPS, and “pointing” patrons to the item using a navigational style display. However, the development of such a system would once again be a significant project, and the accuracy required to capture item locations would have to be extremely good – or the required shelf may end up on the wrong side of the library. During some initial testing at WSULS, capturing a GPS signal indoors was unreliable, and the typical degree of accuracy (30-50 feet) was not sufficient to map item locations.
Another option, the one that WSULS selected, is a hybrid of the static and vector map designs. With this model, the maps are developed as “templates” which contain the basic floor layout, including the stacks and other navigational elements such as restrooms and staircases. The material locations are held in a data source, and the maps are dynamically created with a combination of the static template and the indicator areas using coordinate data. This provides a sharp reduction in the number of static images that require updates when collections shift. In the example shown in Figure 1, this library floor would require eleven maps to indicate each shelving range, but the hybrid system requires only one background map – with specific areas highlighted using coordinate data.
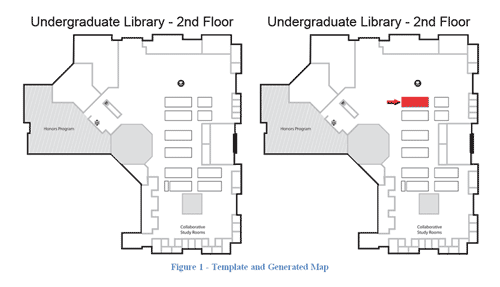
Figure 1. Template and dynamically created map.
While this approach entails creating an interface to capture call number ranges and coordinate information for highlight areas, this was found to be a relatively easy proposition. This method provides a best of breed approach, using the simplicity of a static image for the background, and using coordinates to create the dozens of variants that specify specific call number ranges. In addition, this approach allows for the reuse of existing library floor maps, and not having to create entirely new maps exclusively for the system (as would be the case with vector maps).
Accessing the System
There are two ways to access the system: either via the two WSULS catalogs (Millennium “Classic” and Encore), or a form designed for use at the reference desk. In this sense, the application can be accessed in two tiers, the catalog tier, and the form tier. An example of both methods is shown in Figures 2 and 3.
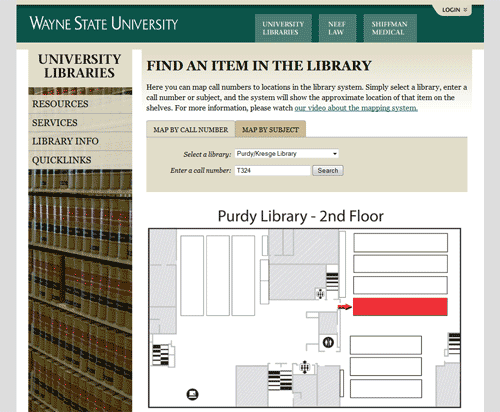
Figure 2. Example of the reference form method of access.
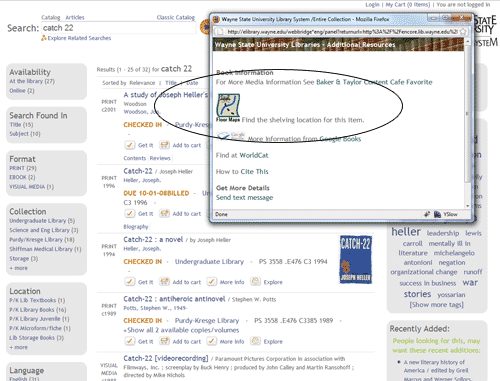
Figure 3. Example of the catalog method of access.
Reference Form
The reference form provides a simple method to find the location of a call number in any of the libraries, primarily at the reference desk. Users simply select a library, enter a call number, and a map of the call number range is dynamically created and displayed to the user. An overview of the steps is shown in Figure 4.

Figure 4. Use of the reference form to access the mapping system.
The reference form and the catalog link use the same code to produce the maps, but the form uses less processing as it does not harvest bibliographic information. However, this method has its shortcomings, as it only works with shelved materials that have an assigned call number, and is not aware of an item’s availability or if it is being mapped at the correct library. The catalog-based method can map a much larger variety of materials, including items without call numbers or in closed collections, and displays an item in the correct library, as opposed to only mapping a call number to a building.
An additional feature allows the reference form to display maps based on Library of Congress (LC) subject terms. The functionality works the same as the call number form; select a library, select a subject, and the map is displayed (shown in Figure 5). The dropdown menu used for the subject terms is a jQuery plug-in that supports both pagination and searching, and was implemented to make browsing through the terms easier [6]. Both reference forms are available on the WSULS website at: http://www.lib.wayne.edu/maps
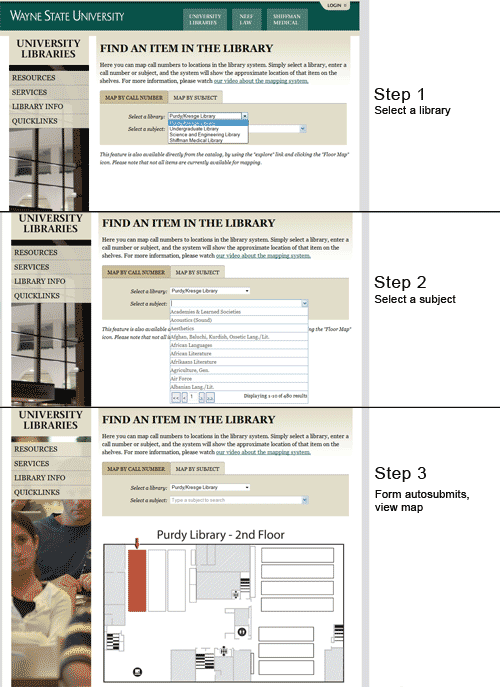
Figure 5. Reference form showing the map by subject feature.
Catalog Mapping
The mapping system is primarily used from the catalog, and is accessed by clicking the explore icon on the search results page, and then the “Floor Maps” icon. The system will then harvest the catalog data, and display the map or content. An overview of the process is shown in Figure 6.
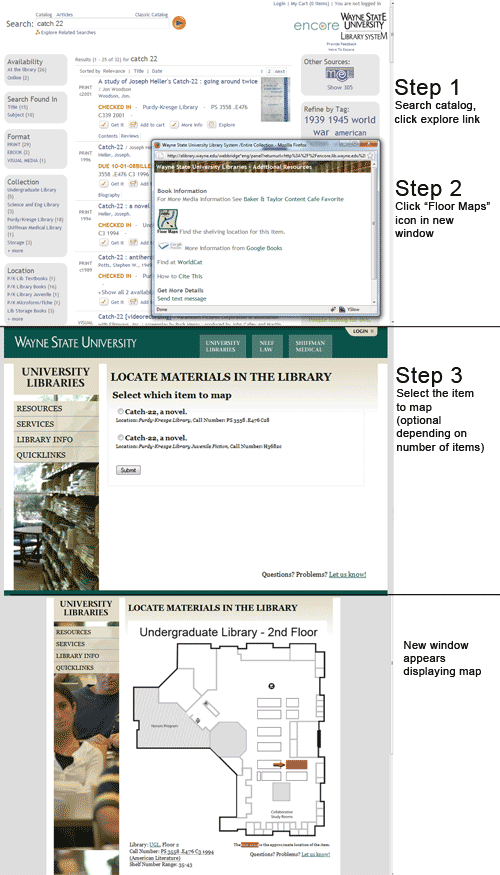
Figure 6. Steps to use the mapping system from the catalog.
This method of access has additional capabilities compared to the reference form, notably the ability to display items other than just shelved items with call numbers. The system checks the catalog’s location code, and if it is a shelved collection, displays the map; otherwise it displays static content that describes how to access that collection. The static content is HTML, and can be anything that describes a collection, including images, a redirect to another website, and embeddable content such as Google Maps. In Figure 7, two examples are shown of non-shelved materials – one displaying a driving map to an extension center, the other a photograph of a hard to locate collection.
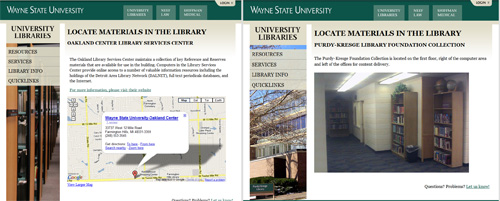
Figure 7. Examples of information provided for non-shelved collections. In the left image, a driving map is provided using the Google Map API, and in the right, an image is used to show a hard to find collection. Both methods use HTML to provide the content.
Architecture
The system was designed using a tiered access model, as both methods use the same display code, but the catalog requires additional data gathering. Figure 8 represents the overall architecture, with the top area representing access from the catalog, and the bottom the reference form and content display functionality. Briefly, the catalog link forwards the OCLC number to the index.php page, which queries the catalog and, if necessary, asks which item to map with the map_select.php page. Once the library and call number data is obtained, the system forwards the call number and library to the map_display.php page, where the location is checked for which type of content to display, and finally the map or content is displayed. In the case of the reference form, the form forwards the library and call number to the map_display.php page directly, and the system displays the map.
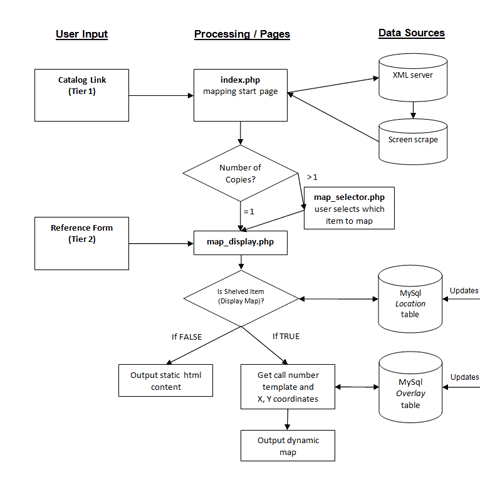
Figure 8. System Architecture.
Mapping from the Catalog
When using the link from the catalog, the process makes use of the Millennium WebBridge feature to add a link into the catalog containing the URL shown in the first example in Figure 9. While the exact steps are beyond the scope of this article, this involves setting WebBridge to display a link with information, notably the OCLC number, from the bibliographic record.

Figure 9. URL processing steps used to harvest data from the Millennium ILS.
Next, the OCLC number in the WebBridge link is used to query the Millennium XML server, returning the internal record number and conducting a final request, a “screen scrape” of the item detail page. This final step unlocks any of the data available on the Millennium item detail page, including the number of copies, locations, and call numbers. While it would have been desirable to gather the data in single step (and not have to depend on screen scraping techniques), the Millennium system presented some challenges to accessing its holdings information. The XML server does not reliably return the number of copies and locations, and conducting the screen scrape using the OCLC number occasionally produces invalid results. This method – while somewhat complex – does consistently provide the data needed to map the item.
There is one additional check for the number of copies, and if there are multiple copies, the map_select.php page prompts the user as to which item to map. This is a necessary step, as multiple copies of the same item may be located in different locations. In the case of a single item, the system forwards the request to the map_display.php page, which displays the map or content about that collection.
Outputting Content / Reference Form
Once the library and call number have been obtained through the catalog or reference form, the data is forwarded to the map_display.php page for display. If the reference form is used, it simply submits the data directly from the form, and the content is prepared the same as if the request came from the catalog method of access.
The collection locations and call number ranges are held in two tables in a MySQL database. The tables employ a hierarchal relationship, the first containing the collection locations and the second table containing a list of call number ranges and coordinates. Each location in the location table contains a field that specifies whether to use the overlay table and retrieve the coordinates to display a map, or just to display its content about that collection. An example of the structure is shown in Figure 10.
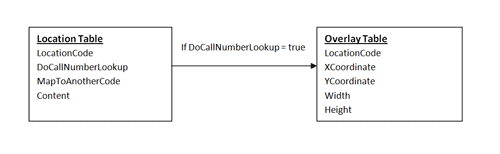
Figure 10. Relationship of two MySQL tables used to hold location information and call number overlay coordinates.
The system evaluates the location code in the location table, and has one of three options – query the overlay table and produce a map, redirect to another code, or display content. The output is determined by the DoCallNumberLookup and MapToAnotherCode fields in the location table that specify what content to display when queried by the system. An example query and response is shown below:
SELECT *
FROM LocationTable
WHERE LocationCode = "pbstk"
| LocationCode | LocationName | DoCallNumberLookup | MapToAnotherCode | Content |
| pbstk | Purdy-Kresge | true | null | null |
The last three fields specify the next step, as either the DoCallNumberLookup, MapToAnotherCode, or Content field will have data; some simple program logic determines which field is not null, and reacts accordingly. In the above example, DoCallNumberLookup would trigger a query of the Overlay Table, and get the X, Y coordinates used for the overlay map. The specifics of each type of content are detailed below:
1.) Static Content (Content)
In this case, HTML is displayed to provide information about the location. This is used to provide details about locations that are not mappable, such as closed collections. Other examples include directions to extension centers, links to other web resources, or redirect to an item request form.
2.) Mapped to another code (MapToAnotherCode)
For this case, the location code is mapped to another code. While at first this seems counterintuitive, it enables the ability to create “catch all” codes, such as the circulation desk. For example, reserved items are held at circulation desks; and reserve location codes are mapped to the circulation desk code, with the system displaying the information about how to find the circulation desk.
3.) Call number lookup (DoCallNumberLookup)
The third case is to use the call number system to show the appropriate map for shelved materials. The system conducts an additional query with the call number, and creates the appropriate map for that item. This step entails some additional logic to determine the library, floor, and call number range:
3.1) Query the Overlay Table for the call number range
The overlay table is queried to determine the correct call number range and return the coordinates used for the overlay. The query uses the library location code and a normalized version of the item’s call number to retrieve the correct call number range. This returns the information needed to produce the dynamic map, including the template, an X/Y coordinate for the indicator, and the width and height to describe the size of the highlighted area. An example of this query is shown along with the returned data:
SELECT *
FROM mapscall
WHERE LocationCode = "pbstk"
AND CallStart <="161900.3558"
AND CallEnd >="161900.3558"
| LocationCode | Template | CallStart | CallEnd | Width | Height | X | Y |
| pbstk | pbstk | 161900.015919 | 161900.35660 | 238 | 44 | 524 | 131 |
3.2) Merge the template and highlight image
The final step is to merge the template and overlay image using the PHP/GD image library [7]. The basic steps involve using two image files, one of the background map template, and another image containing only the colored area used as the item indicator. The GD imagecopymerge function combines the two image files and creates a composite image, using X, Y coordinates for the highlighted area from the overlay table. Additional logic during this step checks if the dynamic image has already been created for caching purposes. An example of the function used to merge the files is shown below.
The PHP/GD function definition:
//Gets or creates the call number map image
function displayOverlayImage($mapTemplate, $dst_x, $dst_y, $src_w, $src_h)
{
// Create image instances
$img = 'maps/templates/'.$mapTemplate.'.gif'; //template
$imgOutput = 'maps/' . $mapTemplate.$dst_x.$dst_y.$src_w.$src_h . '.gif'; //merged file
//Check for a cached file
if (file_exists($imgOutput))
{
return $imgOutput;
}
else
{
//Create the image memory streams
$dest = imagecreatefromgif($img); //get the template image
$src = imagecreatefromgif('maps/templates/overlay.gif'); //get the overlay
//merge the images
imagecopymerge($dest, $src, $dst_x, $dst_y, 0, 0, $src_w, $src_h, 90);
// Output and free from memory
$image = imagegif($dest,$imgOutput);
imagedestroy($dest) or die (‘failed imageDestroy(1)’);
imagedestroy($src) or die (‘failed imageDestroy(2)’);
return $imgOutput;
}
}
Updating the System
Updating the system is completely web based, and as the map display design is based on two database tables holding both collection location and coordinate information, the updating system mirrors this structure. Staff can modify the location code content using a grid view format for the location table, or update the call number ranges and indicator areas in the overlay table using a custom-built PHP form.
The grid view tool used to update the location code content is simple in its implementation, and connects to the MySQL table without any additional logic. All codes can have static content entered, be mapped to another code, or be assigned to do call number lookups. The grid view (shown in Figure 11) used is a GNU/GPL application named PHP DataGrid, available at http://phpbuilder.blogspot.com/.

Figure 11. Data grid used to update location information.
To update the call number range and indicators for the overlay table, a custom form was created that allows for the creation and modification of call number ranges. JavaScript is used to provide a two-click mechanism that overlays a red box over the appropriate area for that call number range, and the resultant X/Y coordinates are stored in the database for use with the image merging function (shown in Figure 12). Users can select a library and floor, add the call numbers, and click on the appropriate area to draw a box over the location to be highlighted.
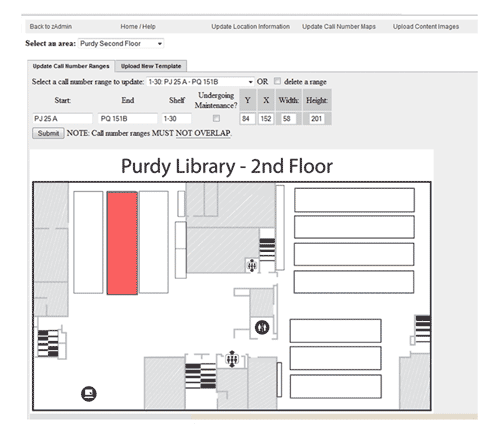
Figure 12. Call number overlay update form.
Results and Lessons Learned
Initial results have been positive. Usage is steadily increasing as the system gains more notice by patrons and staff, and growth will likely continue as other resources are integrated into the system. It is important to note the application’s dependence on staff to keep the ranges and location content updated. By collaborating with the WSULS Access Services early in the process, the system is now used during large material shifts, and is updated as a normal part of their collection shifting workflow. Without having a simple means to manage the content, the data could quickly grow stale, and send patrons to the wrong location.
One observation since the initial development has WSULS reevaluating how accurately the system maps call number ranges. The current implementation displays only large call number ranges, which may contain as many as forty individual shelving units. The expectation was that this would minimize updating, but shifting has not been as common as expected. Additionally, range updates have to be recorded to produce new signage, creating a situation where the data is entered twice, once to create the new signage for the cases and again for the mapping system. An enhancement currently under development has the mapping update form update the mapping system and generate new signage all in one step, simplifying workflow. As a result, the system will provide more specific locations, and prevent having to enter the updated call number ranges twice.
One challenge encountered was the integration with the Encore catalog. When development started, the Millennium WebBridge feature was not yet available for the Encore OPAC, and it was unclear how the mapping link could be added into the catalog interface. With WebBridge implemented at WSU, the mapping link appears under the “explore” icon located for each item in the search results. This is not an optimal situation, as users must click on the explore link while viewing the search results, effectively hiding the link from plain view. Even more problematic is that WebBridge added links do not display on the item detail page, making the mapping link hidden to all but the most curious users. While future versions of Encore may remedy this problem, for now visibility is limited. Ongoing work to feature the reference form more prominently on the library website and the creation of an instructional video may help mitigate this problem. In addition, the older “Millennium Classic” catalog does contain the link on the item detail page, so for classic users this has not been an issue. For an example of the WSULS Encore catalog, see http://encore.lib.wayne.edu/
Overall, the system is a useful addition to the library catalog, and the ability to create maps for patrons is a welcome addition at the reference desk. Future enhancements under consideration involve using the system for other applications, such as reserving study spaces. Additionally, as mobile GPS technology becomes more accessible, the system could provide a platform for experimenting with location awareness – and be able to point to specific item locations. The system is being considered for release as an open source application, based on demand and the work involved in refactoring the code to work as a standalone application. While there is not a timeframe for a possible release, updates about the availability of the application will be posted to the library website at http://www.lib.wayne.edu/maps/updates/. The project is considered a success by both staff and patrons, and while technology alone cannot make libraries more accessible, it can provide useful tools to help keep patrons from getting lost in the stacks.
References
[1] Florida State Library Homepage. http://www.lib.fsu.edu
[2] Near East University, Grand Library Catalog. http://library.neu.edu.tr/cgi-bin/koha/opac-main.pl
[3] Dynamic Map Display in Web OPAC: An Experiment at Wichita State University Libraries. http://www.white-clouds.com/iclc/cliej/cl24LDD.htm
[4] StackMaps, LLC. http://stackmap.com/public/
[5] Ekins, Andy. Interactive Map Documentation. https://docs.google.com/Doc?docid=0AYrDyXSoQkgfZGRyd2pnMjVfMzFocW1iemhnag&hl=en_GB
[6] jQuery FlexBox. http://flexbox.codeplex.com/PHP GD Image Library. http://php.net/manual/en/book.image.php
[7] PHP GD Image Library. http://php.net/manual/en/book.image.php
About the Author
Paul Gallagher (paul.gallagher@wayne.edu) is the Developer Librarian for the Wayne State University Library System with the Digital Library Initiatives Team. Paul is a new librarian after recently completing his MLIS at WSU’s School of Library and Information Science. He has over ten years experience in the private sector including work in application development, technology instruction, and systems administration.

Mobile Website Development: From Site to App | ASIS&T Bulletin, 2011-10-08
[…] [5] Gallagher, P. (June 22, 2010). Map it @ WSU: Development of a library mapping system for large academic libraries. Code{4}lib journal, 10. Retrieved August 21, 2011, from http://journal.code4lib.org/articles/3072. […]
You are here: Rethinking the Library Map | ANTELOPE AS DOCUMENT, 2013-07-31
[…] would utilize the vector images to create finding paths and circle book locations, similar to the Map it @ WSU project, should the library decide that they are interested in utilizing this technology. One of my […]
Using GIS to Improve Library Services | Designer Librarian, 2014-10-29
[…] You do need to create a catalog mapping system for this to work though. Check out what the Wayne State Library System did (to benefit their […]