by George Macgregor
Introduction
Significant resource has been invested over the past decade to expose rich digital collections using a variety of repository technologies. This investment has resulted in unprecedented usage of institutional repositories, as evidenced in the UK by services such as IRUS-UK which, at time of writing, has recorded 146,398,650 COUNTER compliant downloads from participating repositories since 2013 [1]. However, many institutions continue to demonstrate limited commitment to ensuring their scholarly content is exposed optimally. This also extends to a failure to ensure their repository is as usable as possible. In fact, many repositories have not undergone development beyond their original establishment and maintenance of its scholarly collection. The reasons for this inertia are complex and it is not the purpose of this paper to explore them. However, it is sufficient to state that such institutions may attempt to promote their repository content but if few attempts have been made to optimise for discovery, then these repositories may find themselves under exposed [2] and under used.
Significant future challenges are facing Open Access repositories, as well as the open science movement more generally [3]. Competing scholarly platforms, many of which are proprietary, appear to be growing in popularity yet demonstrate poor support for open standards or prevalent open science technical protocols, as well as low levels of integration with open scholarly infrastructure. It is therefore imperative that user expectations of repositories are better met and improvements to the index penetration and exposure of their scholarly content demonstrated. Only by doing this will scholarly Open Access repositories validate their continued relevance in open scholarly communication.
In this contribution we experiment with a suite of repository adjustments and improvements performed on Strathprints [4], the University of Strathclyde institutional repository powered by EPrints 3.3.13. These adjustments were designed to support improved repository web visibility and user engagement, thereby improving usage. Although the experiments were performed on EPrints it is thought that most of the adopted improvements are equally applicable to any other repository platform. Following preliminary results reported elsewhere [5], and using Strathprints as a case study, this paper will outline the approaches implemented, report on comparative search traffic data and usage metrics, and deliver conclusions on the efficacy of the techniques implemented. The results are likely to positively inform the work of repository practitioners and open scientists.
Background
Given the importance of institutional repositories in promoting open scholarly communication and the discovery of open research content, it is perhaps surprising to note that only a limited amount of prior work has been documented on repository discoverability approaches and their evaluation. Many contributions note the importance of repository discoverability and report on some of the factors that should be addressed [6], but few then evaluate the impact of these factors. Most recently, however, the Code4Lib Journal published a contribution on the use of microdata within institutional repositories as a “low barrier” means of better exposing contents to Google [7]. This work described the implementation of Schema.org within DSpace. It is a notable contribution owing to the fact that repository support for Schema.org is a feature of the COAR Next Generation Repositories agenda [8]. Pekala reported generally positive results but conceded that demonstrating its impact was difficult.
Kelly and Nixon reported on the use of general SEO techniques on three separate UK repositories [2]. This work relied on analytics services and tested early data indicating the importance of blogs in driving repository web traffic. The authors reported mixed results and therefore concluded that further work was required in order to refine their methodology and better understand search engine behaviour. In a poster presented at the 2017 Repository Fringe Conference, the present author evaluated the preliminary results derived from a series of repository enhancements designed to improve web impact and discoverability. While some encouraging evidence was reported about the impact of specific repository enhancements, the small nature of the evaluation prohibited any wider conclusions to be drawn.
Others have focused on hypothesised impediments to repository discoverability. For example, Tonkin et al. explored the significance of repository coversheets in disrupting the bot crawling potential of repositories in some cases [9], a practice also considered by Anurag Acharya of Google Scholar as undesirable [10]. Better supporting Google Scholar indexing was addressed by Arlitsch and O’Brien, who noted variable indexing coverage of repositories on GS and evaluated the effects of adjusting in-page metadata on GS indexing penetration. Arlitsch and O’Brien highlight the dangers of paying insufficient attention to discoverability and propose corrective actions for repository managers to perform.
Promoting repository discovery
Whilst many of the prominent repository platforms (e.g. EPrints, DSpace, Digital Commons, OJS, etc.) now provide basic out-of-the-box support for discovery and interoperability with key academic tools, including meeting Google Scholar inclusion guidelines, there remains wide variation on the relative visibility and discoverability of repository content. The question of repository discoverability is therefore something which has attracted significant attention at the University of Strathclyde as the institution seeks to ensure its internationally significant research [11], much of it available open access via Strathprints, can be found easily.
Strathprints is powered by EPrints (version 3.3.13). To improve repository web visibility and user engagement, thereby improving usage, a series of technical changes were made to Strathprints in spring 2016 and their impact monitored during 2016/2017, and again in 2017/2018. Process improvements were also implemented. The changes could be said to fall into one of two categories: improvements, and; adjustments. “Improvements” were changes that resulted in substantive modifications to repository functionality, while “adjustments” included actions that sought to refine existing aspects of the repository. As noted below, much of the motivation for these improvements and adjustments came from the broader literature on web publication best practice and SEO; although some were gleaned from the repository best practice literature [10].
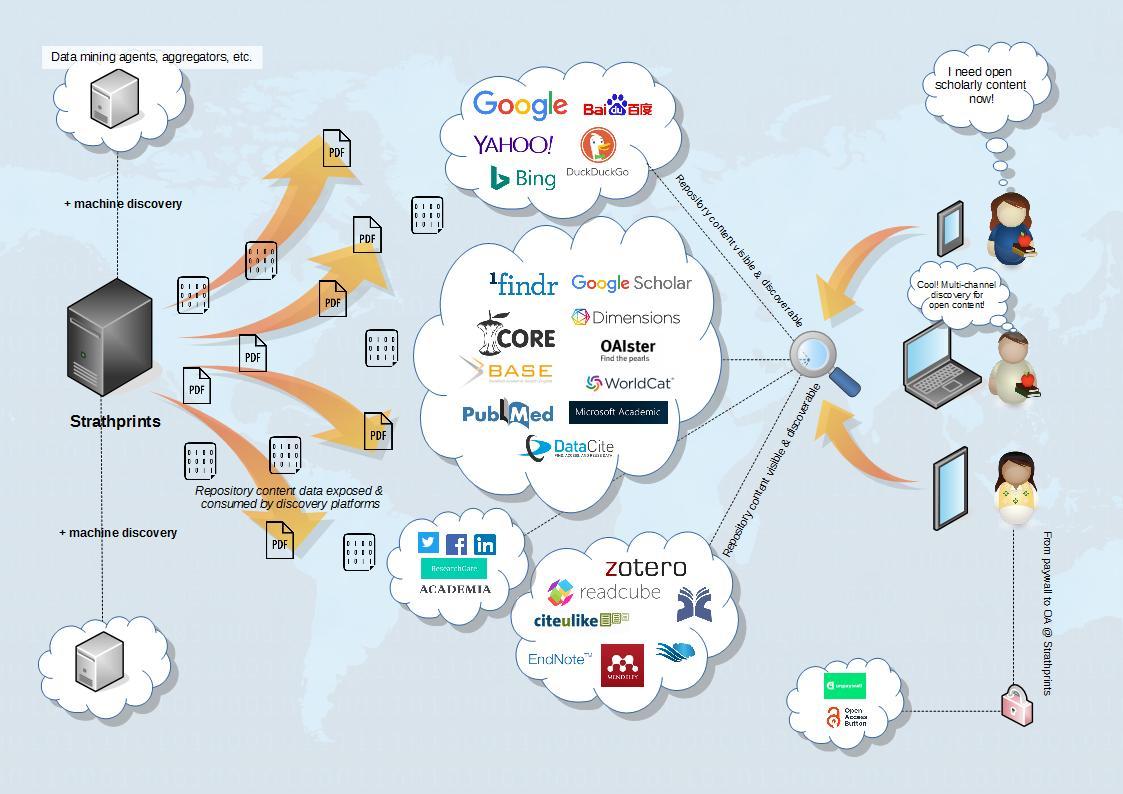
Figure 1. Discovery paths for content stored in the Strathprints repository.
Technical changes
Improvements
The principal improvements made included:
- Implementation of a refreshed Strathprints user interface (UI). Many repositories continue to demonstrate low levels of usability [12], [13]. Low levels of usability can result in the users’ abandonment of a website or of system sessions [14], [15], [16]. An heuristic evaluation [17] of Strathprints user interface (UI) was therefore undertaken in early 2016 to direct UI changes intended to improve usability and user engagement (Figure 2 & 3);
- Following heuristic evaluation, a “mobile first”, responsive re-engineering of Strathprints was implemented, thereby triggering important signals in PageRank [18] and, later, heavier weighting in the Google “Penguin” updates [19] (Figure 2 & 3);
- “White hat” improvements [20] to the way Strathprints functions. This included improvements to internal linking (e.g. navigation, hyperlink labels, etc.) and content improvements including promotion of user interaction through support for the Core Recommender and AltMetric. Both of these improvements stimulate additional user interaction. For example, in the case of the Core Recommender this is achieved by referring users to alternative but related additional Strathprints content, recommended to the user on the basis of the repository item they are currently browsing;
- Improved integration with social tools, including growth in social interactions which are the result of Tweets about recently deposited Strathprints content;
- Implementation of a “connector-lite” configuration actioned to cultivate Strathprints as a full-text destination for users and machines alike [21]. Within the currently scholarly communication landscape it is not uncommon for institutional repositories to now operate in parallel with the local Current Research Information System (CRIS). This so-called “connected” configuration enables metadata and digital content exchange from the CRIS to the repository. It is a configuration that applies to Strathprints, which is no longer a point of entry for staff wishing to deposit content in Strathprints; instead users deposit via the CRIS which then automatically writes metadata and content to Strathprints. “Connector-lite”, however, enables greater control over what is written to Strathprints by the institutional CRIS [21].
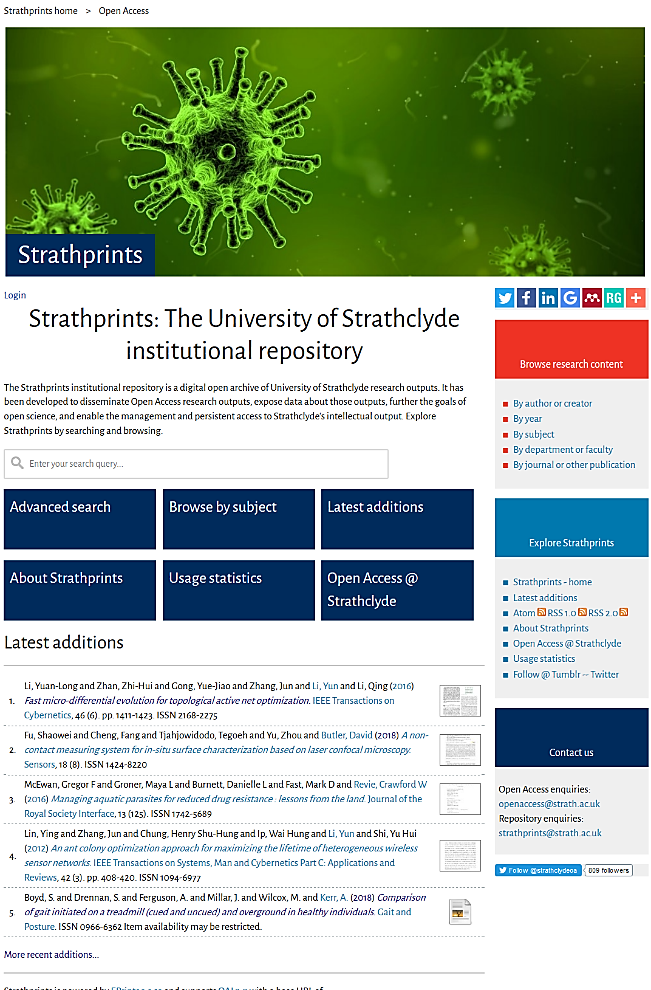
Figure 2. Strathprints UI (homepage). |

Figure 3. Strathprints UI (abstract pages). |
Adjustments
A series of adjustments were made to fine tune the search engine friendliness of Strathprints and to enhance user experience. A number of these related to delivering page speed improvements for Strathprints, in line with trends within search agents to factor speed in results rankings ([18], [19], [20], [22]).
-
Adjustments to the file-naming conventions used for deposited full-text files in order to render them more crawler friendly. Descriptive file-names can lead to better and more effective crawling of files. Moreover, words contained in file-names factor in retrieval algorithms and may be highlighted to users in results pages, so accurate naming is necessary to facilitate ‘known-item’ searching by users. A descriptive file naming convention with proactive use of hyphens to separate words in the filename [18] was therefore adopted. The broad approach to naming was as follows:
{Author surname(s)}{Journal/conference acronym}{Year of publication}{Selected uninterrupted words from title of article using hyphens for spacing}.pdf
So, for example, a file pertaining to the present article would be named:
Macgregor-C4L-2019-Improving-the-discoverability-and-web-impact-of-open-repositories-techniques-and-evaluation.pdf
- Gradual cleaning of broken links within Strathprints thereby improving the “content health” of Strathprints and, again, triggering important signals in PageRank [18]. Like many repositories of its type, Strathprints has been operating in one form or another for over 10 years and during that time has accumulated its fair share of “link rot”;
- “Minification” of all relevant repository files (e.g. CSS, JS, etc.) to deliver increased page loading speeds. Minification refers to the process of removing superfluous or redundant data without affecting how the resource is processed by browsers, e.g. code comments, formatting, white space characters, unused code, using shorter variable names, etc. This superfluous data may aid the human readability of the code but is not needed for the code to execute efficiently.
- Rationalisation of all CSS and Javascript (JS) files in order to remove unused rules and variables. This can be performed manually but there are automatic online tools (e.g. PurifyCSS, UnCSS! Online) which can analyse websites to determine which CSS rules are actually being applied to a given website, thus allowing redundant rules to be deleted. Similarly, there are code quality tools for JS (e.g. JSHint).
- Asynchronous loading of JS resources: Render-blocking JS is probably the single most difficult obstacle to overcome when attempting to deliver repository speed improvements (see [23] for further details). A repository like Strathprints, like most others, will require the loading of many JS resources in order to deliver important functionality. For Strathprints this includes native JS resources but also third-party JS such as the Google JSAPI, AltMetric API, analytics from Google Analytics and AddThis, as well as for any EPrints plugins that have been installed from the EPrints Bazaar. However, some simple experimentation can deduce whether it is necessary for JS to be loaded at the same time as the page itself since in many cases JS can actually be deferred until after page rendering [23]. HTML5 introduced the async attribute to be used with <script>. This Boolean attribute indicates that the browser should, if possible, execute the script asynchronously. For example:
<script type="text/javascript" async="async"
        src="https://www.google.com/jsapi"><!--padder--></script>
- GZIP compression: gzip is a file format and software application used for file compression and decompression. All modern browsers support and automatically negotiate gzip compression for all HTTP requests and, where used, gzip can compress the size of the transferred response by up to 90%. This significantly reduces the amount of time needed to download resources, reduces data usage for users, and improves the first render time repository pages. Enabling gzip, however, is an infrastructural task as it necessitates adjusting the repository server configuration so that it returns “gzipped” content to compliant browsers. gzip implementation is described in more details at [23].
- Revisiting image optimisation: The question of optimising images for delivery over the web will vary from repository to repository and, in fact, many repositories have very little visual content at all. Strathprints uses large banner images which, when not sufficiently compressed, were found to negatively influence page loading times [22]. All image resources were therefore compressed and optimised accordingly.
- Migration to InnoDB as the MySQL storage engine in order to improve repository performance: EPrints generally runs on MySQL, using MyISAM as the default storage engine, but table locking was found to be a DB performance issue thereby inhibiting the execution of simultaneous queries. InnoDB demonstrates concurrency, locking only the row(s) which are relevant to the DB query, leaving the rest of the table available for CRUD operations.
- Deployment of Google Data Highlighter: We noted earlier that exposing contents to Google could be improved through the implementation of Schema.org [7]. It was not possible in this instance to re-engineer EPrints in order to expose Schema.org interoperable data, although this may be something to be explored in future. Instead Google Data Highlighter – a pattern matching tool for structured data on websites – was deployed as a substitute [24].
Data and results
The impact of the repository changes were monitored and measured using a variety of metrics, including search traffic data from Google Search Console [25], COUNTER compliant usage data from IRUS-UK [1], Google Analytics [26] tracking data and routine statistical data from Strathprints itself. The periods examined were the year up to end July 2016 (Year 1 – Y1), prior to the changes being implemented; and the years up to end July 2017 (Year 2 – Y2), after improvements were deployed, and end July 2018 (Year 3 – Y3), after the adjustments were implemented.
Note that COUNTER usage data [1] refers to the international COUNTER ‘Code of Practice’, which sets standards on how electronic content usage is calculated thereby allowing content publishers to provide consistent, credible usage data. This data can then be used to accurately understand real world usage and provide usage comparisons across multiple services or websites.
Traffic
Web traffic, as measured by Google Analytics (GA), grew by 150,408 in Y2 to 428,407, equivalent to a 54% improvement when compared to Y1. A 52% improvement in unique traffic was also observed during the same period (Figure 4(a)). An increase in traffic in Y3 was less than Y2 (6%) but was still in excess of Y2 (n = 454,318), meaning that the total percentage growth in traffic during the entire reporting period was 63% and 65% for traffic and unique traffic respectively.
As might be expected, Google was found to be the largest referral source, accounting for 55% of all traffic in Y3; but thereafter Google Scholar was found to be the most significant referral source, accounting for 25% of all web traffic in Y3 and growing by 99% during the entire reporting period. Traffic in Y2 grew by 48% (n = 83,045) and 34% (n = 111,563) in Y3. 77% of all this traffic in both Y2 and Y3 was unique. This is at variance with previously reported results emerging from a preliminary evaluation [3], in which GS traffic was found to have declined slightly as a proportion of total web traffic (by 3%). In fact, this present evaluation, using a more comprehensive dataset, found the percentage of total traffic to Strathprints from GS to have increased by 5%, with almost all of these gains achieved during Y3. Thus, the percentage traffic gains achieved from GS during the reporting period (99%) grew even quicker than the broader gains achieved from other web traffic sources (63%). This can be observed data charted in Figure 4(b). Repositories serving more content enjoy deeper indexing by Google Scholar (GS) [10] and, combined with the other improvements and adjustments, may be a possible explanation for the GS improvements.
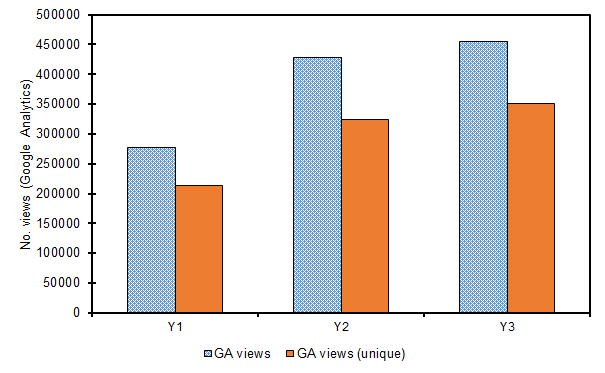
Figure 4(a). Volume of referral traffic (views and unique views) as calculated by Google Analytics (GA) in Y1, Y2 & Y3.
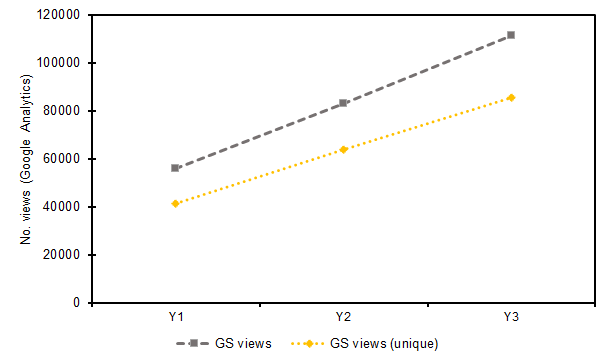
Figure 4(b). Volume of referral traffic from Google Scholar (GS) for views and unique view, as calculated by Google Analytics (GA) in Y1, Y2 & Y3.
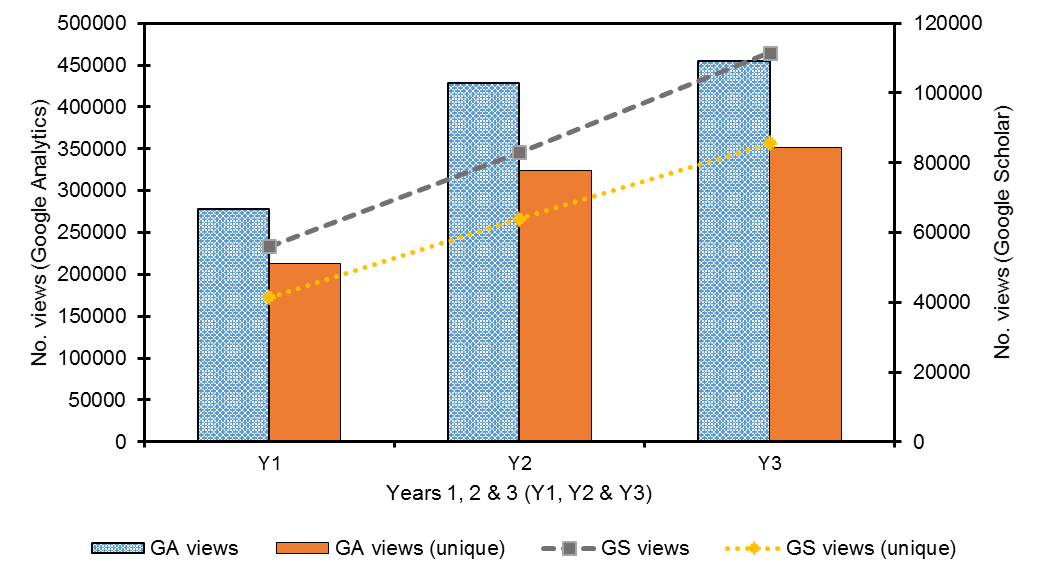
Figure 4(c). Volume of Google & Google Scholar referral traffic (views) in Y1, Y2 & Y3.
The principal referral sources remained largely unchanged during the reporting period, with both Google and GS referring the majority of the traffic. However, the proportion of the overall traffic referred to Strathprints by Google and GS grew by 18% between Y2 and Y3 such that 80% of all repository traffic was referred by either Google or GS. The remaining 20% comprised a long tail of services. The nature of this traffic growth can perhaps be better observed in Figure 4(c) when the data for Figure (a) and (b) are overlaid, with GS demonstrating steeper growth relative to other traffic.
Table 1 summarises the top ten referral sources (with local sources excluded). A 29% decrease in Bing referrals between Y2 and Y3 is noted, as is a larger decrease for Yahoo! (which shares the Bing index). Reasons for this are suggested later in this paper but essentially relate to search interference arising from the institutional CRIS. However, given the overall small contribution to traffic made by Bing and Yahoo! – and the far larger increases in referral traffic from other sources (including within the long tail) – this decrease is more than cancelled out. An interesting observation relates to the increase in referrals from social sources, such as Twitter and Facebook. Again, this traffic remains small in relation to the volume of total traffic but extraordinary percentage increases can nevertheless be observed. For example, traffic from Twitter increased by 3700% between Y1 and Y3 as improved social media interaction opportunities were implemented.
| Referral source | Y1 | Y2 | Y3 |
| 152890 | 185491 | 251705 | |
| Google Scholar | 57319 | 83045 | 111563 |
| Bing | 10794 | 10411 | 7405 |
| 173 | 1414 | 6556 | |
| Android Google Search | 0 | 0 | 2274 |
| Baidu | 3234 | 2657 | 2209 |
| Glgoo | 878 | 1048 | 2077 |
| Yahoo | 3628 | 1351 | 1436 |
| 533 | 634 | 1108 | |
| Ebsco (EDS) | 482 | 433 | 485 |
Table 1. Summarised web traffic referral sources as measured by GA with local sources excluded.
Discovery
A more appropriate measure of repository discoverability lies in search metrics. Google Search Console was used to gather search data during the reporting period, thereby allowing the effect of the repository changes to be examined on Google search queries. Search Console makes the distinction between data pertaining to “impressions” and “clicks”. Impressions are defined as occurring when “A link URL record […] appears in a search result for a user”, while a click is “any click that sends the user to a page outside of Google Search” [25].
Improvements in impressions and clicks were observed in Y2 at 52% (n = 5,795,781) and 23% (n = 169,720) respectively when compared to the Y1 period. This upwards trend continued in Y3 at 61% (n = 9,357,582) and 25% (n = 212,148), and a general upwards trend in impressions and clicks can be observed in the graph profile of Figure 5, with impressions and clicks demonstrating particular growth from early 2017 onwards. The total percentage growth in impressions and clicks during the entire reporting period was 146% and 53% respectively. Figure 6 provides a summary of the increase in clicks, impressions and COUNTER usage, with steeper increases in impressions and clicks noted between Y2 and Y3.
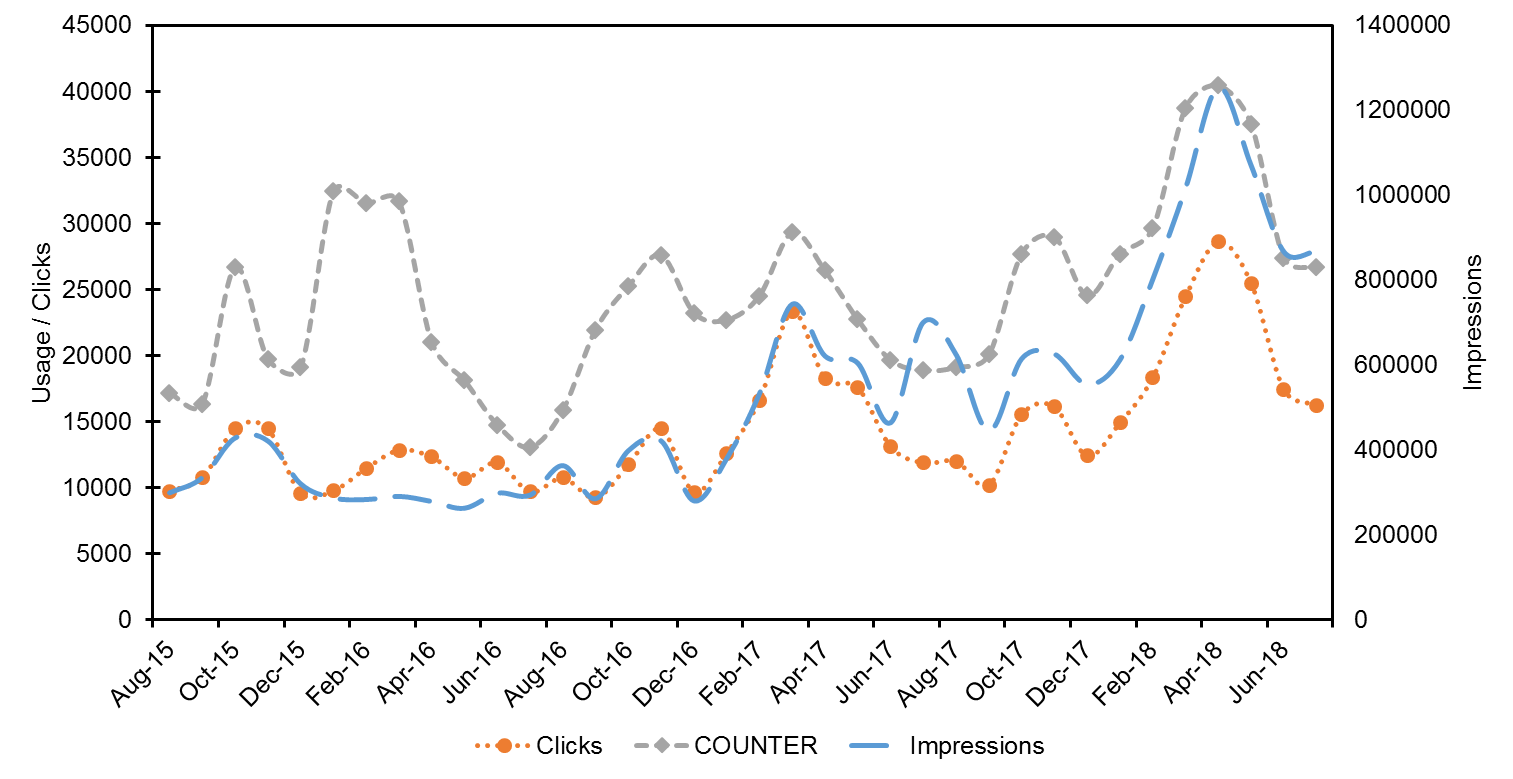
Figure 5. Strathprints COUNTER usage during Y1, 2 & 3 and Google clicks & impressions during the same period.
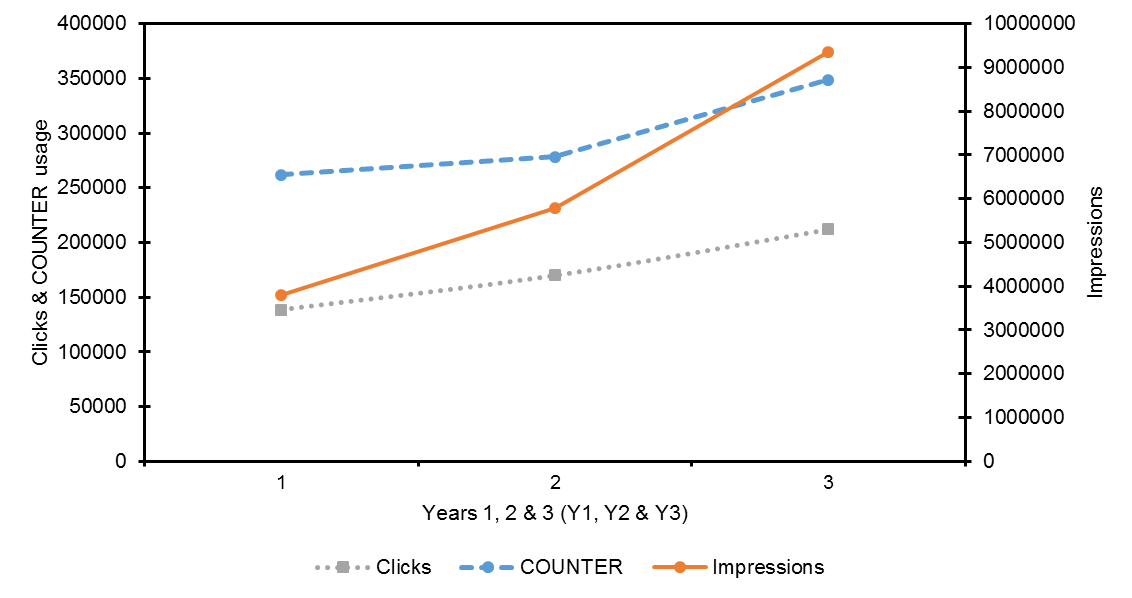
Figure 6. Charted data on observed clicks, impressions & COUNTER usage during reporting period.
During the full period examined (i.e. Y1-Y3), Strathprints demonstrated a 33% growth in COUNTER compliant usage. This growth in usage was observed despite only a 19% growth in full-text deposits during the same period. The pattern of this usage appears more nuanced when considered on an annual basis. For example, Y2 and Y3 observed a 6% and 25% increase respectively in COUNTER usage, with the number of deposits in Y3 actually declining by 19% while increasing by a similar proportion in Y2. Usage therefore generally increased greater than the number of deposits but in the first year this was not observed, possibly owing to the latency of search tool indexes during Y1. It is also noteworthy recalling that Google search referrals and GS traffic demonstrated growth well in excess of the 19% full-text deposit rate, as per Figure 4. In other words, the percentage of users being referred increased at a greater rate than the percentage growth rate of full-text.
To determine whether a correlation between clicks and COUNTER usage was present, Pearson’s correlation coefficient was calculated for each year in the reporting period. Pearson’s correlation coefficient provides a measure of the linear correlation between two variables by using a value between -1 and 1 to denote the strength of correlation. It can be reported that a correlation was detected, ranging from a weak relationship in Y1 (r = 0.26) to a moderate positive correlation in Y2 (r = 0.65). For those readers familiar with statistics, this correlation was confirmed via the t statistic (t = 2.68, df = 11, p < 0.05). A strengthening of the positive correlation was further observed in Y3 (r = 0.97), also confirmed by the t statistic and a higher level of statistical significance (t = 12.72, df = 11, p < 0.001).
Computing the coefficient of determination (r2) allows us to better understand the proportion of the variance in the dependent variable (i.e. COUNTER usage) which is predictable from the independent variable (i.e. Google clicks). Computing the coefficient of determination revealed data to be more nuanced (Figures 7, 8 & 9). r2 was stronger in Y2 (r2 = 0.419) than Y1 (r2 = 0.069); clearly a significantly higher value but indicating that only circa 42% of the unique variance in COUNTER usage could be directly attributed to Google clicks. However, this variance narrowed considerably for Y3 (r2 = 0.934) with a strong linear relationship between variables noted such that 94% of the unique variance in COUNTER usage could be directly attributed to Google clicks. This narrowing in variation can also be observed from Figure 5, with data points grouping more closely to the regression line.
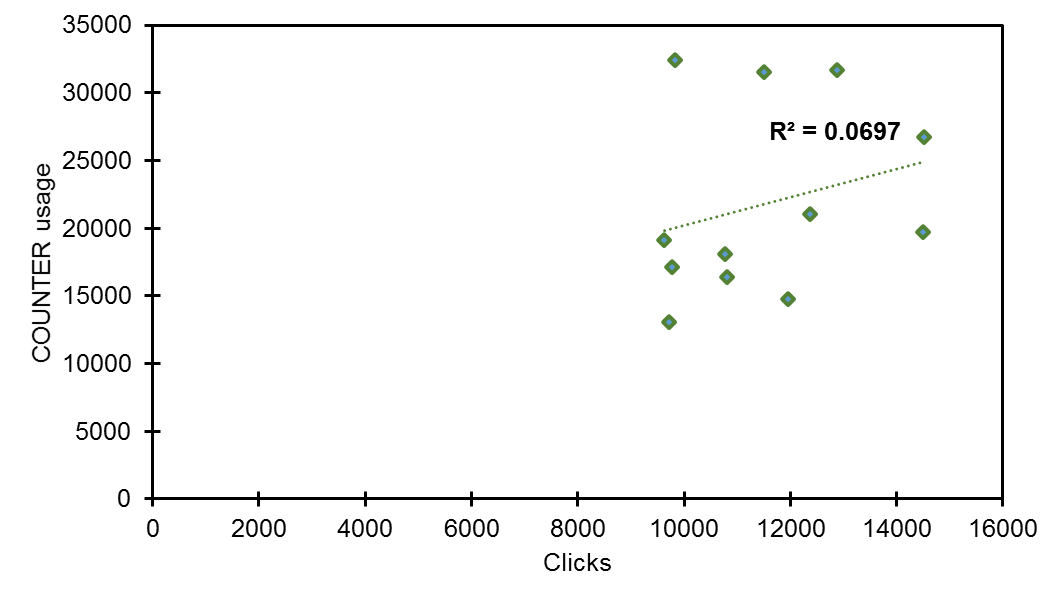
Figure 7. Coefficient of determination (r squared) for Y1 (clicks and COUNTER usage).
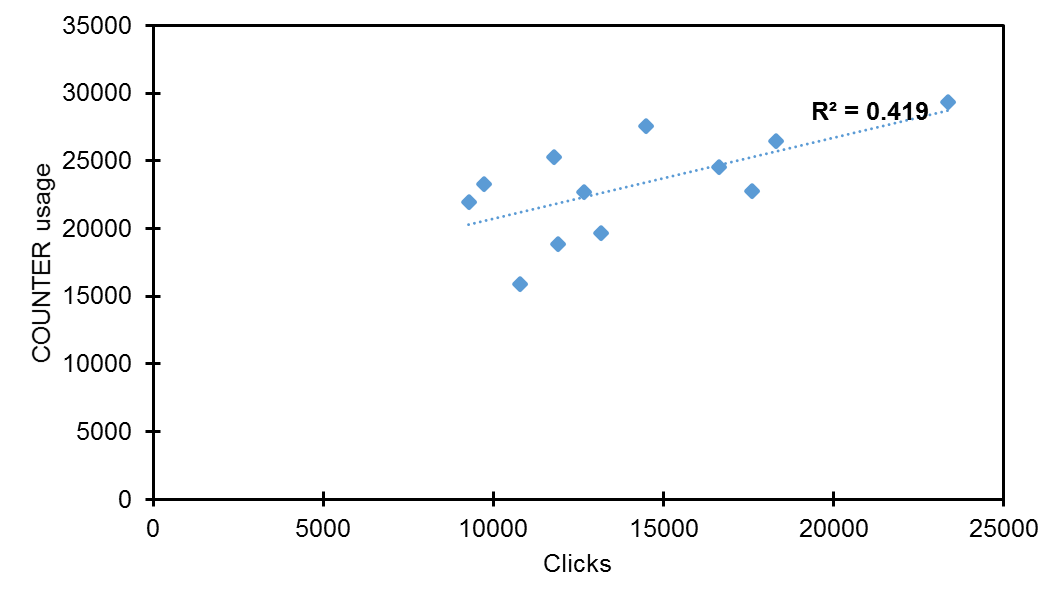
Figure 8. Coefficient of determination (r squared) for Y2 (clicks and COUNTER usage).
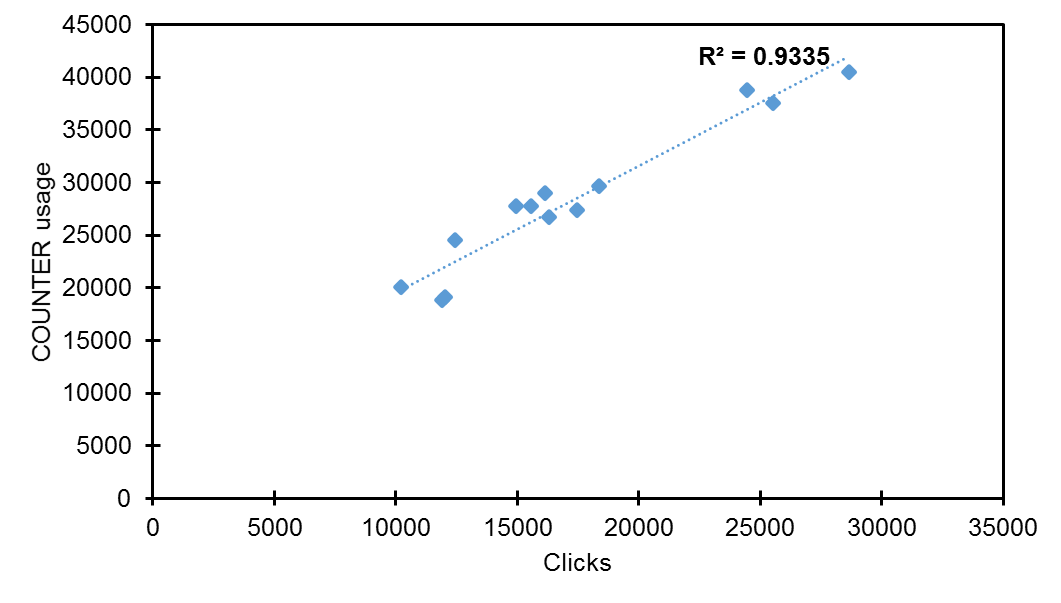
Figure 9. Coefficient of determination (r squared) for Y3 (clicks and COUNTER usage).
By exposing their content to disparate search services, and the nature of repository content itself, repositories encourage – and are conducive to – “horizontal” information seeking strategies [19]. These types of information seeking strategy typically correspond with the relatively high “bounce rates” that repositories experience. Bounce rates are calculated by GA as “a session that triggers only a single request to the Analytics server, such as when a user opens a single page on your site and then exits without triggering any other requests […] during that session” [26]. The bounce rate in this study remained relatively unchanged, fluctuating across reporting periods at circa 75%. However, the average time users spent on Strathprints upon arrival increased, up from 01:13 in Y1 to 01:54 in Y2 and then 01:59 in Y3. Although users were continuing to bounce, they were typically spending longer on Strathprints, indicative perhaps that improvements to the UI and Strathprints functionality was enough to persuade users to defer their bounce. In other words, it was possible to improve users’ “dwell time” on Strathprints by 61% between Y1 and Y3.
Dwell time therefore suggests itself as a more accurate indicator of repository engagement than bounce rates, which experienced only marginal change during the reporting period. Bounce rates are not necessarily a reliable metric within models of information seeking behaviour. For example, a user might spend 25 mins reading content on a repository, taking notes and chaining references, but then they might leave. In this example the user “bounced” because they failed to navigate to another page on the repository. But, in repository terms, the user spent 25 mins consuming repository content and found that content sufficiently useful that they “dwelled” for 25 mins. Dwell time is therefore critical to understanding repository engagement. Interestingly, it is for this reason that many search services, Google and Bing included, factor “dwell time” into their relevance rankings [27], [28]. Like PageRank more generally, the way in which search tools calculate dwell time, or the weighting it is assigned in computing algorithms such as PageRank, is unknown; but it is clearly a variable in calculating relevance and is therefore a metric institutions and repository managers should monitor. Similarly, the significance of dwell time in this evaluation is impossible to calculate. It is only possible to state that it would have positively influenced the visibility of Strathprints in the search results of services such as Google and Bing.
Conclusion and future work
In this contribution we experimented with a suite of repository adjustments and improvements performed on an EPrints powered repository. These adjustments were designed to support improved repository web visibility and user engagement thereby improving usage and should be considered within the wider context of the COAR Next Generation Repositories agenda. The evaluation provides persuasive evidence that specific enhancements to technical aspects of a repository can result in significant improvements to repository visibility, resulting in a greater web impact and consequent increases in content usage. The results suggest that both web and search traffic and COUNTER usage can be significantly improved on the most important search and discovery tools, with strong correlations between Google search visibility and repository COUNTER usage demonstrated and variation narrowing particularly in Y3. 94% of the unique variance in COUNTER usage was found to be directly attributed to Google clicks. Strathprints also demonstrated a 33% increase in COUNTER compliant usage during the years examined. Across the entire reporting period total traffic to Strathprints grew by 63%, with Google impressions and clicks increasing by 146% and 53% respectively. GS traffic was also found to have generated a traffic growth 99%, accounting for 25% of all web traffic to Strathprints in Y3. User dwell time was also found to have increased, suggesting longer interaction sessions by users.
Of course, as with any experiments attempting to effect change on third party systems, it is impossible to control for all variables hypothesised to influence web visibility. It is not claimed that every known variable has been addressed in this instance. The approach adopted here of delivering repository adjustments and improvements was a holistic one, and was intended to address as many as possible. The approach could therefore be described as pursuing the accumulation of marginal gains; identifying numerous minor optimisations that can be implemented which, when taken in aggregate, effect further significant improvements. There are also limitations to be noted on the use of search data from Google Search Console which, for obvious reasons, provides data on Google searches only. However, as the majority of referral traffic to Strathprints comes via Google this seemed an acceptable compromise to be made in this instance. Future similar studies should nevertheless explore additional sources of search data to improve the accuracy of conclusions drawn, especially as Google cannot be relied upon to be the preeminent web search engine indefinitely. We intend to continue monitoring our data into Y4 with the hope of exploring how additional adjustments could improve visibility on other search discovery tools, thereby providing the basis for greater longitudinal analysis.
Although the experiments were performed on EPrints it is thought that most of the adopted improvements are equally applicable to most repository platforms. There is, in fact, potential for others to improve the impact of the approach. For example, it was noted in the literature that coversheets are considered to be disruptive to the bot crawling potential of repositories and it has been suggested that repositories disable such repository functionality [29]. Based on local experimentation and the need to ensure accurate attribution of repository outputs, coversheets remained enabled in Strathprints and continue to remain enabled. This therefore highlights a possible limitation. However, there are also potential additional improvements to be gained by other repositories willing to develop their own alternative approaches (e.g. watermarking attribution details) or disabling coversheets altogether. Furthermore, owing to the existence of Strathprints within a connected CRIS configuration, the present author noted issues of the CRIS front-end interfering with the visibility of Strathprints in some cases. Again, this interference was almost impossible to quantify and appeared to particularly affect Bing and Yahoo! Searches; but for those repositories operating outside of a CRIS environment or functioning as the de facto CRIS front-end, considerable additional opportunities are available vis-à-vis promoting the discoverability and web impact of repository content.
References
[1] IRUS-UK [Internet]. 2018 [cited 2018 Jun 30]. Available from: http://www.irus.mimas.ac.uk/
[2] Kelly B, Nixon W. SEO analysis of institutional repositories: What’s the back story? In: Open Repositories 2013 [Internet]. University of Bath; 2013 [cited 2017 Jul 19]. Available from: http://opus.bath.ac.uk/35871/
[3] Macgregor G. The long read: Why do institutional repositories remain one of the only viable options for Green Open Access? [Internet]. Open Access @ Strathclyde. 2016 [cited 2017 Jun 29]. Available from: https://perma.cc/G52J-2FSG
[4] Macgregor G. Reviewing repository discoverability?: approaches to improving repository visibility and web impact. In: Repository Fringe 2017 [Internet]. John McIntyre Conference Centre, University of Edinburgh; 2017 [cited 2018 Aug 3]. Available from: https://strathprints.strath.ac.uk/61333/
[5] Macgregor G. Reviewing repository discoverability with Strathprints [Internet]. Open Access @ Strathclyde. 2017 [cited 2018 Aug 29]. Available from: https://perma.cc/A3R9-W2JV
[6] Tmava AM, Alemneh DG. Enhancing Content Visibility in Institutional Repositories: Overview of Factors that Affect Digital Resources Discoverability [Poster] [Internet]. iConference, 2013, Fort Worth, Texas, United States. 2013 [cited 2018 Aug 13]. Available from: https://digital.library.unt.edu/ark:/67531/metadc146593/
[7] Pekala S. Microdata in the IR: A Low-Barrier Approach to Enhancing Discovery of Institutional Repository Materials in Google. Code4Lib Journal [Internet]. 2018 Feb 5 [cited 2018 Aug 13];(39). Available from: https://journal.code4lib.org/articles/13191
[8] COAR. Next Generation Repositories: Behaviours and Technical Recommendations of the COAR Next Generation Repositories Working Group [Internet]. Göttingen: COAR; 2017 Nov. Available from: https://www.coar-repositories.org/files/NGR-Final-Formatted-Report-cc.pdf
[9] Tonkin EL, Taylor S, Tourte GJL. Cover sheets considered harmful. Information Services & Use [Internet]. 2013 Jan 1 [cited 2018 Aug 29];33(2):129–37. Available from: https://doi.org/10.3233/ISU-130705
[10] Acharya A. Indexing repositories: pitfalls and best practices [Internet]. Proceedings of Open Repositories 2015. 2015. Available from: http://purl.dlib.indiana.edu/iudl/media/6537033b6s
[11] Shirlaw D. University of Strathclyde research rankings rocket [Internet]. Glasgow City of Science and Innovation – News. 2014 [cited 2018 Aug 14]. Available from: https://perma.cc/9CNK-8Z53
[12] Zhang T, Maron D, Charles C. Usability evaluation of a research repository and collaboration website. Journal of Web Librarianship [Internet]. 2013 Jan 1; Available from: http://docs.lib.purdue.edu/lib_fsdocs/51
[13] McKay D, Burriss S. Improving the Usability of Novel Web Software: An Industrial Case Study of an Institutional Repository. In: Web Information Systems Engineering – WISE 2008 Workshops [Internet]. Springer, Berlin, Heidelberg; 2008 [cited 2017 Jul 18]. p. 102–11. (Lecture Notes in Computer Science). Available from: https://link.springer.com/chapter/10.1007/978-3-540-85200-1_12
[14] Wang J, Senecal S. Measuring Perceived Website Usability. Journal of Internet Commerce [Internet]. 2007 Aug 8;6(4):97–112. Available from: https://doi.org/10.1080/15332860802086318
[15] Pendell KD, Bowman MS. Usability Study of a Library’s Mobile Website: An Example from Portland State University. Information Technology and Libraries [Internet]. 2012 Jun 12 [cited 2018 Aug 3];31(2):45–62. Available from: https://ejournals.bc.edu/ojs/index.php/ital/article/view/1913
[16] Everard A, McCoy S. Effect of Presentation Flaw Attribution on Website Quality, Trust, and Abandonment. Australasian Journal of Information Systems [Internet]. 2010 Mar 1 [cited 2018 Aug 3];16(2). Available from: http://journal.acs.org.au/index.php/ajis/article/view/516
[17] Nielsen J, Molich R. Heuristic Evaluation of User Interfaces. In: Proceedings of the SIGCHI Conference on Human Factors in Computing Systems [Internet]. New York, NY, USA: ACM; 1990. p. 249–256. (CHI ’90). Available from: http://doi.acm.org/10.1145/97243.97281
[18] Google. Search Engine Optimization (SEO) Starter Guide [Internet]. 2018 [cited 2018 Aug 3]. Available from: https://perma.cc/8CT3-UAV5
[19] Kloboves K. Continuing to make the web more mobile friendly [Internet]. Official Google Webmaster Central Blog. 2016 [cited 2018 Jul 19]. Available from: https://webmasters.googleblog.com/2016/03/continuing-to-make-web-more-mobile.html
[20] Moreno L, Martínez P. Overlapping factors in search engine optimization and web accessibility. 2013 Jun [cited 2018 Aug 3]; Available from: https://e-archivo.uc3m.es/handle/10016/20175
[21] Macgregor G. Feeding the beast: workloads in a hybrid IR / CRIS environment [Internet]. Open Access @ Strathclyde. 2017 [cited 2017 Jul 19]. Available from: https://perma.cc/DL7U-9VCE
[22] Wang Z, Phan D. Using page speed in mobile search ranking [Internet]. Official Google Webmaster Central Blog. 2018 [cited 2018 Aug 3]. Available from: https://perma.cc/8QKP-NE5S
[23] Macgregor G. Demonstrating the need for speed: improving page loading and rendering in repositories [Internet]. Open Access @ Strathclyde. 2017 [cited 2018 Aug 3]. Available from: https://perma.cc/DCM7-TS7B
[24] Google. About Data Highlighter [Internet]. 2018 [cited 2018 Aug 24]. Available from: https://perma.cc/92DY-MFZP
[25] Google. Google Search Console [Internet]. 2018 [cited 2018 Aug 10]. Available from: https://www.google.com/webmasters/tools/home
[26] Google. Google Analytics [Internet]. 2018 [cited 2018 Aug 13]. Available from: https://marketingplatform.google.com/about/analytics/
[27] Microsoft. How To Build Quality Content [Internet]. 2011 [cited 2018 Aug 24]. Available from: https://perma.cc/X2U7-QMPJ
[28] Shewan D. Dwell Time: The Most Important Metric You’re Not Measuring [Internet]. 2017 [cited 2018 Aug 24]. Available from: https://perma.cc/5H5E-BTE2
[29] Tonkin E, Taylor S, Tourte G, web-support@bath.ac.uk. Cover sheets considered harmful. In: 17th International Conference on Electronic Publishing [Internet]. Blekinge: University of Bath; 2013 [cited 2015 Sep 18]. Available from: http://www.bth.se/com/elpub2013.nsf/
Data statement
Data underpinning this work are available under a CC-BY license at: https://doi.org/10.5281/zenodo.1411207
About the author
George Macgregor (g3om4c@gmail.com) is the Institutional Repository Manager at the University of Strathclyde in Glasgow, Scotland (UK). George’s interests are in structured open data (esp. within Semantic Web and repository contexts), information retrieval, distributed digital repositories and human-computer interaction (HCI).

Subscribe to comments: For this article | For all articles
Leave a Reply