by Mark Phillips and Hannah Tarver
Introduction
The University of North Texas Libraries’ Digital Projects Unit (DPU) worked on two projects for The Portal to Texas History [1] that make use of publicly-available application programming interfaces (APIs) to enrich and extend metadata records so that more users are able to find the resources which the records describe. The two collections that the DPU used for this work contain two series of maps, both issued by federal agencies.
USGS Topographic Maps
The first set of maps processed with the workflow described in this article was the Texas 7.5 Minute Topographic Map collection, containing over 8,000 maps acquired by the UNT Libraries as a “born-digital” collection [2]. The United States Geological Survey (USGS) [3] created these maps through its ongoing project to chart the geographic detail of the United States at a uniform size and scale (1:24,000) [4]. The collection includes an older set of maps scanned as digital raster graphic maps, and a second set of maps, for the same quadrangles, that were digitally-generated from geospatial data [5]. The United States Geological Survey makes these maps freely available in a number of ways via its various websites including the USGS Store [6], the National Atlas [7], and a historical topographic map site.
U.S. Census Reference Maps
The second set of maps processed with the workflow was a collection of maps produced by the United States Census Bureau [8]. The maps in this case denoted the boundaries used for the collection and aggregation of census statistics and are part of the Census Bureau’s “Reference Map Series” which the Bureau makes available via its website for download [9].
The United States Census Bureau produces several kinds of reference maps that denote census blocks, census tracts, and other areas for which it compiles data. The maps include some roadways, railways, geography, hydrography, and other features to aid in identifying a particular location. Users can consult the reference maps to determine which geographic areas correspond to census data and statistics. The maps are generated every ten years, corresponding with census data collection. The collection in the Portal [10] contains the county block maps from 1990, 2000, and 2010, as well as the block maps generated under public law P.L.94-171 for 2010 that include legislative and voting districts.
This paper discusses the workflow for acquiring, parsing, and preparing the map data for use in publicly-available APIs and then discusses the APIs used to enrich the map metadata before uploading the records and digital objects into The Portal to Texas History.
Getting the Maps
USGS 7.5 Minute Topographic Maps
Currently, the easiest way to access topographic mapping data in bulk for the kind of work described in this article is from the USGS website, “The National Map: Historical Topographic Map Collection [11].” The site allows users to specify a state and specific scale of maps to return a listing of search results that matches their query. This list of search results can be downloaded as a comma separated value (CSV) file, which is the preferred format for this workflow.
Once the map metadata is downloaded, it can be opened with standard spreadsheet software such as OpenOffice or Microsoft Excel. Each map is listed in a separate row and the column with the heading of “Download GeoPDF” contains the download URL for each map. This column can be copied into a text file with one URL per line; the Wget [12] command will download each map using the URLs in the text file, designated by the
--i
argument (see Example 1).
Example 1. Wget command to retrieve topographic maps.
wget --i topos_urls.txt
U.S. Census Bureau Reference Maps
The U.S. Census Bureau Reference Maps can be downloaded from the Bureau’s Reference Maps portal [9], which provides access to a number of map series. For each of the Census Block Maps the number of maps can be narrowed by decade, then state, with options to limit to county, subdivision, or city. After the final selection, the portal displays the relevant maps in a directory structure which contains a number of PDF map files.
For example, maps of Armstrong County in Texas for the 2010 Census are available at the following URL:
http://www2.census.gov/geo/maps/dc10map/GUBlock/st48_tx/county/c48011_armstrong/
Wget can download all of the files in the Armstrong County folder by referencing the URL (see Example 2).
Example 2. Wget command to retrieve Census Reference Maps.
wget -r -np -nc --accept *.pdf http://www2.census.gov/geo/maps/dc10map/GUBlock/st48_tx/county/c48011_armstrong/
The command in Example 2 executes the Wget program with the following arguments:
-r - Recursively download links found at the designated URL.

-np - No Parent, do not move higher in the directory structure.

-nc - No Clobber, if the file has already been downloaded, do not download
again, even if the process is restarted.

--accept - Only allow content matching the following pattern, in this case only
.pdf documents.
There are a number of options for Wget that can be tuned to your specific needs. The above example will get you started with downloading the Census Reference Maps you are interested in.
Two Application Programming Interfaces
What is an API?
An application programming interface, or API, is a way of programmatically interacting with a component or service within a programming language, within a framework for building applications, or as a way of connecting to and programming against various services offered by builders of applications. Builders of Web applications often offer APIs to their applications and frameworks that allow third-party developers to create new applications and tools. This article uses the term API and Web service interchangeably as is often the case when discussing APIs and the Web.
The workflow used for these two collections makes use of two kinds of APIs. The first extracts all of the place names that are found within the boundaries created by the four sides of an individual map; the second returns the county name for a given geographic latitude and longitude. These two lookups are used together to generate the place names and county names relevant for a given map and add the values to the map’s metadata record. The addition of these values will improve discoverability and access to the maps by allowing users to search for place names in the records or find other items about the same place(s).
Place Name API
The extraction API, citiesJSON, is made available by GeoNames [13]. GeoNames is an organization that provides access to high-quality name and coordinate data which it aggregates from a number of organizations from around the world. GeoNames provides a large number of freely-available APIs for developers to utilize in building systems which rely on geographic name and location data. In addition to the freely-available tools and data, a commercial support option allows for a higher rate of API usage and access to premium data. However, this workflow made use of the freely-available APIs. GeoNames makes the underlying data, which their APIs are built upon, available as bulk downloads so that developers can implement similar systems locally.
GeoNames requires that a user register with the system to receive a free API key (the registered username) and then regulates API requests by the use of tokens. A user can make up to 30,000 daily API “credits,” but different API calls use different numbers of credits; thus the number of requests that a user or program can make in a day will depend on the kind of information requested. This workflow employs the citiesJSON API that uses four credits per request, so the maximum number of requests that our application could make in one day from one username is 7,500. In addition, GeoNames limits API requests to 2,000 credits per hour; for the citiesJSON API, we had to ensure that we made only 500 requests per hour to stay under the limit defined by the service. Web services typically put these limits in place to reduce abuse of a system; it is important to understand the limits and penalties associated with exceeding them before using APIs. In many cases, the Web service will return an exception until sufficient time has elapsed. However, if consistent abuse is detected by the system it may permanently throttle or ban the user or IP address.
The citiesJSON API takes as input the following pieces of information: the north, south, east, and west coordinates of the bounding box, the preferred language in which to return the place names, the maximum number of names to return within a bounding box, and an optional callback function name. Finally the API requires a username as the user’s API key. A complete request will look like this:
Example 3. GeoNames citiesJSON request URL.
http://api.geonames.org/citiesJSON?north=32.028676&south=31.905515&east=-95.371331&west=-95.516337&lang=en&maxRows=100&username=demo
Example 4. GeoNames citiesJSON API response.
{
    "geonames": [
        {
            "countrycode": "US",
            "fcl": "P",
            "fclName": "city, village,...",
            "fcode": "PPL",
            "fcodeName": "populated place",
            "geonameId": 4722123,
            "lat": 32.0232193,
            "lng": -95.3921752,
            "name": "Reese",
            "population": 0,
            "toponymName": "Reese",
            "wikipedia": "en.wikipedia.org/wiki/Reese%2C_Texas"
        },
        {
            "countrycode": "US",
            "fcl": "P",
            "fclName": "city, village,...",
            "fcode": "PPL",
            "fcodeName": "populated place",
            "geonameId": 4700164,
            "lat": 31.9190566,
            "lng": -95.3735624,
            "name": "Ironton",
            "population": 0,
            "toponymName": "Ironton",
            "wikipedia": ""
        },
        {
            "countrycode": "US",
            "fcl": "P",
            "fclName": "city, village,...",
            "fcode": "PPL",
            "fcodeName": "populated place",
            "geonameId": 8479911,
            "lat": 31.979577,
            "lng": -95.398622,
            "name": "Corine",
            "population": 0,
            "toponymName": "Corine",
            "wikipedia": ""
        },
        {
            "countrycode": "US",
            "fcl": "P",
            "fclName": "city, village,...",
            "fcode": "PPL",
            "fcodeName": "populated place",
            "geonameId": 4737012,
            "lat": 31.9190559,
            "lng": -95.4777322,
            "name": "Todd City",
            "population": 0,
            "toponymName": "Todd City",
            "wikipedia": ""
        }
    ]
}
The result from the API call is a list of place names that fall within the designated bounding box. GeoNames has many kinds of registered names; each of them has a unique identifier, called a geonameId.
Table 1. Example values returned by the citiesJSON API for a place name.
| Field | Example Value |
| fcodeName | populated place |
| toponymName | Reese |
| countrycode | US |
| fcl | p |
| fclName | city, village,… |
| name | Reese |
| wikipedia | en.wikipedia.org/wiki/Reese%2C_Texas |
| lng | -95.3921752 |
| fcode | PPL |
| geonameId | 4722123 |
| lat | 32.0232193 |
| population | 0 |
We limited the number of place names to 100 for each map, in order to get a reasonable number of place names, especially for maps covering a large area. It turned out that for all of the bounding boxes in this project where place names were requested, the request with the most results contained 94 names [14]. Because of the nature of these maps and the geography of the state of Texas, which was the primary area covered, there were many maps that had no relevant place names.
One thing to note about the citiesJSON API is that it will only return a result for a city or place name if the latitude and longitude in the GeoNames database is contained within the bounding box. This can be problematic for large cities or cities that cover an oddly-shaped area when a map shows a portion or edge of a city, but the recorded latitude and longitude for that city are not within the bounding box for the particular map. Even with this limitation, the GeoNames citiesJSON API makes it possible to insert a large number of place names into the metadata records that would not be included otherwise.
This workflow takes a given geonameId and converts it into the string value that the UNT Libraries use to designate a place in their metadata system, listing place names hierarchically from the largest (country) entity to the smallest relevant entity. In this case a city such as Denton, Texas, which has a geonameId of 4685907, is represented as the string “United States – Texas – Denton County – Denton” and follows the pattern of <Country> – <State/Province> – <County/Parish> – <City/Named Place> used for locations in North America. The GeoNames Hierarchy Web service [15] allows for the conversion from a geonameId to the hierarchical string representing each place name. An example of
the response for the hierarchyJSON API for this service can be seen at
the following URL:
Example 5. GeoNames hierarchyJSON request URL.
http://api.geonames.org/hierarchyJSON?geonameId=4685907&username=demo
Example 6. GeoNames hierarchyJSON API response.
{
    "geonames": [
        {
            "adminName1": "",
            "countryName": "",
            "fcl": "L",
            "fclName": "parks,area, ...",
            "fcode": "AREA",
            "fcodeName": "area",
            "geonameId": 6295630,
            "lat": "0",
            "lng": "0",
            "name": "Earth",
            "population": 6814400000,
            "toponymName": "Earth"
        },
        {
            "adminName1": "",
            "countryName": "",
            "fcl": "L",
            "fclName": "parks,area, ...",
            "fcode": "CONT",
            "fcodeName": "continent",
            "geonameId": 6255149,
            "lat": "46.07323",
            "lng": "-100.54688",
            "name": "North America",
            "population": 0,
            "toponymName": "North America"
        },
        {
            "adminCode1": "00",
            "adminName1": "",
            "countryCode": "US",
            "countryId": "6252001",
            "countryName": "United States",
            "fcl": "A",
            "fclName": "country, state, region,...",
            "fcode": "PCLI",
            "fcodeName": "independent political entity",
            "geonameId": 6252001,
            "lat": "39.76",
            "lng": "-98.5",
            "name": "United States",
            "population": 310232863,
            "toponymName": "United States"
        },
        {
            "adminCode1": "TX",
            "adminName1": "Texas",
            "countryCode": "US",
            "countryId": "6252001",
            "countryName": "United States",
            "fcl": "A",
            "fclName": "country, state, region,...",
            "fcode": "ADM1",
            "fcodeName": "first-order administrative division",
            "geonameId": 4736286,
            "lat": "31.25044",
            "lng": "-99.25061",
            "name": "Texas",
            "population": 22875689,
            "toponymName": "Texas"
        },
        {
            "adminCode1": "TX",
            "adminName1": "Texas",
            "countryCode": "US",
            "countryId": "6252001",
            "countryName": "United States",
            "fcl": "A",
            "fclName": "country, state, region,...",
            "fcode": "ADM2",
            "fcodeName": "second-order administrative division",
            "geonameId": 4685912,
            "lat": "33.20526",
            "lng": "-97.11697",
            "name": "Denton County",
            "population": 662614,
            "toponymName": "Denton County"
        },
        {
            "adminCode1": "TX",
            "adminName1": "Texas",
            "countryCode": "US",
            "countryId": "6252001",
            "countryName": "United States",
            "fcl": "P",
            "fclName": "city, village,...",
            "fcode": "PPLA2",
            "fcodeName": "seat of a second-order administrative division",
            "geonameId": 4685907,
            "lat": "33.21484",
            "lng": "-97.13307",
            "name": "Denton",
            "population": 113383,
            "toponymName": "Denton"
        }
    ]
}
County Name API
For this workflow, we also needed to be able to extract the county name for a given latitude and longitude in the United States. Because of the way that the information is stored in the GeoNames services, there is no direct access to an API that will supply this information. This project used an API available through http://broadband.gov–another free Web service–that takes a specific place point and returns the associated county name and state Federal Information Processing Standards (FIPS) code. Broadband.gov is maintained by the National Telecommunications and Information Administration and provides a number of APIs for developers [16] interested in leveraging Broadband.gov’s data in local applications. This workflow needed a form of reverse geocoding, which turns a known point location into a readable value such as an address, city, county, or country.
The broadband.gov Web service does not indicate that it has a rate limit on the number of requests that can be made in a given amount of time. Even without a given rate limit, it is good practice to throttle requests to avoid swamping a service; in our case we decided to wait for two seconds after each request as a way of being polite.
Example 7. Broadband.gov county API request URL.
Example 8. Broadband.gov county API response.
{
    "Results": {
        "county": [
            {
                "envelope": {
                    "maxx": -99.47449799999997,
                    "maxy": 34.242023999999994,
                    "minx": -100.04847999999998,
                    "miny": 33.73384899999999
                },
                "fips": "48155",
                "geographyType": "COUNTY2010",
                "name": "Foard",
                "stateFips": "48"
            }
        ]
    },
    "message": [],
    "responseTime": 7,
    "status": "OK"
}
The response for this request includes the following fields:
Table 2. Example values returned by the broadband.gov county API.
| Field | Example Value |
| envelope | “maxx”: -99.47449799999997,
“maxy”: 34.242023999999994, “minx”: -100.04847999999998, “miny”: 33.73384899999999 |
| geographyType | COUNTY2010 |
| stateFips | 48 |
| fips | 48155 |
| name | Foard |
For this workflow, we are specifically interested in the stateFips value and the name value. We use these two values to construct a string for the location, for example “United States – Texas – Foard County” or “United States – Louisiana – Caddo Parish.”
Generating API Request URLs
Each API has specific coordinate value needs. The GeoNames citiesJSON Web service requires the north, south, east, and west coordinate values for given maps, while the counties API from broadband.gov requires just the latitude and longitude for the point you are interested in reverse geocoding. To accommodate this, the authors created a Python module [17] that will parse a simple text format containing bounding box information for each map. In this case, the input of the script is in the format described on the page “Map Sheet Corner Point Coordinate Files” from the U.S. Census Bureau [18]; the format contains the information for generating the coordinate values, as well as a unique identifier in the “Sheet Code” field that allows us to uniquely identify a map. Corner Point Coordinate Files are available for the P.L. 94-171 County Block, and P.L 94-171 Voting District/State Legislative District Outline and Census Tract Outline maps. For the topographic maps, it is relatively straightforward to generate the same kind of corner point file from the USGS topo map csv file, as it contains the needed information. The Python script in Example 9. uses Python’s standard csv module to convert a file downloaded from the National Map site into the corner point file format. The script adds the unique identifier for the map as well as the other fields.
Example 9. Python code for extracting Corner Point Coordinate File from USGS CSV.
import sys
import csv
import math

if len(sys.argv) != 2:
    print "usage: python extract_corner_points.py <usgs topo csv file>"
    exit(-1)

filename = sys.argv[1]

topos = csv.DictReader(open(filename))


def norm_cord(cord):
    cord = cord.strip()
    final_cord = math.fabs(float(cord)) * 1000000
    return str(int(final_cord))

for topo in topos:
    row = []
    row.append(topo["GDA Item ID"])
    row.append(norm_cord(topo["E Long"]))
    row.append(norm_cord(topo["W Long"]))
    row.append(norm_cord(topo["S Lat"]))
    row.append(norm_cord(topo["N Lat"]))
    row.append(norm_cord(topo["Scale"]))

    print "\t".join(row)
Once the data is in the same format for both the Census maps and the USGS topographic maps, subsequent code can be used for both series of maps, producing the same kind of place names for all of the map records.
The Python module written for this project is capable of constructing the request URLs for both the GeoNames and Broadband.gov APIs. These URLs are paired with a Wget command and a Sleep command, which when executed will download the response from the API, save it to a unique file, and then wait for a specified amount of time. The authors of the module set conservative default values for sleep values based on the Web service being used. The resulting output can be redirected into a new file, which will contain the scripting needed to make requests from the specific Web services.
Example 10. Example Broadband.gov output.
wget "http://www.broadbandmap.gov/broadbandmap/census/county?latitude=32.173850&longitude=-95.215715&format=json" -O 210048001000_ne.json ; sleep 1
wget "http://www.broadbandmap.gov/broadbandmap/census/county?latitude=31.418890&longitude=-95.215715&format=json" -O 210048001000_se.json ; sleep 1
wget "http://www.broadbandmap.gov/broadbandmap/census/county?latitude=32.173850&longitude=-96.072291&format=json" -O 210048001000_nw.json ; sleep 1
wget "http://www.broadbandmap.gov/broadbandmap/census/county?latitude=31.418890&longitude=-96.072291&format=json" -O 210048001000_sw.json ; sleep 1
wget "http://www.broadbandmap.gov/broadbandmap/census/county?latitude=31.796370&longitude=-95.644003&format=json" -O 210048001000_ct.json ; sleep 1
wget "http://www.broadbandmap.gov/broadbandmap/census/county?latitude=32.156354&longitude=-95.649899&format=json" -O 210048001001_ne.json ; sleep 1
wget "http://www.broadbandmap.gov/broadbandmap/census/county?latitude=32.033471&longitude=-95.649899&format=json" -O 210048001001_se.json ; sleep 1
wget "http://www.broadbandmap.gov/broadbandmap/census/county?latitude=32.156354&longitude=-95.789205&format=json" -O 210048001001_nw.json ; sleep 1
wget "http://www.broadbandmap.gov/broadbandmap/census/county?latitude=32.033471&longitude=-95.789205&format=json" -O 210048001001_sw.json ; sleep 1
wget "http://www.broadbandmap.gov/broadbandmap/census/county?latitude=32.094912&longitude=-95.719552&format=json" -O 210048001001_ct.json ; sleep 1
Example 11. Example GeoNames output.
wget "http://api.geonames.org/citiesJSON?north=32.173850&south=31.418890&east=-95.215715&west=-96.072291&lang=en&maxRows=100&username=demo" -O 210048001000.json ; sleep 10
wget "http://api.geonames.org/citiesJSON?north=32.156354&south=32.033471&east=-95.649899&west=-95.789205&lang=en&maxRows=100&username=demo" -O 210048001001.json ; sleep 10
wget "http://api.geonames.org/citiesJSON?north=32.151701&south=32.028676&east=-95.504864&west=-95.649899&lang=en&maxRows=100&username=demo" -O 210048001002.json ; sleep 10
wget "http://api.geonames.org/citiesJSON?north=32.146900&south=32.023732&east=-95.365412&west=-95.510608&lang=en&maxRows=100&username=demo" -O 210048001003.json ; sleep 10
wget "http://api.geonames.org/citiesJSON?north=32.046965&south=31.924375&east=-95.928524&west=-96.072887&lang=en&maxRows=100&username=demo" -O 210048001004.json ; sleep 10
wget "http://api.geonames.org/citiesJSON?north=32.042616&south=31.919882&east=-95.789205&west=-95.928524&lang=en&maxRows=100&username=demo" -O 210048001005.json ; sleep 10
wget "http://api.geonames.org/citiesJSON?north=32.038117&south=31.915241&east=-95.649899&west=-95.794585&lang=en&maxRows=100&username=demo" -O 210048001006.json ; sleep 10
wget "http://api.geonames.org/citiesJSON?north=32.033471&south=31.910452&east=-95.510608&west=-95.655454&lang=en&maxRows=100&username=demo" -O 210048001007.json ; sleep 10
wget "http://api.geonames.org/citiesJSON?north=32.028676&south=31.905515&east=-95.371331&west=-95.516337&lang=en&maxRows=100&username=demo" -O 210048001008.json ; sleep 10
wget "http://api.geonames.org/citiesJSON?north=31.928719&south=31.806134&east=-95.938923&west=-96.077906&lang=en&maxRows=100&username=demo" -O 210048001009.json ; sleep 10
For the state of Texas there are generally 4,500 – 7,800 maps per series. Each map requires one citiesJSON request, and at least five county API requests per map. For these projects a county request is made for each corner of the map and the center point.
Generating Metadata Records
Once we collected all of the cities and counties from the two APIs, the next step was to generate the needed metadata records for import into the repository system. In the case of these items, the metadata process followed a workflow similar to the workflow discussed for other collections going into the UNT digital collections system [19]. The city and county names for each map were de-duplicated and inserted into the metadata records (see Figure 1). In the case of the UNTL metadata specification [20], this information is added by the record creation scripts to the coverage element with a qualifier of placeName. We decided to include all cities and place names in the records, and to include a county only if it is not represented in the hierarchy of the city or place name values. The resulting coverage section can look like this:
Example 11. Place names as they appear in metadata record.
<coverage qualifier="placeName">
    United States - Arkansas - Miller County - Texarkana
</coverage>
<coverage qualifier="placeName">
    United States - Texas - Bowie County - Nash
</coverage>
<coverage qualifier="placeName">
    United States - Texas - Bowie County - Wake Village
</coverage>
<coverage qualifier="placeName">
    United States - Texas - Bowie County - Wamba
</coverage>
<coverage qualifier="placeName">
    United States - Texas - Bowie County - Whatley
</coverage>
<coverage qualifier="placeName">
    United States - Arkansas - Miller County
</coverage>
We also included information in each record about the outside boundaries of the map as well as the center of the map to display the location for online users (see Figure 2). These values were encoded using the Dublin Core Metadata Initiative’s (DCMI’s) Box Encoding Scheme [21] and Point Encoding Scheme [22] respectively. These are described in full detail on the DCMI’s Website and look like this when generated for the UNTL metadata format (which has coverage qualifiers for placePoint and placeBox):
Example 12. Place Point and Place Box values.
<coverage qualifier="placePoint">
    north=33.476531; east=-94.092814;
</coverage>
<coverage qualifier="placeBox">
    northlimit=33.526615; eastlimit=-94.032387; southlimit=33.426447; westlimit=-94.153241;
</coverage>
The resulting metadata file once constructed and added to The Portal to Texas History is as follows.
Example 13. Complete Census Map metadata record.
<?xml version="1.0" encoding="UTF-8"?>
<metadata>
  <title qualifier="officialtitle">
    1990 Census County Block Map (Recreated): Bowie County, Block 15
  </title>
  <title qualifier="seriestitle">1990 Census County Block Map</title>
  <creator qualifier="ctg">
    <type>org</type>
    <name>United States. Bureau of the Census.</name>
  </creator>
  <publisher>
    <location>Washington D.C.</location>
    <name>United States. Bureau of the Census.</name>
  </publisher>
  <date qualifier="creation">1990</date>
  <date qualifier="harvested">2013</date>
  <language>eng</language>
  <description qualifier="content">
      Parent map for Bowie County, Texas showing the area of one geographic block
      for which the U.S. Census Bureau collected data. The plotted map scale is 1:15,000.
  </description>
  <description qualifier="physical">1 map ; 84 x 92 cm.</description>
  <subject qualifier="LCSH">Census -- Maps.</subject>
  <subject qualifier="LCSH">Bowie County (Tex.) -- Maps.</subject>
  <subject qualifier="UNTL-BS">Places - United States - Texas - Bowie County</subject>
  <subject qualifier="UNTL-BS">Landscape and Nature - Geography and Maps</subject>
  <subject qualifier="KWD">census blocks</subject>
  <subject qualifier="KWD">statistical areas</subject>
  <primarySource>1</primarySource>
  <coverage qualifier="placeName">
    United States - Arkansas - Miller County - Texarkana
  </coverage>
  <coverage qualifier="placeName">
    United States - Texas - Bowie County - Nash
  </coverage>
  <coverage qualifier="placeName">
    United States - Texas - Bowie County - Wake Village
  </coverage>
  <coverage qualifier="placeName">
    United States - Texas - Bowie County - Wamba
  </coverage>
  <coverage qualifier="placeName">
    United States - Texas - Bowie County - Whatley
  </coverage>
  <coverage qualifier="placeName">
    United States - Arkansas - Miller County
  </coverage>
  <coverage qualifier="date">1990</coverage>
  <coverage qualifier="timePeriod">mod-tim</coverage>
  <coverage qualifier="placePoint">north=33.476531; east=-94.092814;</coverage>
  <coverage qualifier="placeBox">
    northlimit=33.526615; eastlimit=-94.032387; southlimit=33.426447; westlimit=-94.153241;
  </coverage>
  <collection>USCMC</collection>
  <institution>UNTGD</institution>
  <resourceType>image_map</resourceType>
  <format>image</format>
  <identifier qualifier="LOCAL-CONT-NO">90B48037_015</identifier>
  <identifier qualifier="LOCAL-CONT-NO">(90RBLK) 19348037015000000000</identifier>
  <note qualifier="display">Total Sheets: 41 (Index 1; Parent 27; Inset 13)</note>
  <note qualifier="display">Dimensions: 33 x 36 in.</note>
  <note qualifier="display">
    "All maps display the 1990 geography; however, the features displayed on these
    maps are those shown on the Census 2000 maps. These maps show the boundaries
    and numbers of the 1990 census blocks as well as the named features underlying
    the boundaries."
  </note>
  <note qualifier="nonDisplay">
    Additional information taken from Census Bureau website: "These large scale,
    large format (36" x 33") maps depict the smallest geographic entities for which
    the Census Bureau presents data, census blocks. The recreated 1990 Census Block
    maps were produced for counties. All maps display the 1990 geography; however,
    the features displayed on these maps are those shown on the Census 2000 maps.
    These maps show the boundaries and numbers of the 1990 census blocks as well
    as the named features underlying the boundaries. They also show the boundaries,
    names and codes for 1990 American Indian/Alaska Native areas, counties, county
    subdivisions, and places. The scale of the maps will be optimized to keep the
    number of map sheets for each area to a minimum, but the scale and number of
    sheets will vary by the area size of the county and the complexity of the census
    blocks."

    http://www.census.gov/geo/maps-data/maps/1990coublock.html
  </note>
  <meta qualifier="metadataCreator">mphillips</meta>
  <meta qualifier="system">PTH</meta>
  <meta qualifier="ark">ark:/67531/metapth363004</meta>
  <meta qualifier="metadataCreationDate">2014-01-05, 17:46:10</meta>
  <meta qualifier="hidden">False</meta>
  <meta qualifier="metadataModifier">mphillips</meta>
  <meta qualifier="metadataModificationDate">2014-01-10, 08:14:01</meta>
</metadata>
After the authors’ metadata creation scripts were finished, the resulting metadata files were paired with their corresponding map PDF files and loaded into The Portal to Texas History. They are presented both as high-resolution map images (see Figure 3) which can be navigated using the full screen zoom interface (see Figures 4 & 5), and as the original PDF format as it was downloaded from the agencies’ websites (see Figure 6).
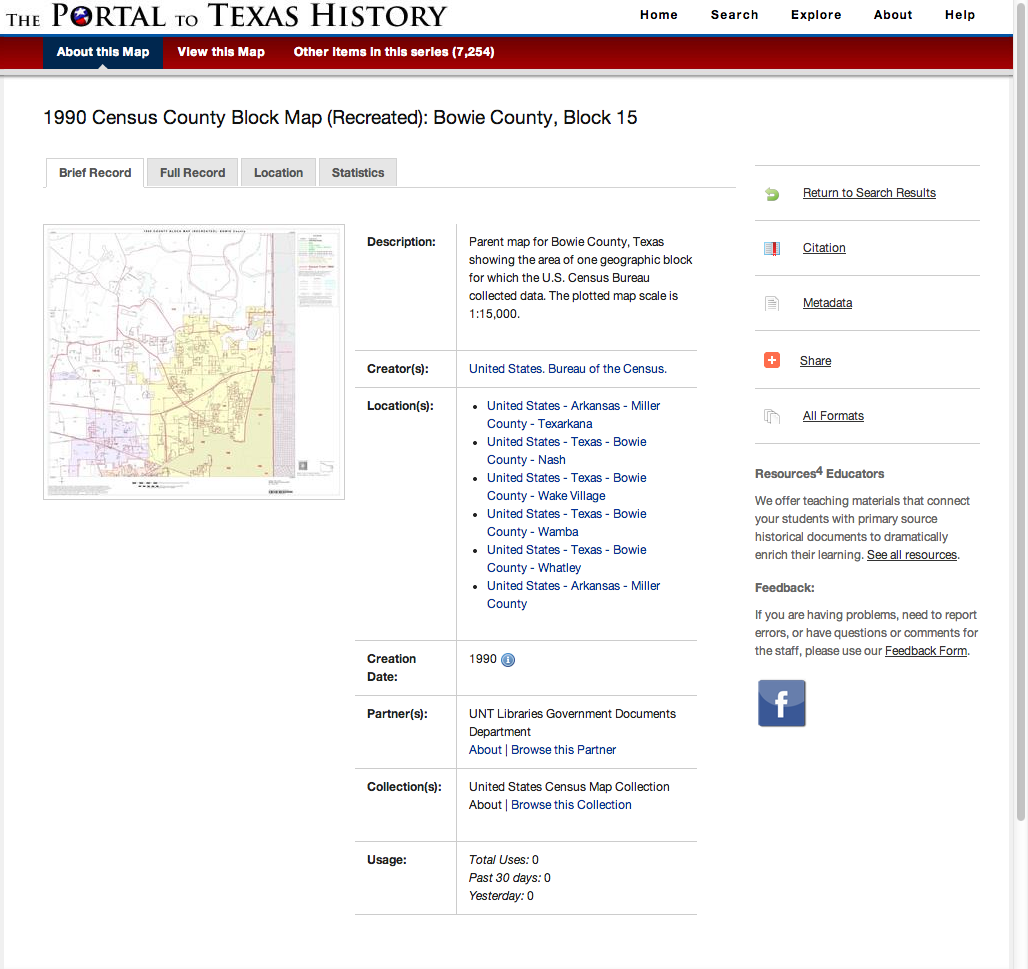
Figure 1: Landing page for an individual Census Reference Map.
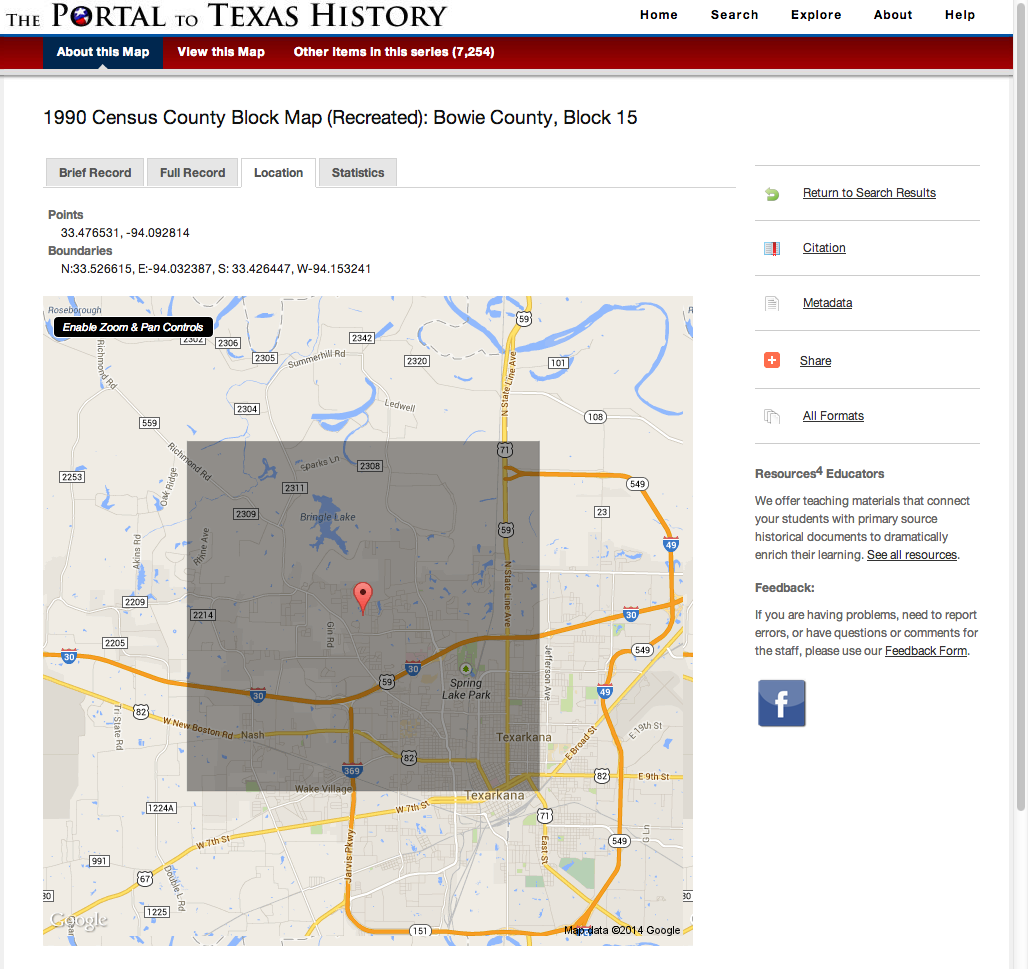
Figure 2: Bounding box and point information display in a census map record.
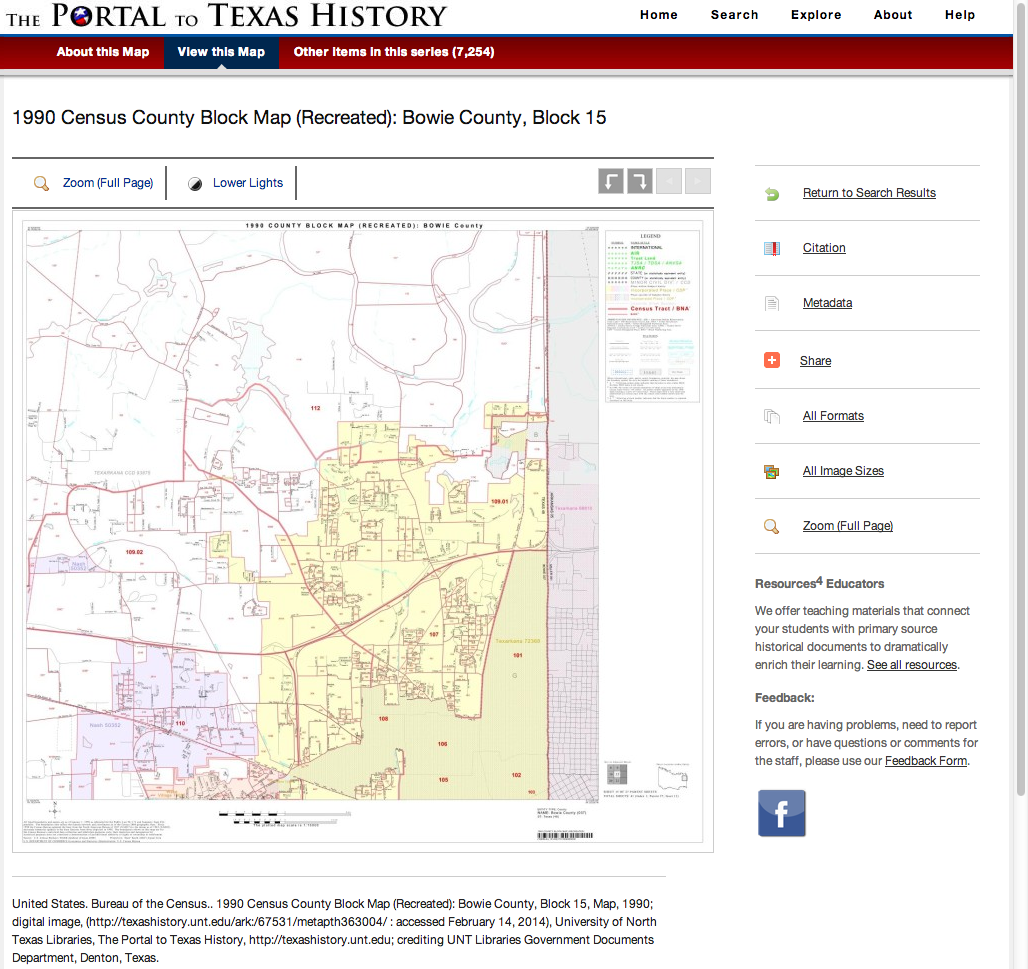
Figure 3: Image view of census map.
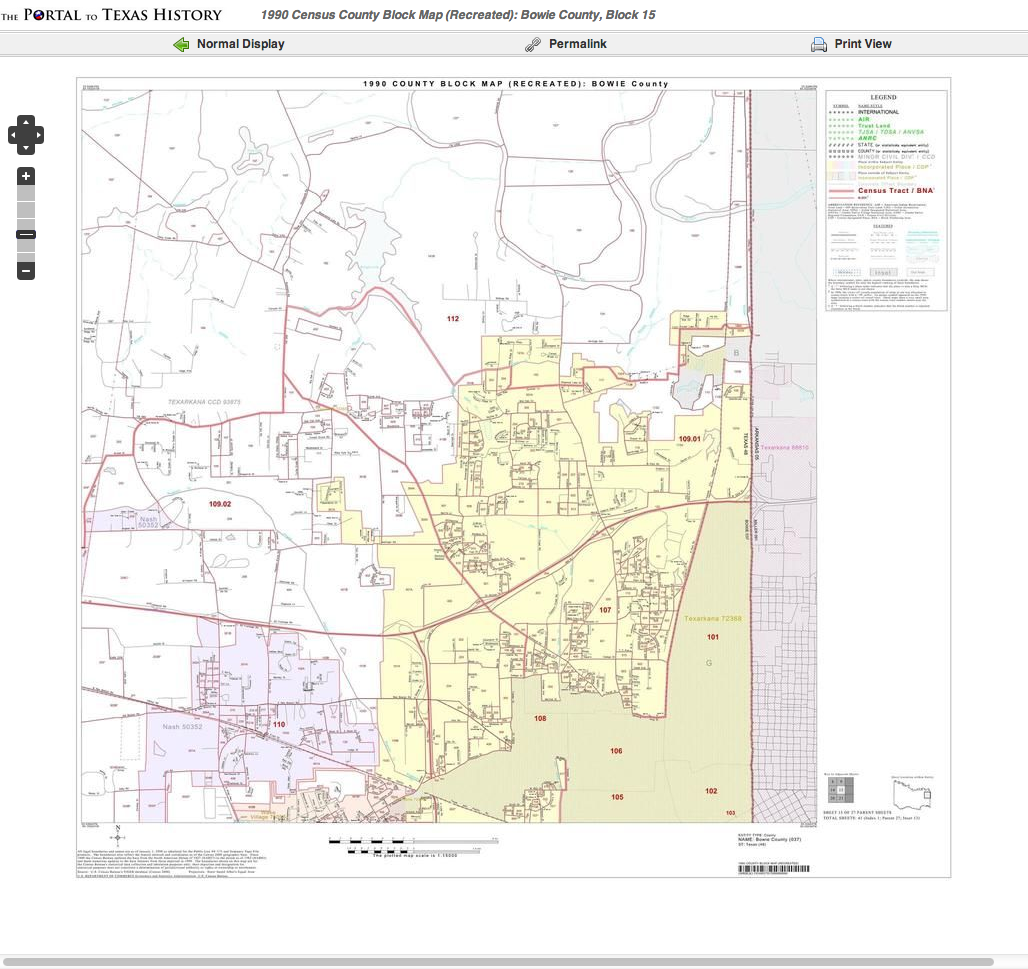
Figure 4: Map zoom interface.
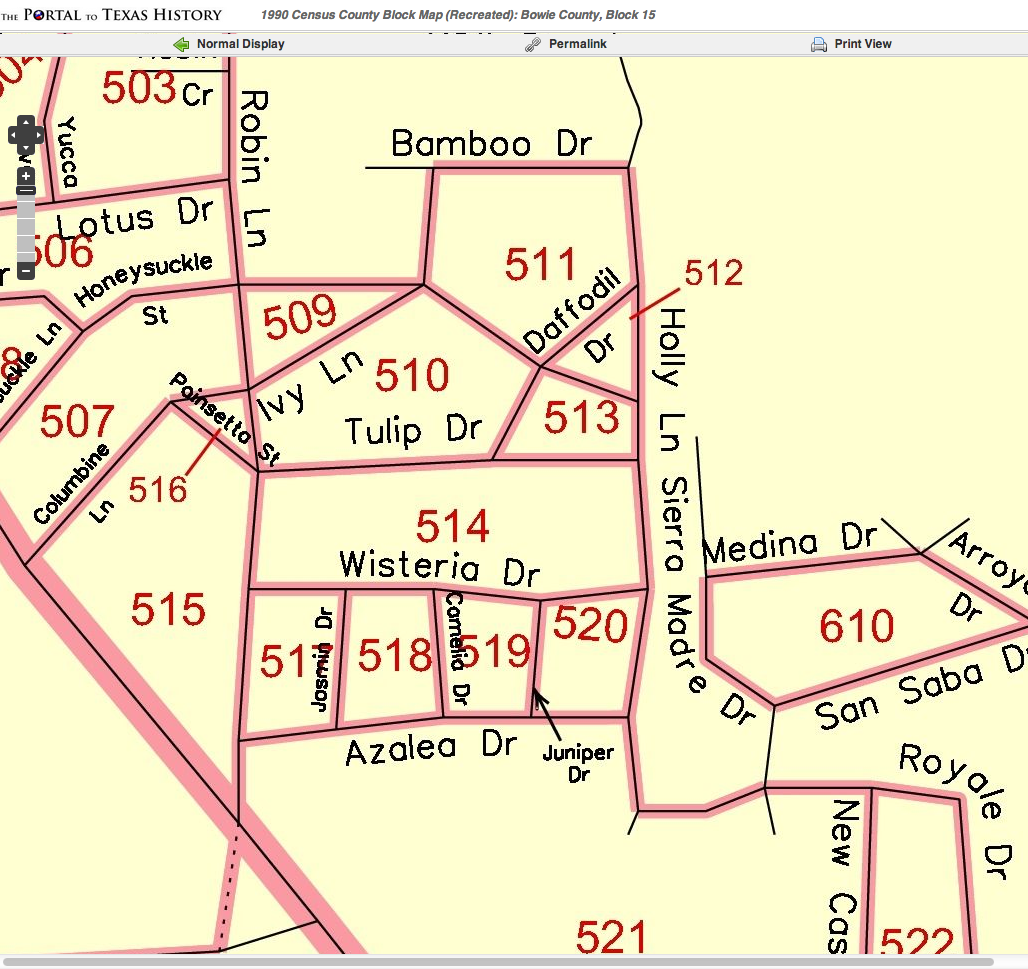
Figure 5: Detail view of map.
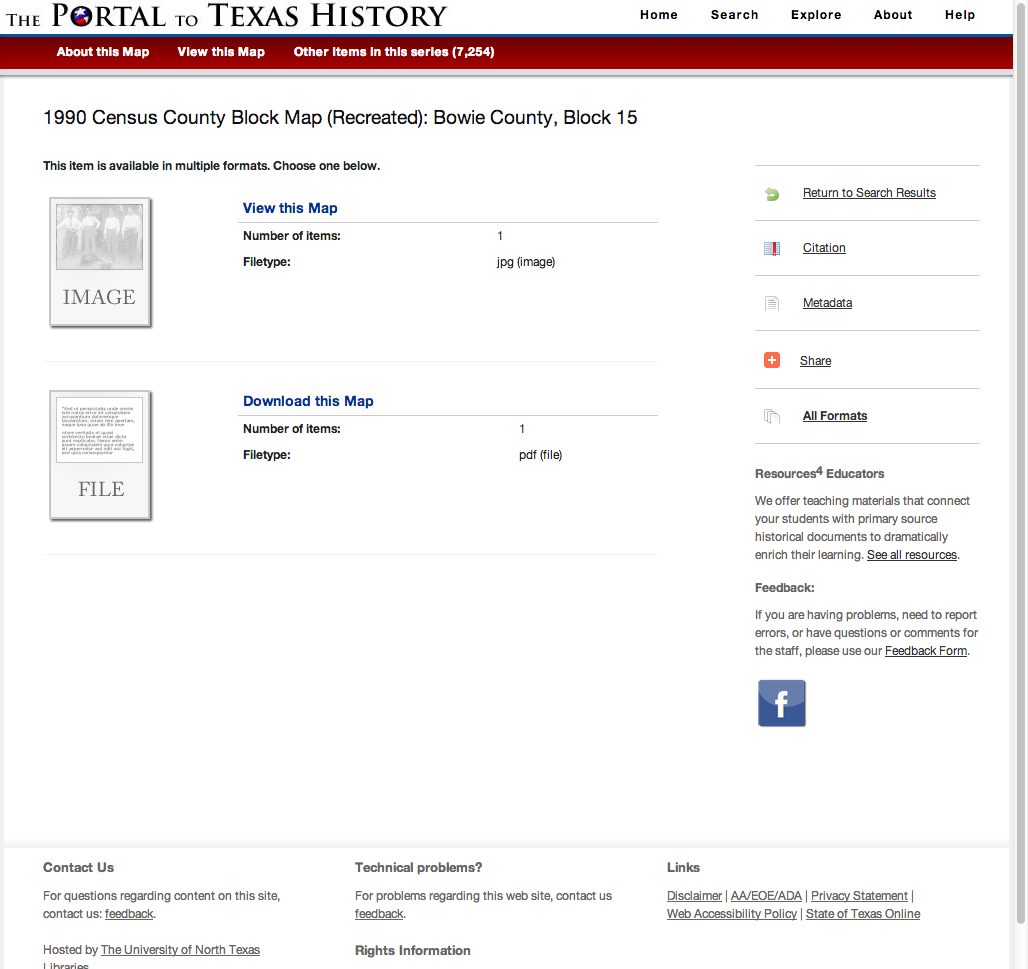
Figure 6: User access to view the image file or download the original PDF.
Closing
The workflow outlined in this article can be used by others who are interested in integrating maps for their states into their local repositories. The APIs and methods are easily adaptable and can be used in a number of applications. The ability to provide textual searching of the place names and county names for these maps increases the usability and discoverability of these maps. The enhanced metadata allows users to find all maps that show a particular county within the Portal collection without having to consult a paper index map. Likewise, a genealogist or historian can locate a map containing a specific place name or city name, which may not be indexed in any other way.
The UNT Libraries placed the first 8,556 Texas Topographic maps online over the past three years; to date they have received over 61,700 uses [23]. The U.S. Census maps were placed online in January of 2014 and at the time of this publication had already received 1,692 uses [24] by the public. The relatively high usage of these two collections illustrates the importance of providing high-quality metadata, hosting, and access for born-digital map collections on the Web. The collections also represent examples of ways that metadata records can be augmented and enhanced by simple, freely-available APIs. This allows organizations to potentially add large, high-demand collections to existing digital collections with a relatively small commitment of time and staff resources.
References
[1] The Portal to Texas History; http://texashistory.unt.edu/
[2] USGS Topographic Map Collection; http://texashistory.unt.edu/explore/collections/USTOPO/
[3] United States Geological Survey; http://www.usgs.gov/
[4] USGS Topographic Maps; http://topomaps.usgs.gov/
[5] US Topo Quadrangles, United States Geological Survey; http://nationalmap.gov/ustopo/index.html
[6] The USGS Store; http://store.usgs.gov/
[7] The National Map, United States Geological Survey; http://nationalmap.gov/index.html
[8] United States Census Bureau; https://www.census.gov/
[9] U.S. Census Reference Maps; https://www.census.gov/geo/maps-data/maps/reference.html
[10] United States Census Map Collection; http://texashistory.unt.edu/explore/collections/USCMC
[11] The National Map: Historical Topographic Map Collection; http://nationalmap.gov/historical/
[12] Wget; https://www.gnu.org/software/wget/
[13] GeoNames; http://www.geonames.org/
[14] 1990 Census County Block Map (Recreated): Cherokee County, Index; http://texashistory.unt.edu/ark:/67531/metapth358801/
[15] GeoNames Hierarchy Webservice; http://www.geonames.org/export/place-hierarchy.html
[16] Broadband.gov Developer; http://www.broadbandmap.gov/developer
[17] corner_points_parser; http://github.com/vphill/corner_points_parser
[18] Map Sheet Corner Point Coordinate Files, U.S. Census Bureau; http://www2.census.gov/geo/tiger/rd_2ktiger/pl_maps/cornerpt/cornerpt.html
[19] Phillips, Mark, Hannah Tarver, and Stacy Frakes. “Implementing a Collaborative Workflow for Metadata Analysis, Quality Improvement, and Mapping.” Code4Lib Journal. n. page. Web. 17 Jan. 2014. http://journal.code4lib.org/articles/9199
[20] UNT Libraries Metadata Documentation; http://www.library.unt.edu/digital-projects-unit/metadata/
[21] DCMI Box Encoding Scheme; http://dublincore.org/documents/dcmi-box/
[22] DCMI Point Encoding Scheme; http://dublincore.org/documents/dcmi-point/
[23] Statistics for USGS Topographic Map Collection; http://texashistory.unt.edu/explore/collections/USTOPO/stats/
[24] Statistics for United States Census Map Collection; http://texashistory.unt.edu/explore/collections/USCMC/stats
About the Authors
Mark Phillips is Assistant Dean for Digital Libraries at the University of North Texas Libraries.
Hannah Tarver is Head of the Digital Projects Unit at the University of North Texas Libraries.

Subscribe to comments: For this article | For all articles
Leave a Reply