by Joyce Chapman and Cory Lown
Background
Launching a data-analysis program is challenged in equal parts by organizational and technical considerations, and while libraries have recognized for years the importance of using data to drive decision-making, translating this recognized need to the day-to-day operations of the library can be daunting. While a full-fledged data-analysis program may not be feasible for many organizations, this should not stand in the way of grassroots data-analysis efforts. Working from the bottom up to build a culture of data analysis is possible at each of our institutions, and technically-oriented librarians are in a unique position within the library to facilitate data-analysis work. Most technically-oriented people bring a set of computational thinking skills to bear on problem solving that is invaluable throughout the process of data analysis: define the problem; collect, structure, and process data; understand the importance of normalization; and understand basic statistics (Wing, 2006; Weyland, 2009). They often have an understanding of the kind of transactional data that are produced within the library, the kind of questions that data are capable of addressing, and how to access and process that data to make it useful. In short, technically-oriented staff are in a unique position to conduct outreach and work with others who have data-analysis needs throughout the library, working beyond day-to-day roles to bring their computational thinking skills to bear on data analysis.
At NCSU Libraries various groups across the institution are working on data analysis to inform decision-making. While some departments are able to meet their own data-analysis needs, others are in need of help. In working with librarians throughout our organization we have found that while structured data is collected by many, it often remains underutilized. The reasons for this vary from a lack of time and resources, a lack of knowledge of how to analyze the data, or an unclear understanding of the questions that staff want the data to answer. We have also found that staff may be unaware of the various data sources available for analysis across the Libraries, and that data is often collected without a clear sense of what questions the data will be used to answer. Additionally, data that is collected by hand may not be normalized, either because data collectors are unclear on the ways in which data must be normalized or formatted to facilitate programmatic analysis, or because a clear purpose and process for the data collection was never established.
In this article we discuss our experiences and lessons learned as technology-oriented staff working to encourage bottom-up data-analysis at our library. We focus on data analysis for low-level decision-making about library products and services; we do not address collecting data for ARL statistics, Total Quality Management analysis, LibQUAL+®, using data to determine the value of libraries, or for high level management decisions. We are interested in the use of quantitative data that can help librarians answer questions that they can use to make effective changes to products and services on the ground. Examples of such questions at NCSU include: does demand outstrip availability for items such as public computers, device lending, or books in the textbook collection at certain points in the semester or time of day? Can we modify staffing models or opening hours to best suit patron needs in areas such as the Special Collections reading room or the reference desks? By identifying levels of use for specific features of web applications, can we modify design or content in order to maximize value to patrons? While qualitative data is important for understanding the “whys” of trends, collecting and interpreting such data requires significant time commitment. We focus on quantitative data because we perceive it to be more practical for low-barrier, ongoing analysis efforts. In many cases, the initial effort of collecting and processing data can be leveraged into the future with minimal further investment in time or development.
Getting Started
We found that a useful first step toward organizing data-analysis efforts was compiling a list of current data collection activities by conducting interviews with department heads and other staff across the Libraries. Not only did this generate documentation and provide a broad view of the Libraries’ extant data collection activities, it served as the initial outreach to various departments and units, broaching the topic of data-analysis. The documentation became the basis of a decision matrix for assessing opportunities and challenges associated with analyzing particular data sets. The decision matrix comprised a list of the data sources and answers to a series of questions about each data source. Questions we found valuable in assessing data sources included:
- Are there clear stakeholders and technical contacts for this data source?
- Can stakeholders articulate the questions they want answered through data analysis?
- Can the available data answer these questions?
- What is the format of the data source?
- What is the cost of normalizing the existing data?
- Would analyzing this data be of value to one or more stakeholders, departments, and/or the Libraries as a whole?
Explicitly compiling this data for each data source forced us to pursue answers to unknown aspects of data sources before proceeding. The process of compiling this decisions matrix — as well as the resulting documentation — helped us identify low cost, high value opportunities for analysis. These were projects that had clean data, enthusiastic stakeholders with questions they wanted answered, and the results of which had the potential to be interesting to a broad range of staff. Data sources we were more reluctant to pursue for analysis had the following characteristics: they did not have clear stakeholders or the stakeholders did not have strong interest in analysis, the data would require extensive cleanup and workarounds, or results from analysis would be of only narrow interest. However, if the results of data analysis were perceived to be of high enough value to the Libraries, a high cost in one of these areas would not be considered a barrier.
Data structure and planning
As we documented data sources, it became clear that the mere act of collecting data does not necessarily make that data well suited to answering the questions of stakeholders. While it is not always possible to know how data will be used in the future, this problem seems to arise most frequently when data collection had been identified as something that should be done but is undertaken without knowledge of what questions the data will eventually need to answer. In such cases, data elements might be missing that would be required to answer questions, the data might not be normalized, or data might not be interoperable with another data source. While impossible to avoid at times, collecting data without a clear understanding of how the data will be used can have organizational implications: primarily, limited utility of the data for answering some questions and a data format or structure that limits the possibility for programmatic analysis of the data.
One challenge of trying to make use of data that has already been collected is that data collection practices can change over time. In many such cases, the data collection practices improved significantly over the course of several years. Although it is desirable to improve data collection practices, shifting practices can make longitudinal analysis difficult or impossible. Transactional data maintained by systems such as the integrated library system (ILS) can also contain hidden challenges. It is important to know that the transactions recorded by the system accurately represent what you are attempting to measure. For instance, it would be important to know if the ILS differentiates checkouts by library users and checkouts for internal processes (Weyland, 2009).
Another pattern we discovered is that many people have difficulty conceptualizing questions that data with particular characteristics can answer. We found it to be helpful for stakeholders if we presented examples of reports from previous data-analysis projects to provide ideas about the questions data can help answer. Using broad categories as a prompt for thinking about useful questions was also an effective technique when working with potential stakeholders. For example:
- Are you interested in trends across different units of time (years, semesters, days, hours of the day)?
- What traits about patrons (affiliation, major, geographic location) do you think might be useful to understand the use of this service or application?
Over the course of conducting several data-analysis projects as collaborations between technical staff and stakeholders, we identified a number of beneficial results from conversations between these two groups. Technically-oriented staff were able to gain a broader perspective on the concerns of the organization and data collection activities as they currently exist and the departments we worked with benefited from discussions about data collection techniques and structuring, as well as the kind of questions data can help answer. We are hopeful that a future outcome of these conversations will be better planning from the start for data collection efforts and that utility and ease of analysis will drive data collection practices.
Data Storage and Dissemination
Storage and dissemination of data should be considered carefully, especially as a portfolio of multiple data-analysis projects grows. How and where you choose to store the data impacts its accessibility and utility for analysis. For projects that involve computer-generated transaction logs (which were typically either transaction reports exported from our ILS or custom transaction logs for home-grown applications), we found it useful to create a single directory on the server with sub-directories for each project or application. There are a number of benefits to this: starting a collection of curated data sets, setting access permissions can be handled on one directory, and with the data in one place you or others may find opportunities to re-purpose data in the future.
We also found that a number of different methods were useful for sharing findings once the data had been analyzed. In some cases we provided a static written report to stakeholders. Because analysis was usually being offered as a one-time service rather than an ongoing one, this was done in cases where significant data clean up had been required to meet analysis needs or the data could not be easily collected into the future and lent itself more readily to a snapshot of a particular service or application. In other cases the cost of continuing to collect transaction data over time was low and it was deemed beneficial to be able to view statistics about a particular application or service at any point in time. In these cases custom PHP scripts were written to parse the transactional data and generate web-based reports based on the most current data. We found Google’s Visualization API to be extremely useful for generating web-based charts and graphs based on the latest log data (Google, 2010).
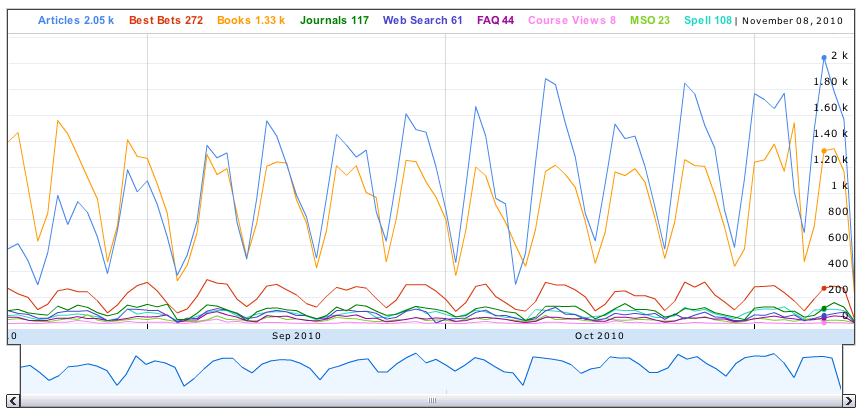
Figure 1. Google Visualization API interactive chart: Annotated Time Line for QuickSearch modules clicks by day
When developing custom transaction logs for specific applications we found particular tab-delimited field types useful across projects. A Unix timestamp makes time-based comparisons and math simple. It can also be useful to include a human readable date and time to make the logs easier to inspect. In some cases an IP address is useful, although this can be excluded in cases where the transaction may record more personal information such as query terms. These initial fields are then followed by a series of categorizing codes specifying information such as a type of action, a computer’s physical location, a query term, or other relevant information about a transaction. In developing custom logs we have attempted to balance utility and simplicity. This modest level of standardization also eased development of scripts to parse the logs and produce reports. Below is an example of data collected by a custom log file.
// Timestamp IP address Library Region code Computing platform Action
1250266660 152.1.107.147 VML 016 PC LOGIN
1250266663 152.1.222.47 HILL 003 MAC LOGOUT
Over time log files can grow quite large. If processed without memory efficiency in mind it is easy to run into memory limitations. Using PHP we found it useful to process the log file within a do-while loop line by line such that any calculations performed were only performed on lines meeting certain criteria and we only store values when necessary. Below is an example of a simple PHP script to parse a typical log file.
if ($input_logfile) {
    do {
        $log_input_line = fgets($input_logfile);
        list($timestamp, $ip_address, $library, $region_code, $platform,
            $action) = explode("\t", $log_input_line);
        // Do whatever you want with the data...
    } while (!feof($input_logfile));
      fclose($input_logfile);
} else {
    print "Unable to open logfiles\n";
    return;
}
One advantage of using the Google Visualization API is that the JavaScript used to create the charts and graphs can be generated by PHP with values calculated directly from transaction logs. This ensures that the report stays up to date with the most current log data. In these cases we found it useful to create a web directory to collect these script-generated reports, with a sub-directory for each application or service. Over time, as the number of these reports increases, having them in one location will simplify setting permissions and increase the discoverability and utility of the reports. Below is an example of the JavaScript input for the Google Visualization API as well as an example of a PHP script to output data from an array into the required JavaScript data value format.
<script type="text/javascript" src="http://www.google.com/jsapi"></script>
<script type="text/javascript">
  google.load("visualization", "1", {packages:["corechart"]});
  google.setOnLoadCallback(drawChart);
  function drawChart() {
    var data = new google.visualization.DataTable();
    data.addColumn('string', 'Curriculum');
    data.addColumn('number', 'Total requests');
    data.addRows(3);
    data.setValue(0, 0, 'English');
    data.setValue(0, 1, 14269);
    data.setValue(1, 0, 'Adult & Higher Education');
    data.setValue(1, 1, 11396);
    data.setValue(2, 0, 'Sociology');
    data.setValue(2, 1, 6132);
    var chart = new google.visualization.PieChart(document.getElementById('chart_div'));
    chart.draw(data, {width: 600, height: 500, legend: 'right'});
  }
</script>

<?php
$i = 0;
foreach ($use_by_curriculum as $curriculum => $count){
    print "data.setValue($i, 0, '$curriculum');\n data.setValue($i, 1, $count);\n";
    $i++;
}
?>
We have also centralized the code that parses popular units of time (such as academic years and semester boundaries) in a single file accessible to all other scripts. In this way, web-based reports can stay up to date and provide valuable information about the performance of the services and applications as needed without having to create new reports by hand. An example of the dates file is shown below.
// SPRING SEMESTER, 2010
if (($date >= "2010-01-11") && ($date <= "2010-05-16")) {
    $semester = "spring";
    $academic_year = "2009-2010";
if ($date >= "2010-01-11" && $date <= "2010-01-17") {
    $week = 1;
    // ... Intermediate weeks removed ...
} elseif ($date >= "2010-05-10" && $date <= "2010-05-16") {
    $week = 18;
}
$semester_date_information = array(
    'academic_year' => $academic_year,
    'semester' => $semester,
    'week' => $week
);
Examples of collaborative data analysis at NCSU
Below are some examples of data-analysis projects conducted at NCSU by technical staff working together with various stakeholders throughout the Libraries. Not all of these projects were conducted by the authors; the examples represent a growing trend of collaborative grass-roots data analysis at NCSU Libraries over the past few years.
Reference Transactions
Data-analysis projects can be conducted without any programming skills or specialized software. The key is planning how data will be structured, what questions will be asked, and whether the data can answer those questions. We recently worked with the Reference and Information Services (RIS) department to analyze trends in reference transactions with patrons. Questions that RIS had for their data included:
- What longitudinal trends do we see in library reference? What trends do we see over the course of semesters and days?
- What trends do we see in library chat reference?
- What patterns exist within different types or different media of reference?
- Do trends in library reference correspond in any way to trends in other library usage patterns, such as gate counts or computer usage?
Most of the data related to reference transactions is gathered manually and stored in Microsoft Excel spreadsheets, so we decided to create graphs and conduct most data analysis in Microsoft Excel as well. This tool was familiar to stakeholders and was able to meet stakeholders’ needs just as well as more complex tools would have. Findings aided staff in understanding issues such as peak hours of the day and weeks of the semester for reference transactions, and trends in the content type and media of staff transactions with patrons over time.
QuickSearch
Launched in 2005, QuickSearch is a home-built federated search tool designed to connect users to a variety of library resources, services, and tools (Sierra, 2007). QuickSearch runs the primary search box on the NCSU Libraries website and provides results from various sources including Serial Solutions’ Summon articles database, our Endeca-based catalog, the library website, and journal titles. QuickSearch is managed by a team of librarians from the Research and Information Services and the Digital Library Initiatives departments. Before 2010, use statistics from QuickSearch were gathered from Urchin, the web analytics tool. In an effort to provide more robust and detailed reports about use of the search application we began custom logging of QuickSearch in January 2010. The logs contain a timestamp, information on whether the transaction is a SEARCH (user performs a search) or a CLICK (users follows the URL of a result), and if it is a CLICK, details about the specific sub-module and link within QuickSearch that the user follows. Questions the QuickSearch Product Team wanted to be able to answer on an ongoing basis include:
- What is the ratio of clicks to searches within QuickSearch as a measure of whether results are meeting user needs?
- Which modules (articles, catalog, website, journals, etc.) are the most frequently selected results within the results page?
- How does use of the search application change over the course of the semester?
- What are the most commonly searched terms?
The resulting reports, which were written by a member of the QuickSearch Product Team, have been used to analyze use patterns and influenced a major redesign of the results page. The redesign prioritized giving article and catalog results primary and nearly equal real estate on the page due to evidence of close to equal utilization. Prior to redesign, articles had been given primary real estate and catalog results were provided less space. Additionally, the reports have been used to ensure that the redesign did not reduce the click to search ratio (0.76 clicks per search in the semester prior to redesign, 0.88 in the first 3 months of the semester following redesign), which would indicate a problem with the results pages failing to prompt a URL selection by users, and thus a less effective design. Additionally, a report that displays the most frequently searched terms has been used to ensure that the search tool works effectively for these frequently searched terms.
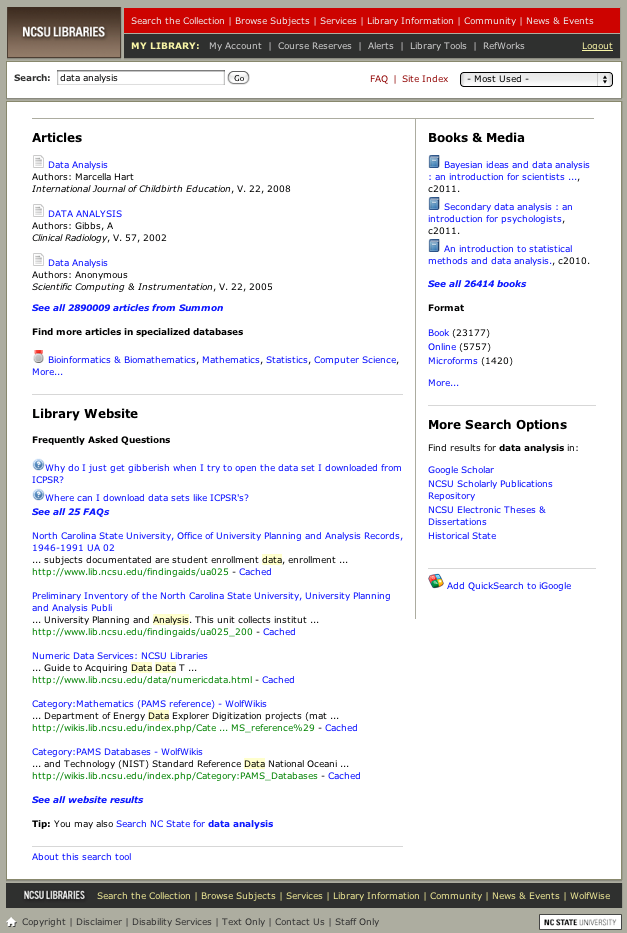
Figure 2. Pre-redesign QuickSearch results page
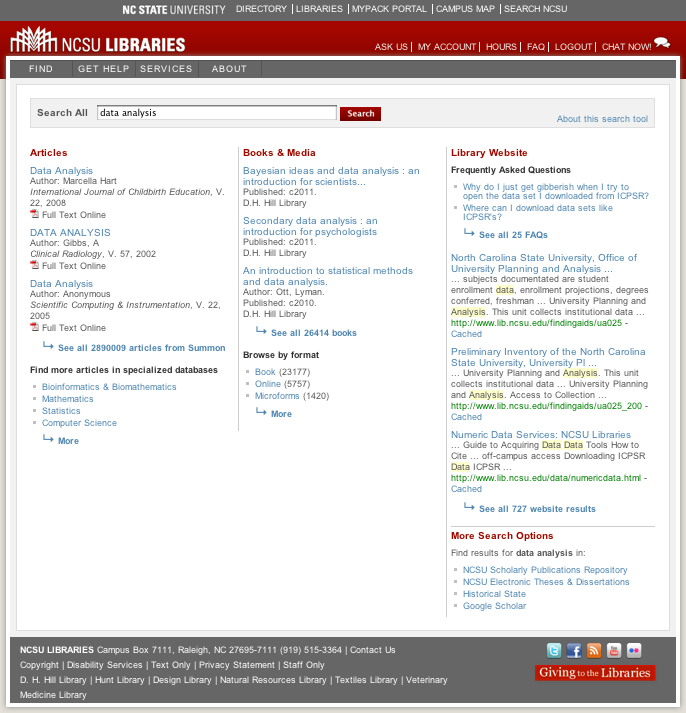
Figure 3. Post-redesign QuickSearch results page
Library Course Tools
The Library Course Tools application dynamically generates student-centric views of library resources and tools for each unique course taught at NCSU and was developed in 2008 through a partnership between Digital Library Initiatives and Reference and Instructional Services staff (Casden et al. 2009). Staff worked together not only to develop and implement the product, but also to identify data collection needs and implement custom logging. The stakeholders’ questions included the following:
- How has the use of Library Course Tools changed since the launch?
- How does use fluctuate over the course of the semester?
- What are the most and least used curricula?
- What widget content is most useful to students?
Because the data source for Library Course Tools is a custom transaction log on a server, the data is available for real-time analysis. For the parsing and generating of reports, the Google Visualization API was chosen to display the results of data analysis. Because technical and non-technical staff had collaborated on the project from the beginning, the log data source was structured in a way that was accessible for programmatic data analysis. According to stakeholders, data analysis helped them understand the community’s interaction with Library Course Tools and the ways in which the application needed to change in order to better meet student needs. Data analysis showed that widgets lacking dynamic content were used far less than other types of widgets. This information led stakeholders to develop more dynamic and curriculum-focused content for widgets. The ability to view the curricula for which the most Library Course Tools pages were used helped stakeholders understand that there was a clear correlation between librarian participation and use of the tool. For example, the very high use of Library Course Tools by Chemical Engineering students (relative to the size of that population) is hypothesized to be a direct result of the enthusiasm for the project and resulting outreach and content creation by the librarians who work in this area.
Special Collections patron base and physical materials usage analysis
In 2007 the Special Collections Research Center (SCRC) at NCSU Libraries developed a Microsoft Access database in which to store information about patron registrations, material transfers, and materials use. While the department was long aware that the data could inform them of important trends in collections use and patron base, they did not have the technical resources on hand to conduct an in-depth analysis of the data. We discovered this rich data source through the previously-mentioned outreach program during which we approached different departments and discussed data-analysis services that could be offered. Through a discussion with SCRC curators, staff, and department administrators we gained an understanding of the department’s data-analysis needs. Because the data was managed in a Microsoft Access database stored on a file system rather than a web server, we chose not to produce live reports with the Google Visualization API. Instead, a one-time snapshot of use covering a three-year period (the time available since the inception of the database) was prepared as a static report. Data from exported database tables was analyzed programmatically and Adobe Illustrator was used to create graphics. “One example of how results helped the department better understand user behavior was an analysis of the percentage of total use of physical materials by hour of the day (shown in figure 4).”
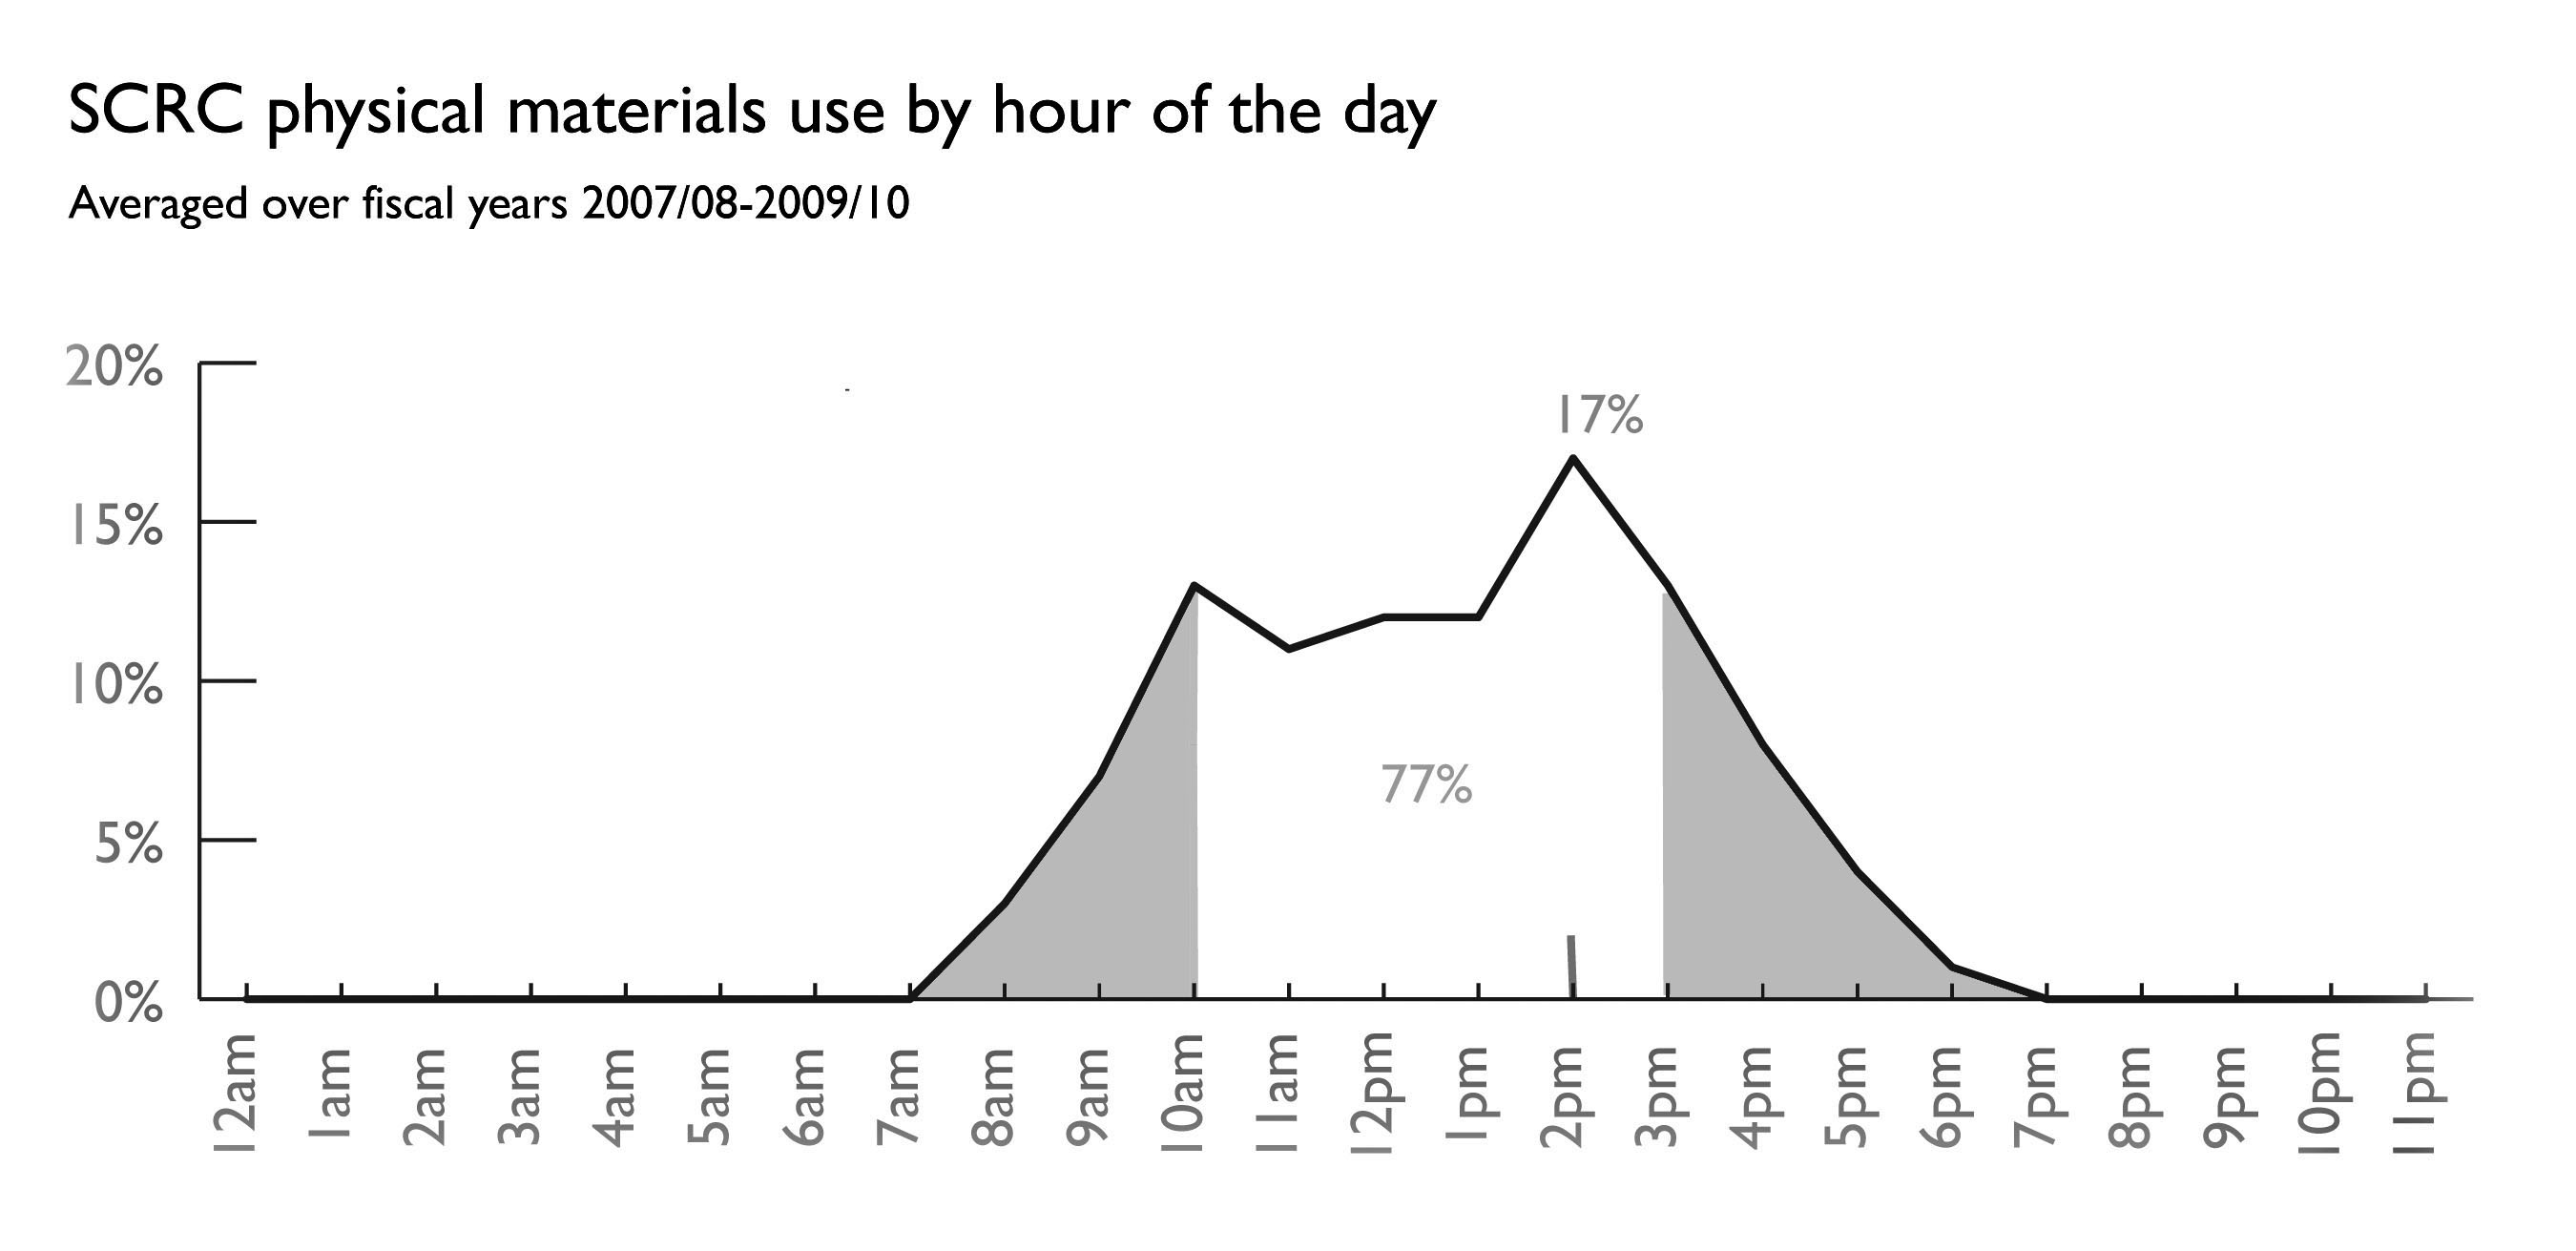
Figure 4. Example of a graph created for SCRC in Adobe Illustrator and Photoshop
Challenges with this project included data that was not able to answer stakeholder questions and issues with data structure or normalization. For instance, we found that certain data elements were not tracked that would be crucial to addressing several of the questions the department wanted answered. For example, the question of which collecting areas receive the most use could not be easily answered because the collecting areas to which a collection pertains are not tracked. Another example is related to types of use; while use could be broken down by frequency of material checkouts, it could not be analyzed from the point of view of discrete research projects because the concept of a multi-day research session as distinct from individual circulations of a resource is not currently accounted for in data collection. Issues with data structure and normalization included problems with inconsistent primary keys between tables, a small number of missing records, and legacy data that had been imported without being updated to the current format. These were by no means insurmountable problems, but resulted in some data that could not be included in analysis.
Conclusion
While launching a successful data-analysis program can be challenging and large-scale data-analysis programs may not be feasible for many organizations, each of us can work from the bottom up to foster a culture of cooperative data analysis at our institution. We think that technically-oriented librarians are in a unique position to facilitate data-analysis work by bringing computational thinking skills to bear in collaborative efforts throughout the library. Although there is undeniably a time-commitment involved in initiating this kind of effort, especially in cases where data-analysis and interdepartmental outreach are not part of one’s usual responsibilities, we think the short term and long term benefits are significant. At NCSU Libraries, a grassroots approach to data analysis with cooperation between technically-oriented librarians and departmental stakeholders has yielded positive short term results, helping a variety of departments to answer questions about how patrons use specific library applications and services. Developing strong collaborative partnerships between departments is both a challenge and a positive outcome of this approach. Longer term, we hope these efforts can increase awareness of good data collection practices and of the opportunities that exist to leverage data to answer questions that can help libraries improve applications and services, as well as foster a spirit of collaboration between library departments. Additionally, the effort to develop custom logs with live reports programmed in PHP and the Google Visualization API will continue to pay off in ongoing assessment efforts. Along with others at our library, we continue to develop a set of practices that we hope will solidify data collection and assessment as part of the planning process for services and applications from their inception.
References
Casden J, Duckett K, Sierra T, Ryan J. 2009. Course Views: A Scalable Approach to Providing Course-Based Access to Library Resources. Code4Lib Journal [Internet]. [cited 2010 Dec 6]; 6. Available from: http://journal.code4lib.org/articles/1218
Google. 2010. Google Visualization API [Internet]. [cited 2010 Dec 6]. Available from: http://code.google.com/apis/visualization/interactive_charts.html
Sierra T. 2007. A Single Search Box Interface to the NCSU Libraries, Two Years Later. Digital Library Federation Spring Forum 2007. Pasadena, California. 2007 Apr 24; [cited 2010 Dec 6]. Available from: http://www.slideshare.net/tsierra/tsierradlfspringforum2007
Weyland M. 2009. The Wise Use of Statistics in a Library-Oriented Environment. Code4Lib Journal [Internet]. [cited 2010 Dec 6]; 6. Available from: http://journal.code4lib.org/articles/1275
Wing J. 2006. Computational Thinking. Communications Of The ACM 49(3):33-35. (COinS)
About the Authors
Joyce Chapman is a Libraries Fellow at North Carolina State University Libraries where she works in the Digital Library Initiatives and Metadata & Cataloging departments. She is currently working on a project to analyze and visualize library usage data.
Cory Lown is Digital Technologies Development Librarian in the Digital Library Initiatives Department at North Carolina State University Libraries. At the moment, he focuses on developing supplements to special exhibits for mobile devices.

Subscribe to comments: For this article | For all articles
Leave a Reply